Lithuania Plastic Recycling Machine Market (2026-2032) | Forecast, Growth, Value, Share, Analysis, Size & Revenue, Segmentation, Competitive Landscape, Trends, Outlook, Companies, Industry
Market Forecast By Type (Combined Machines, Shredders, Extruders, Grinders, Mixers, Sorters, Washers, Others (Densifier, Pelletizer, etc.)), By Category (Single Stage Plastic Recycling Machines, Two Stage Plastic Recycling Machines, Multi Stage Plastic Recycling Machines), By Technology (Automatic, Semi-automatic), By Output (Up to 100 kg/hr., >100 kg/hr. to 500 kg/hr., >500 kg/hr. to 1000 kg/hr., Above 1000 kg/hr.), By Application (Post-industrial Recycling (PIR), Post-consumer Recycling (PCR), Improvement Applications), By Distribution Channel (Direct Sales, Indirect Sales) And Competitive Landscape
| Product Code: ETC8048676 | Publication Date: Sep 2024 | Updated Date: Apr 2026 | Product Type: Market Research Report | |
| Publisher: 6Wresearch | Author: Summon Dutta | No. of Pages: 75 | No. of Figures: 35 | No. of Tables: 20 |
Lithuania Plastic Recycling Machine Market - Import Trends (2019-2025)
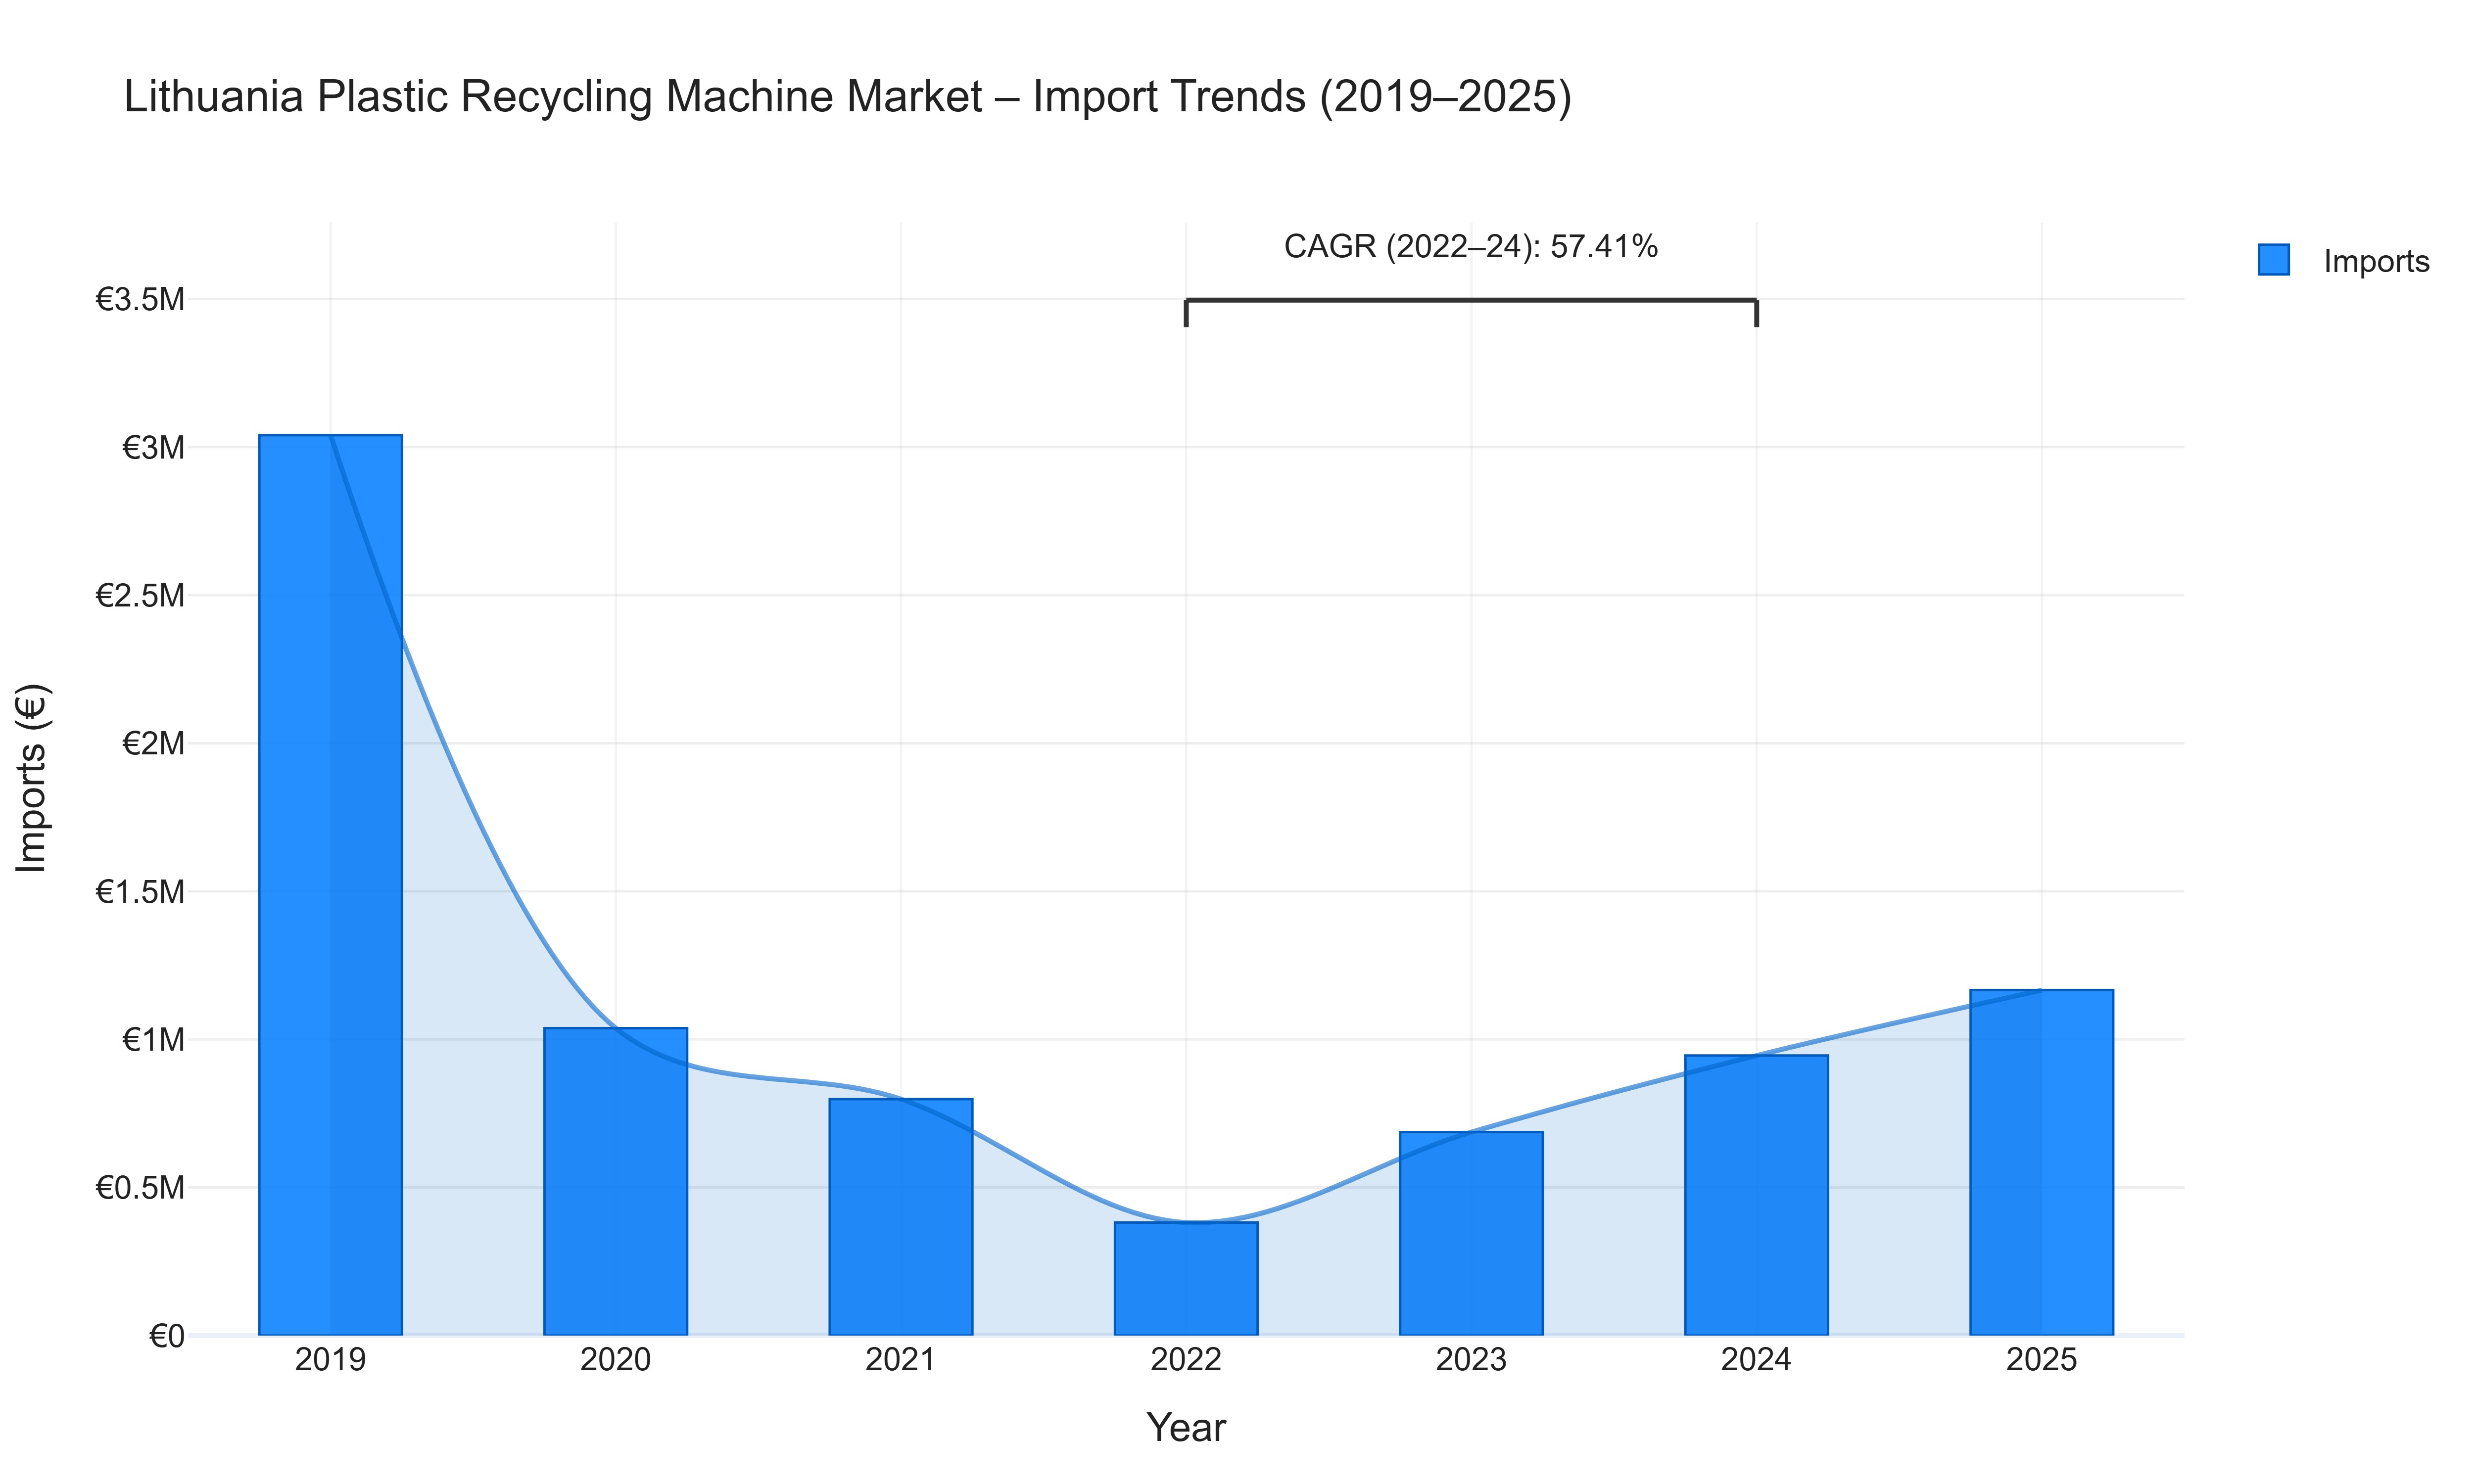
In the Lithuania Plastic Recycling Machine Market, import values experienced significant fluctuations over the years. Import values dropped sharply from €3.04 million in 2019 to €381.63 thousand in 2022, marking a notable decline. This downward trend was primarily driven by supply chain disruptions and reduced demand for plastic recycling machines during this period. However, a notable recovery was observed in 2023 and 2024, with import values increasing by 80.06% and 37.60%, respectively. The compound annual growth rate (CAGR) of 57.41% from 2022 to 2024 indicates a rapid growth phase within the overall import trend, showcasing a strong resurgence in demand for plastic recycling machines during these years. The peak import activity was witnessed in 2019, followed by a gradual recovery in subsequent years, reflecting the market's resilience and adaptability to changing dynamics.
Key Highlights of the Report:
- Lithuania Plastic Recycling Machine Market Outlook
- Market Size of Lithuania Plastic Recycling Machine Market, 2025
- Forecast of Lithuania Plastic Recycling Machine Market, 2032
- Historical Data and Forecast of Lithuania Plastic Recycling Machine Revenues & Volume for the Period 2022 - 2032
- Lithuania Plastic Recycling Machine Market Trend Evolution
- Lithuania Plastic Recycling Machine Market Drivers and Challenges
- Lithuania Plastic Recycling Machine Price Trends
- Lithuania Plastic Recycling Machine Porter's Five Forces
- Lithuania Plastic Recycling Machine Industry Life Cycle
- Historical Data and Forecast of Lithuania Plastic Recycling Machine Market Revenues & Volume By Type for the Period 2022 - 2032
- Historical Data and Forecast of Lithuania Plastic Recycling Machine Market Revenues & Volume By Combined Machines for the Period 2022 - 2032
- Historical Data and Forecast of Lithuania Plastic Recycling Machine Market Revenues & Volume By Shredders for the Period 2022 - 2032
- Historical Data and Forecast of Lithuania Plastic Recycling Machine Market Revenues & Volume By Extruders for the Period 2022 - 2032
- Historical Data and Forecast of Lithuania Plastic Recycling Machine Market Revenues & Volume By Grinders for the Period 2022 - 2032
- Historical Data and Forecast of Lithuania Plastic Recycling Machine Market Revenues & Volume By Mixers for the Period 2022 - 2032
- Historical Data and Forecast of Lithuania Plastic Recycling Machine Market Revenues & Volume By Sorters for the Period 2022 - 2032
- Historical Data and Forecast of Lithuania Plastic Recycling Machine Market Revenues & Volume By Washers for the Period 2022 - 2032
- Historical Data and Forecast of Lithuania Combined Machines Plastic Recycling Machine Market Revenues & Volume By Others (Densifier, Pelletizer, etc.) for the Period 2022 - 2032
- Historical Data and Forecast of Lithuania Plastic Recycling Machine Market Revenues & Volume By Category for the Period 2022 - 2032
- Historical Data and Forecast of Lithuania Plastic Recycling Machine Market Revenues & Volume By Single Stage Plastic Recycling Machines for the Period 2022 - 2032
- Historical Data and Forecast of Lithuania Plastic Recycling Machine Market Revenues & Volume By Two Stage Plastic Recycling Machines for the Period 2022 - 2032
- Historical Data and Forecast of Lithuania Plastic Recycling Machine Market Revenues & Volume By Multi Stage Plastic Recycling Machines for the Period 2022 - 2032
- Historical Data and Forecast of Lithuania Plastic Recycling Machine Market Revenues & Volume By Technology for the Period 2022 - 2032
- Historical Data and Forecast of Lithuania Plastic Recycling Machine Market Revenues & Volume By Automatic for the Period 2022 - 2032
- Historical Data and Forecast of Lithuania Plastic Recycling Machine Market Revenues & Volume By Semi-automatic for the Period 2022 - 2032
- Historical Data and Forecast of Lithuania Plastic Recycling Machine Market Revenues & Volume By Output for the Period 2022 - 2032
- Historical Data and Forecast of Lithuania Plastic Recycling Machine Market Revenues & Volume By Up to 100 kg/hr. for the Period 2022 - 2032
- Historical Data and Forecast of Lithuania Plastic Recycling Machine Market Revenues & Volume By >100 kg/hr. to 500 kg/hr. for the Period 2022 - 2032
- Historical Data and Forecast of Lithuania Plastic Recycling Machine Market Revenues & Volume By >500 kg/hr. to 1000 kg/hr. for the Period 2022 - 2032
- Historical Data and Forecast of Lithuania Plastic Recycling Machine Market Revenues & Volume By Above 1000 kg/hr. for the Period 2022 - 2032
- Historical Data and Forecast of Lithuania Plastic Recycling Machine Market Revenues & Volume By Application for the Period 2022 - 2032
- Historical Data and Forecast of Lithuania Plastic Recycling Machine Market Revenues & Volume By Post-industrial Recycling (PIR) for the Period 2022 - 2032
- Historical Data and Forecast of Lithuania Plastic Recycling Machine Market Revenues & Volume By Post-consumer Recycling (PCR) for the Period 2022 - 2032
- Historical Data and Forecast of Lithuania Plastic Recycling Machine Market Revenues & Volume By Improvement Applications for the Period 2022 - 2032
- Historical Data and Forecast of Lithuania Plastic Recycling Machine Market Revenues & Volume By Distribution Channel for the Period 2022 - 2032
- Historical Data and Forecast of Lithuania Plastic Recycling Machine Market Revenues & Volume By Direct Sales for the Period 2022 - 2032
- Historical Data and Forecast of Lithuania Plastic Recycling Machine Market Revenues & Volume By Indirect Sales for the Period 2022 - 2032
- Lithuania Plastic Recycling Machine Import Export Trade Statistics
- Market Opportunity Assessment By Type
- Market Opportunity Assessment By Category
- Market Opportunity Assessment By Technology
- Market Opportunity Assessment By Output
- Market Opportunity Assessment By Application
- Market Opportunity Assessment By Distribution Channel
- Lithuania Plastic Recycling Machine Top Companies Market Share
- Lithuania Plastic Recycling Machine Competitive Benchmarking By Technical and Operational Parameters
- Lithuania Plastic Recycling Machine Company Profiles
- Lithuania Plastic Recycling Machine Key Strategic Recommendations
Frequently Asked Questions About the Market Study (FAQs):
6Wresearch actively monitors the Lithuania Plastic Recycling Machine Market and publishes its comprehensive annual report, highlighting emerging trends, growth drivers, revenue analysis, and forecast outlook. Our insights help businesses to make data-backed strategic decisions with ongoing market dynamics. Our analysts track relevent industries related to the Lithuania Plastic Recycling Machine Market, allowing our clients with actionable intelligence and reliable forecasts tailored to emerging regional needs.
Yes, we provide customisation as per your requirements. To learn more, feel free to contact us on sales@6wresearch.com
1 Executive Summary |
2 Introduction |
2.1 Key Highlights of the Report |
2.2 Report Description |
2.3 Market Scope & Segmentation |
2.4 Research Methodology |
2.5 Assumptions |
3 Lithuania Plastic Recycling Machine Market Overview |
3.1 Lithuania Country Macro Economic Indicators |
3.2 Lithuania Plastic Recycling Machine Market Revenues & Volume, 2022 & 2032F |
3.3 Lithuania Plastic Recycling Machine Market - Industry Life Cycle |
3.4 Lithuania Plastic Recycling Machine Market - Porter's Five Forces |
3.5 Lithuania Plastic Recycling Machine Market Revenues & Volume Share, By Type, 2022 & 2032F |
3.6 Lithuania Plastic Recycling Machine Market Revenues & Volume Share, By Category, 2022 & 2032F |
3.7 Lithuania Plastic Recycling Machine Market Revenues & Volume Share, By Technology, 2022 & 2032F |
3.8 Lithuania Plastic Recycling Machine Market Revenues & Volume Share, By Output, 2022 & 2032F |
3.9 Lithuania Plastic Recycling Machine Market Revenues & Volume Share, By Application, 2022 & 2032F |
3.10 Lithuania Plastic Recycling Machine Market Revenues & Volume Share, By Distribution Channel, 2022 & 2032F |
4 Lithuania Plastic Recycling Machine Market Dynamics |
4.1 Impact Analysis |
4.2 Market Drivers |
4.2.1 Increasing environmental awareness and regulations promoting plastic recycling in Lithuania. |
4.2.2 Growing emphasis on sustainable practices and circular economy initiatives. |
4.2.3 Technological advancements in plastic recycling machines leading to improved efficiency and output. |
4.3 Market Restraints |
4.3.1 High initial investment costs for setting up plastic recycling facilities. |
4.3.2 Lack of proper infrastructure for collection and sorting of plastic waste in Lithuania. |
4.3.3 Limited awareness and adoption of plastic recycling practices among businesses and consumers. |
5 Lithuania Plastic Recycling Machine Market Trends |
6 Lithuania Plastic Recycling Machine Market, By Types |
6.1 Lithuania Plastic Recycling Machine Market, By Type |
6.1.1 Overview and Analysis |
6.1.2 Lithuania Plastic Recycling Machine Market Revenues & Volume, By Type, 2022 - 2032F |
6.1.3 Lithuania Plastic Recycling Machine Market Revenues & Volume, By Combined Machines, 2022 - 2032F |
6.1.4 Lithuania Plastic Recycling Machine Market Revenues & Volume, By Shredders, 2022 - 2032F |
6.1.5 Lithuania Plastic Recycling Machine Market Revenues & Volume, By Extruders, 2022 - 2032F |
6.1.6 Lithuania Plastic Recycling Machine Market Revenues & Volume, By Grinders, 2022 - 2032F |
6.1.7 Lithuania Plastic Recycling Machine Market Revenues & Volume, By Mixers, 2022 - 2032F |
6.1.8 Lithuania Plastic Recycling Machine Market Revenues & Volume, By Sorters, 2022 - 2032F |
6.1.9 Lithuania Plastic Recycling Machine Market Revenues & Volume, By Others (Densifier, Pelletizer, etc.), 2022 - 2032F |
6.1.10 Lithuania Plastic Recycling Machine Market Revenues & Volume, By Others (Densifier, Pelletizer, etc.), 2022 - 2032F |
6.2 Lithuania Plastic Recycling Machine Market, By Category |
6.2.1 Overview and Analysis |
6.2.2 Lithuania Plastic Recycling Machine Market Revenues & Volume, By Single Stage Plastic Recycling Machines, 2022 - 2032F |
6.2.3 Lithuania Plastic Recycling Machine Market Revenues & Volume, By Two Stage Plastic Recycling Machines, 2022 - 2032F |
6.2.4 Lithuania Plastic Recycling Machine Market Revenues & Volume, By Multi Stage Plastic Recycling Machines, 2022 - 2032F |
6.3 Lithuania Plastic Recycling Machine Market, By Technology |
6.3.1 Overview and Analysis |
6.3.2 Lithuania Plastic Recycling Machine Market Revenues & Volume, By Automatic, 2022 - 2032F |
6.3.3 Lithuania Plastic Recycling Machine Market Revenues & Volume, By Semi-automatic, 2022 - 2032F |
6.4 Lithuania Plastic Recycling Machine Market, By Output |
6.4.1 Overview and Analysis |
6.4.2 Lithuania Plastic Recycling Machine Market Revenues & Volume, By Up to 100 kg/hr., 2022 - 2032F |
6.4.3 Lithuania Plastic Recycling Machine Market Revenues & Volume, By >100 kg/hr. to 500 kg/hr., 2022 - 2032F |
6.4.4 Lithuania Plastic Recycling Machine Market Revenues & Volume, By >500 kg/hr. to 1000 kg/hr., 2022 - 2032F |
6.4.5 Lithuania Plastic Recycling Machine Market Revenues & Volume, By Above 1000 kg/hr., 2022 - 2032F |
6.5 Lithuania Plastic Recycling Machine Market, By Application |
6.5.1 Overview and Analysis |
6.5.2 Lithuania Plastic Recycling Machine Market Revenues & Volume, By Post-industrial Recycling (PIR), 2022 - 2032F |
6.5.3 Lithuania Plastic Recycling Machine Market Revenues & Volume, By Post-consumer Recycling (PCR), 2022 - 2032F |
6.5.4 Lithuania Plastic Recycling Machine Market Revenues & Volume, By Improvement Applications, 2022 - 2032F |
6.6 Lithuania Plastic Recycling Machine Market, By Distribution Channel |
6.6.1 Overview and Analysis |
6.6.2 Lithuania Plastic Recycling Machine Market Revenues & Volume, By Direct Sales, 2022 - 2032F |
6.6.3 Lithuania Plastic Recycling Machine Market Revenues & Volume, By Indirect Sales, 2022 - 2032F |
7 Lithuania Plastic Recycling Machine Market Import-Export Trade Statistics |
7.1 Lithuania Plastic Recycling Machine Market Export to Major Countries |
7.2 Lithuania Plastic Recycling Machine Market Imports from Major Countries |
8 Lithuania Plastic Recycling Machine Market Key Performance Indicators |
8.1 Percentage increase in the volume of plastic waste collected for recycling. |
8.2 Percentage reduction in the carbon footprint associated with plastic recycling processes. |
8.3 Efficiency improvement metrics such as energy consumption per unit of plastic recycled. |
8.4 Percentage increase in the adoption of recycled plastics in manufacturing processes. |
8.5 Number of partnerships or collaborations with government bodies and industry stakeholders to promote plastic recycling initiatives. |
9 Lithuania Plastic Recycling Machine Market - Opportunity Assessment |
9.1 Lithuania Plastic Recycling Machine Market Opportunity Assessment, By Type, 2022 & 2032F |
9.2 Lithuania Plastic Recycling Machine Market Opportunity Assessment, By Category, 2022 & 2032F |
9.3 Lithuania Plastic Recycling Machine Market Opportunity Assessment, By Technology, 2022 & 2032F |
9.4 Lithuania Plastic Recycling Machine Market Opportunity Assessment, By Output, 2022 & 2032F |
9.5 Lithuania Plastic Recycling Machine Market Opportunity Assessment, By Application, 2022 & 2032F |
9.6 Lithuania Plastic Recycling Machine Market Opportunity Assessment, By Distribution Channel, 2022 & 2032F |
10 Lithuania Plastic Recycling Machine Market - Competitive Landscape |
10.1 Lithuania Plastic Recycling Machine Market Revenue Share, By Companies, 2025 |
10.2 Lithuania Plastic Recycling Machine Market Competitive Benchmarking, By Operating and Technical Parameters |
11 Company Profiles |
12 Recommendations |
13 Disclaimer |
Global Go To Market Strategy - 2030
Export potential enables firms to identify high-growth global markets with greater confidence by combining advanced trade intelligence with a structured quantitative methodology. The framework analyzes emerging demand trends and country-level import patterns while integrating macroeconomic and trade datasets such as GDP and population forecasts, bilateral import–export flows, tariff structures, elasticity differentials between developed and developing economies, geographic distance, and import demand projections. Using weighted trade values from 2020–2024 as the base period to project country-to-country export potential for 2030, these inputs are operationalized through calculated drivers such as gravity model parameters, tariff impact factors, and projected GDP per-capita growth. Through an analysis of hidden potentials, demand hotspots, and market conditions that are most favorable to success, this method enables firms to focus on target countries, maximize returns, and global expansion with data, backed by accuracy.
By factoring in the projected importer demand gap that is currently unmet and could be potential opportunity, it identifies the potential for the Exporter (Country) among 190 countries, against the general trade analysis, which identifies the biggest importer or exporter.
To discover high-growth global markets and optimize your business strategy:
Click Here
Pricing
- Single User License$ 1,995
- Department License$ 2,400
- Site License$ 3,120
- Global License$ 3,795

Leadership Perspectives from Industry Events
Search
Thought Leadership and Analyst Meet


Our Clients
6WResearch In News
- India Export Attractiveness Tracker 2026
- India Air Conditioner Market Set for Strong Rebound in 2026 After Weather-Led Correction and GST-Driven Recovery: 6Wresearch
- ADAS in India: How Automatic Emergency Braking, Blind Spot Detection & Driver Monitoring are Transforming Road Safety
- Doha a strategic location for EV manufacturing hub: IPA Qatar
- Demand for luxury TVs surging in the GCC, says Samsung
- Empowering Growth: The Thriving Journey of Bangladesh’s Cable Industry
Latest Reports
- Nicaragua RPG Gaming Market (2026-2032)
- New Zealand RPG Gaming Market (2026-2032)
- Netherlands RPG Gaming Market (2026-2032)
- Nauru RPG Gaming Market (2026-2032)
- Namibia RPG Gaming Market (2026-2032)
- Mozambique RPG Gaming Market (2026-2032)
- Montenegro RPG Gaming Market (2026-2032)
- Mongolia RPG Gaming Market (2026-2032)
- Monaco RPG Gaming Market (2026-2032)
- Micronesia RPG Gaming Market (2026-2032)
Industry Events and Analyst Meet

EV India Expo 2026

HIMTEX 2026

India Refining Summit 2026

India EV Show 2026

EV tech India Expo 2026
Whitepaper
- Middle East & Africa Commercial Security Market Click here to view more.
- Middle East & Africa Fire Safety Systems & Equipment Market Click here to view more.
- GCC Drone Market Click here to view more.
- Middle East Lighting Fixture Market Click here to view more.
- GCC Physical & Perimeter Security Market Click here to view more.