Lithuania Vermouth Market (2026-2032) | Size & Revenue, Growth, Trends, Value, Industry, Segmentation, Competitive Landscape, Forecast, Analysis, Share, Companies, Outlook
Market Forecast By Type (Supermarkets and Hypermarkets, Specialist Retailers, Convenience Stores, Online), By Application (Sweet Vermouth, Dry Vermouth, Bianco Vermouth) And Competitive Landscape
| Product Code: ETC8053839 | Publication Date: Sep 2024 | Updated Date: Apr 2026 | Product Type: Market Research Report | |
| Publisher: 6Wresearch | Author: Sumit Sagar | No. of Pages: 75 | No. of Figures: 35 | No. of Tables: 20 |
Lithuania Vermouth Market Size (2020-2030)
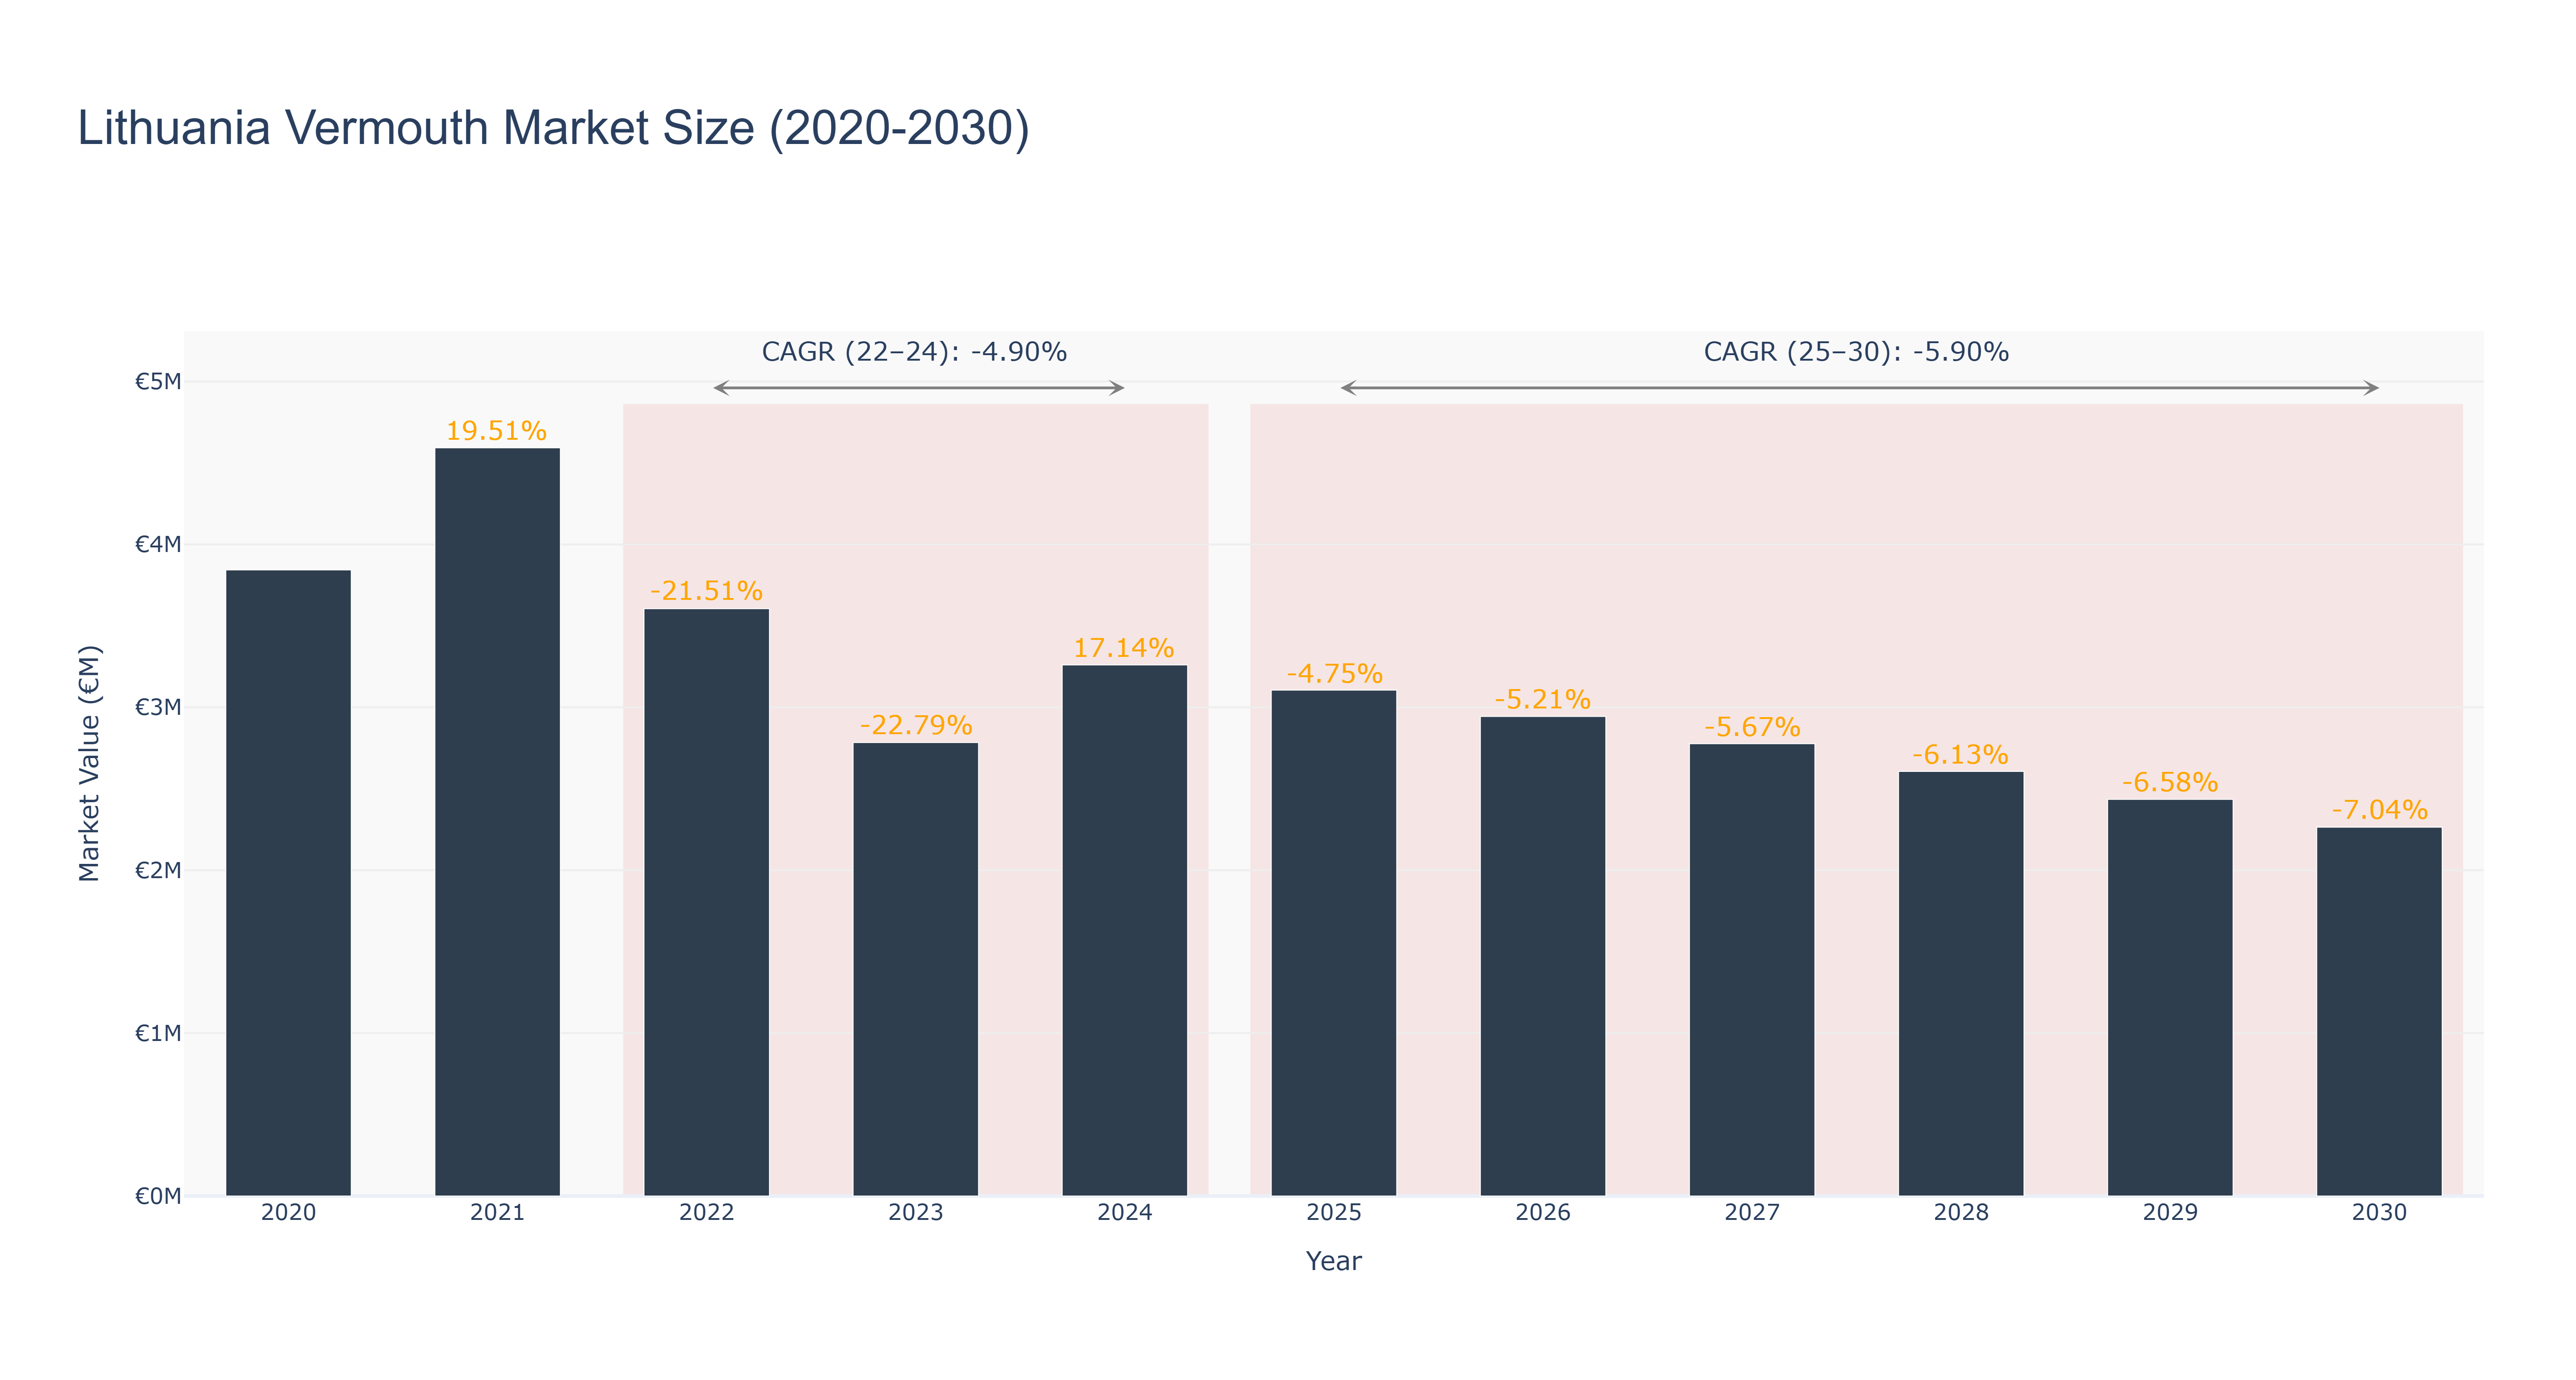
The Lithuania Vermouth Market experienced a peak market size of €4.59 million in 2021, followed by a decline to €2.78 million in 2023. The market is forecasted to continue shrinking, reaching €2.26 million in 2030. The CAGR for the period 2022-24 is -4.90%, while for 2025-30, it is projected at -5.90%. The market trend reflects a consistent downward trajectory, attributed to changing consumer preferences, economic uncertainties, and increased competition. Despite these challenges, recent developments in sustainable packaging and marketing strategies aim to revitalize the market in the coming years. Industry drivers such as health consciousness and premiumization are expected to shape future growth opportunities for the Lithuania Vermouth Market.
Lithuania Vermouth Market: Production & Trade Performance (2019-2025)
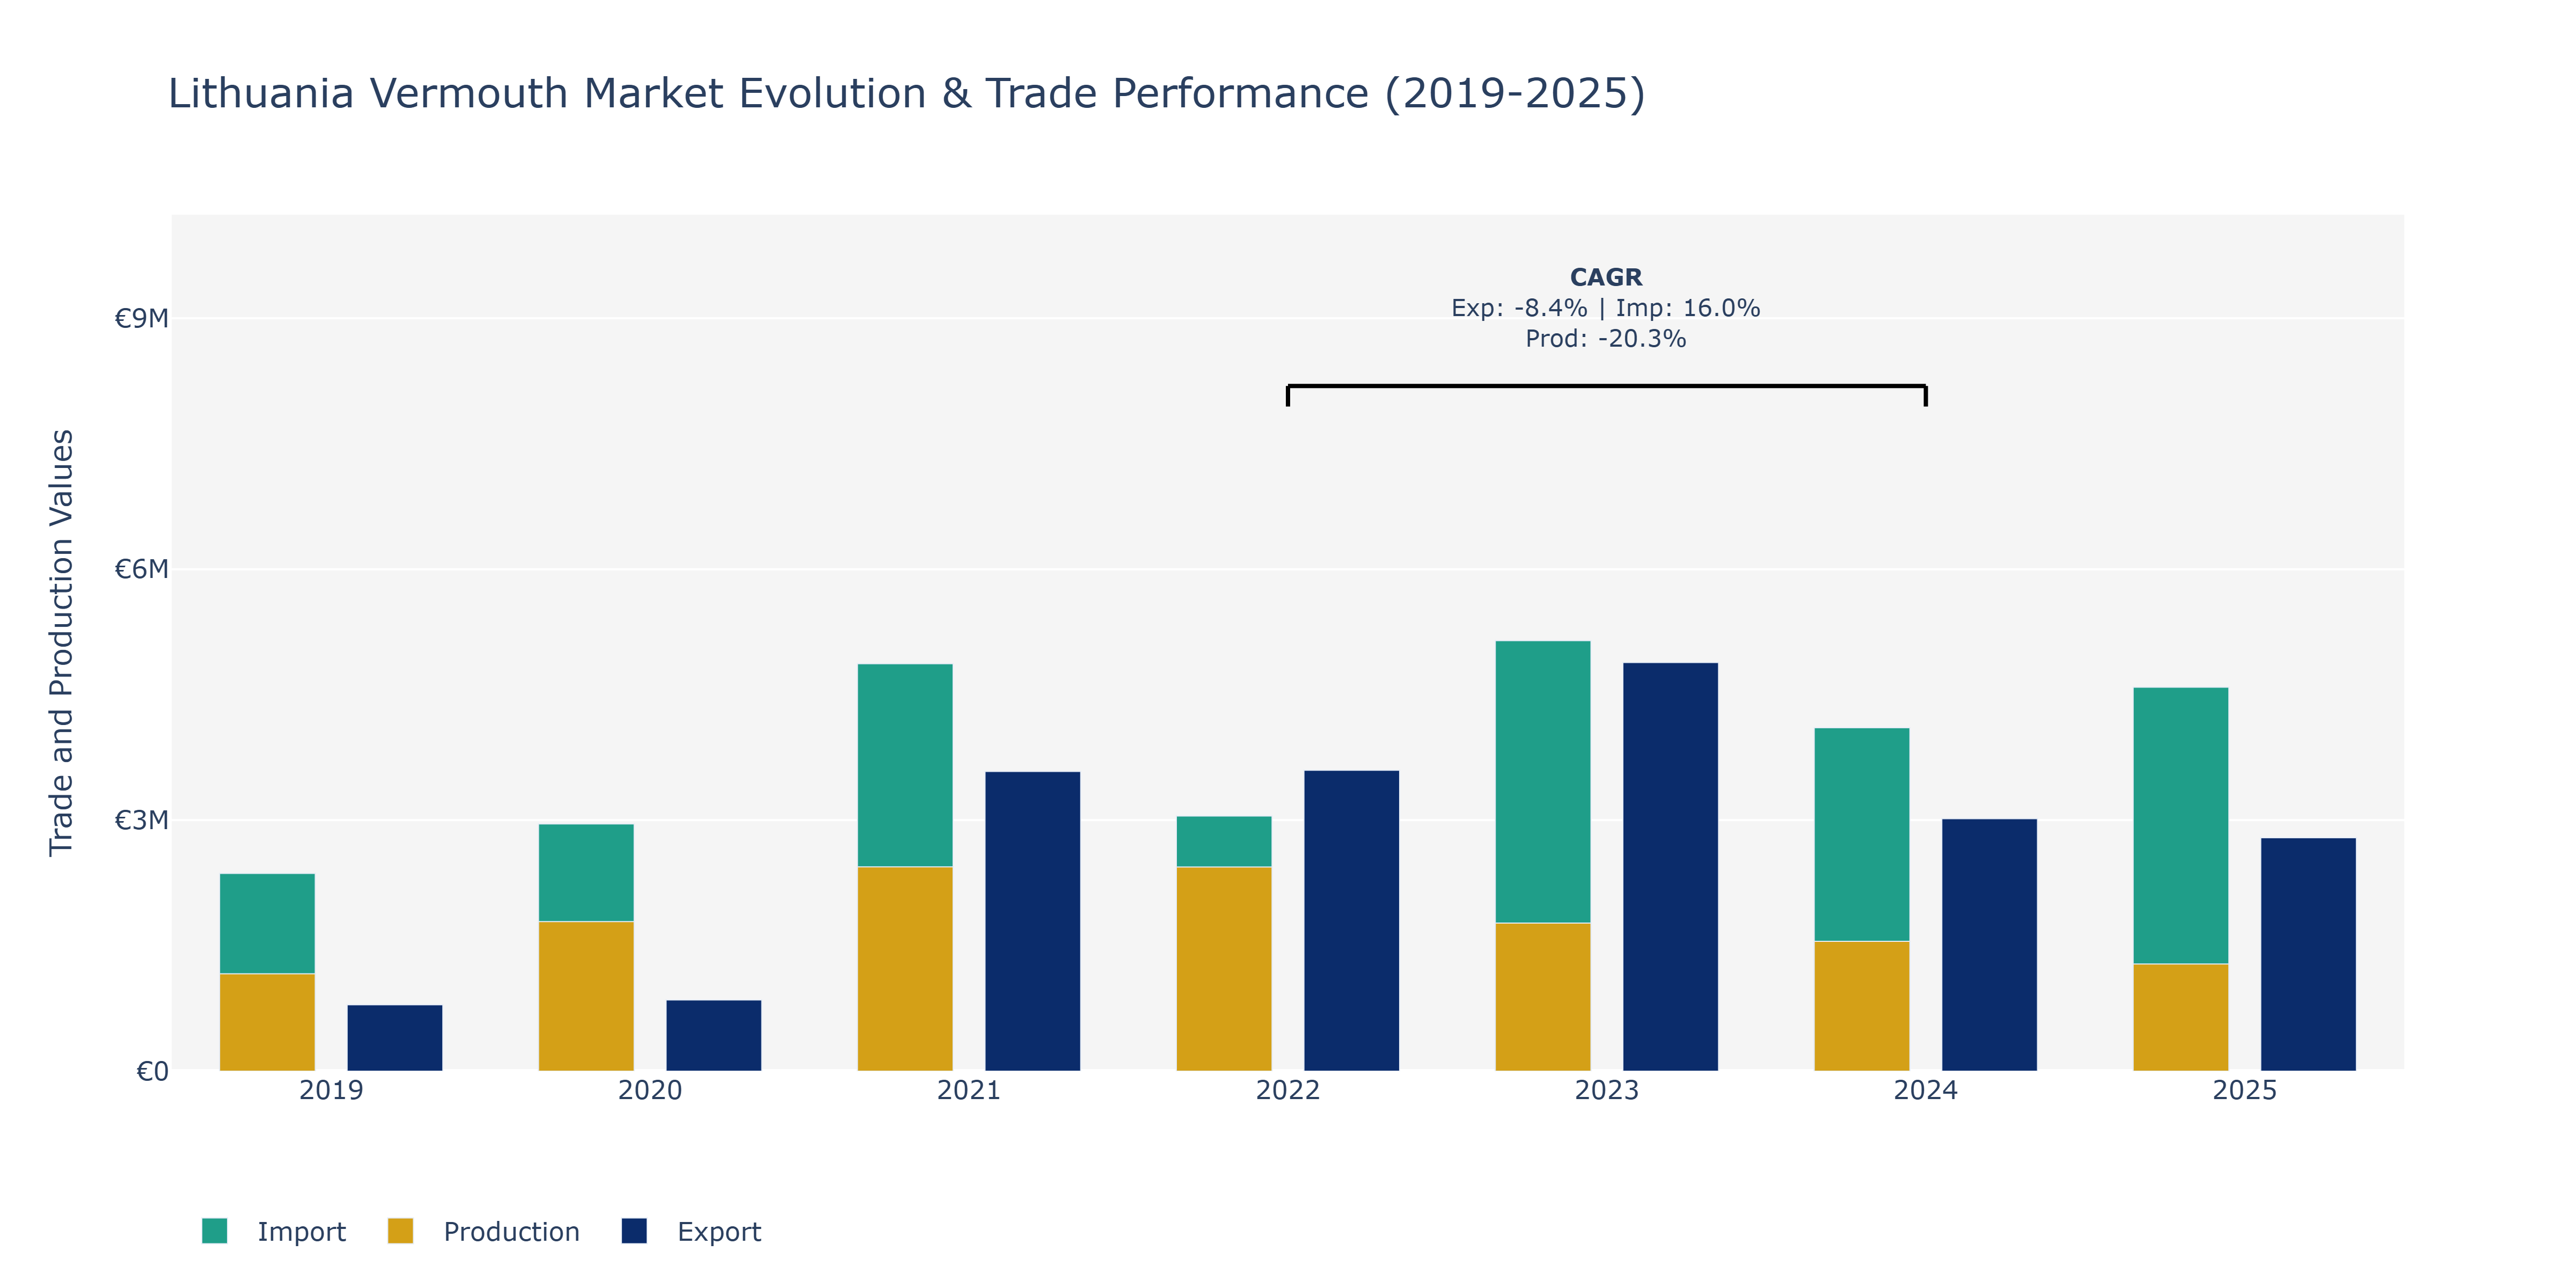
Between 2019 and 2025, Lithuania's Vermouth market saw notable fluctuations in Exports, Imports, and Production. Exports experienced a peak in 2021 at approximately €3.6 million but then decreased in the following years, reaching around €2.8 million in 2025. Imports displayed a consistent upward trend, growing from around €2.4 million in 2019 to approximately €4.6 million in 2025. Production, on the other hand, peaked in 2020 at about €1.8 million before declining to around €1.3 million in 2025. The decrease in Exports post-2021 could be attributed to changing consumer preferences, competitive pressures, or economic conditions impacting export markets. The steady rise in Imports may indicate a growing demand for vermouth in Lithuania, potentially driven by increasing disposable incomes or the rising popularity of vermouth-based cocktails in the country, aligning with global trends towards premiumization in the alcoholic beverage industry. The decline in Production could be due to various factors such as supply chain disruptions, regulatory changes, or shifts in production focus towards other product lines within the beverage industry. To sustain and grow the Vermouth market in Lithuania, stakeholders may need to adapt to evolving consumer tastes, explore new export markets, and invest in production efficiency and innovation to enhance competitiveness in the global market.
Key Highlights of the Report:
- Lithuania Vermouth Market Outlook
- Market Size of Lithuania Vermouth Market, 2025
- Forecast of Lithuania Vermouth Market, 2032
- Historical Data and Forecast of Lithuania Vermouth Revenues & Volume for the Period 2022 - 2032
- Lithuania Vermouth Market Trend Evolution
- Lithuania Vermouth Market Drivers and Challenges
- Lithuania Vermouth Price Trends
- Lithuania Vermouth Porter's Five Forces
- Lithuania Vermouth Industry Life Cycle
- Historical Data and Forecast of Lithuania Vermouth Market Revenues & Volume By Type for the Period 2022 - 2032
- Historical Data and Forecast of Lithuania Vermouth Market Revenues & Volume By Supermarkets and Hypermarkets for the Period 2022 - 2032
- Historical Data and Forecast of Lithuania Vermouth Market Revenues & Volume By Specialist Retailers for the Period 2022 - 2032
- Historical Data and Forecast of Lithuania Vermouth Market Revenues & Volume By Convenience Stores for the Period 2022 - 2032
- Historical Data and Forecast of Lithuania Vermouth Market Revenues & Volume By Online for the Period 2022 - 2032
- Historical Data and Forecast of Lithuania Vermouth Market Revenues & Volume By Application for the Period 2022 - 2032
- Historical Data and Forecast of Lithuania Vermouth Market Revenues & Volume By Sweet Vermouth for the Period 2022 - 2032
- Historical Data and Forecast of Lithuania Vermouth Market Revenues & Volume By Dry Vermouth for the Period 2022 - 2032
- Historical Data and Forecast of Lithuania Vermouth Market Revenues & Volume By Bianco Vermouth for the Period 2022 - 2032
- Lithuania Vermouth Import Export Trade Statistics
- Market Opportunity Assessment By Type
- Market Opportunity Assessment By Application
- Lithuania Vermouth Top Companies Market Share
- Lithuania Vermouth Competitive Benchmarking By Technical and Operational Parameters
- Lithuania Vermouth Company Profiles
- Lithuania Vermouth Key Strategic Recommendations
Frequently Asked Questions About the Market Study (FAQs):
6Wresearch actively monitors the Lithuania Vermouth Market and publishes its comprehensive annual report, highlighting emerging trends, growth drivers, revenue analysis, and forecast outlook. Our insights help businesses to make data-backed strategic decisions with ongoing market dynamics. Our analysts track relevent industries related to the Lithuania Vermouth Market, allowing our clients with actionable intelligence and reliable forecasts tailored to emerging regional needs.
Yes, we provide customisation as per your requirements. To learn more, feel free to contact us on sales@6wresearch.com
1 Executive Summary |
2 Introduction |
2.1 Key Highlights of the Report |
2.2 Report Description |
2.3 Market Scope & Segmentation |
2.4 Research Methodology |
2.5 Assumptions |
3 Lithuania Vermouth Market Overview |
3.1 Lithuania Country Macro Economic Indicators |
3.2 Lithuania Vermouth Market Revenues & Volume, 2022 & 2032F |
3.3 Lithuania Vermouth Market - Industry Life Cycle |
3.4 Lithuania Vermouth Market - Porter's Five Forces |
3.5 Lithuania Vermouth Market Revenues & Volume Share, By Type, 2022 & 2032F |
3.6 Lithuania Vermouth Market Revenues & Volume Share, By Application, 2022 & 2032F |
4 Lithuania Vermouth Market Dynamics |
4.1 Impact Analysis |
4.2 Market Drivers |
4.2.1 Increasing consumer interest in craft and artisanal beverages |
4.2.2 Growing popularity of cocktail culture in Lithuania |
4.2.3 Rising disposable income leading to higher spending on premium alcoholic beverages |
4.3 Market Restraints |
4.3.1 Stringent regulations and taxes on alcohol production and sales |
4.3.2 Competition from other alcoholic beverages like wine and beer in the market |
5 Lithuania Vermouth Market Trends |
6 Lithuania Vermouth Market, By Types |
6.1 Lithuania Vermouth Market, By Type |
6.1.1 Overview and Analysis |
6.1.2 Lithuania Vermouth Market Revenues & Volume, By Type, 2022 - 2032F |
6.1.3 Lithuania Vermouth Market Revenues & Volume, By Supermarkets and Hypermarkets, 2022 - 2032F |
6.1.4 Lithuania Vermouth Market Revenues & Volume, By Specialist Retailers, 2022 - 2032F |
6.1.5 Lithuania Vermouth Market Revenues & Volume, By Convenience Stores, 2022 - 2032F |
6.1.6 Lithuania Vermouth Market Revenues & Volume, By Online, 2022 - 2032F |
6.2 Lithuania Vermouth Market, By Application |
6.2.1 Overview and Analysis |
6.2.2 Lithuania Vermouth Market Revenues & Volume, By Sweet Vermouth, 2022 - 2032F |
6.2.3 Lithuania Vermouth Market Revenues & Volume, By Dry Vermouth, 2022 - 2032F |
6.2.4 Lithuania Vermouth Market Revenues & Volume, By Bianco Vermouth, 2022 - 2032F |
7 Lithuania Vermouth Market Import-Export Trade Statistics |
7.1 Lithuania Vermouth Market Export to Major Countries |
7.2 Lithuania Vermouth Market Imports from Major Countries |
8 Lithuania Vermouth Market Key Performance Indicators |
8.1 Number of new vermouth product launches in the market |
8.2 Consumer engagement and interaction on social media platforms for vermouth brands |
8.3 Growth in the number of bars and restaurants offering vermouth cocktails |
8.4 Percentage increase in vermouth exports from Lithuania |
8.5 Participation and recognition in international spirits competitions |
9 Lithuania Vermouth Market - Opportunity Assessment |
9.1 Lithuania Vermouth Market Opportunity Assessment, By Type, 2022 & 2032F |
9.2 Lithuania Vermouth Market Opportunity Assessment, By Application, 2022 & 2032F |
10 Lithuania Vermouth Market - Competitive Landscape |
10.1 Lithuania Vermouth Market Revenue Share, By Companies, 2025 |
10.2 Lithuania Vermouth Market Competitive Benchmarking, By Operating and Technical Parameters |
11 Company Profiles |
12 Recommendations |
13 Disclaimer |
Global Go To Market Strategy - 2030
Export potential enables firms to identify high-growth global markets with greater confidence by combining advanced trade intelligence with a structured quantitative methodology. The framework analyzes emerging demand trends and country-level import patterns while integrating macroeconomic and trade datasets such as GDP and population forecasts, bilateral import–export flows, tariff structures, elasticity differentials between developed and developing economies, geographic distance, and import demand projections. Using weighted trade values from 2020–2024 as the base period to project country-to-country export potential for 2030, these inputs are operationalized through calculated drivers such as gravity model parameters, tariff impact factors, and projected GDP per-capita growth. Through an analysis of hidden potentials, demand hotspots, and market conditions that are most favorable to success, this method enables firms to focus on target countries, maximize returns, and global expansion with data, backed by accuracy.
By factoring in the projected importer demand gap that is currently unmet and could be potential opportunity, it identifies the potential for the Exporter (Country) among 190 countries, against the general trade analysis, which identifies the biggest importer or exporter.
To discover high-growth global markets and optimize your business strategy:
Click Here
Pricing
- Single User License$ 1,995
- Department License$ 2,400
- Site License$ 3,120
- Global License$ 3,795

Leadership Perspectives from Industry Events
Search
Thought Leadership and Analyst Meet


Our Clients
6WResearch In News
- India Export Attractiveness Tracker 2026
- India Air Conditioner Market Set for Strong Rebound in 2026 After Weather-Led Correction and GST-Driven Recovery: 6Wresearch
- ADAS in India: How Automatic Emergency Braking, Blind Spot Detection & Driver Monitoring are Transforming Road Safety
- Doha a strategic location for EV manufacturing hub: IPA Qatar
- Demand for luxury TVs surging in the GCC, says Samsung
- Empowering Growth: The Thriving Journey of Bangladesh’s Cable Industry
Latest Reports
- Nicaragua RPG Gaming Market (2026-2032)
- New Zealand RPG Gaming Market (2026-2032)
- Netherlands RPG Gaming Market (2026-2032)
- Nauru RPG Gaming Market (2026-2032)
- Namibia RPG Gaming Market (2026-2032)
- Mozambique RPG Gaming Market (2026-2032)
- Montenegro RPG Gaming Market (2026-2032)
- Mongolia RPG Gaming Market (2026-2032)
- Monaco RPG Gaming Market (2026-2032)
- Micronesia RPG Gaming Market (2026-2032)
Industry Events and Analyst Meet

EV India Expo 2026

HIMTEX 2026

India Refining Summit 2026

India EV Show 2026

EV tech India Expo 2026
Whitepaper
- Middle East & Africa Commercial Security Market Click here to view more.
- Middle East & Africa Fire Safety Systems & Equipment Market Click here to view more.
- GCC Drone Market Click here to view more.
- Middle East Lighting Fixture Market Click here to view more.
- GCC Physical & Perimeter Security Market Click here to view more.