Lithuania Wood Charcoal Market (2026-2032) | Growth, Share, Value, Companies, Outlook, Industry, Revenue, Analysis, Segmentation, Trends, Forecast & Size
Market Forecast By Product (Charcoal Lumps, Charcoal Briquettes, Charcoal Powder), By Wood (Softwood, Hardwood), By Application (Fuel Feedstock, Reducing Agent, Filtration Agent & Gas Masking, Decolorizing Agent, Gastric Medicine, Sketches & Paints, Soil Conditioning, Others), By End Use (Residential, Cooking Fuel, Gardening, Commercial Paints & Sketches, Water Treatment, Industrial) And Competitive Landscape
| Product Code: ETC5333093 | Publication Date: Nov 2023 | Updated Date: Apr 2026 | Product Type: Market Research Report | |
| Publisher: 6Wresearch | Author: Ravi Bhandari | No. of Pages: 60 | No. of Figures: 30 | No. of Tables: 5 |
Lithuania Wood Charcoal Market Size (2020-2030)
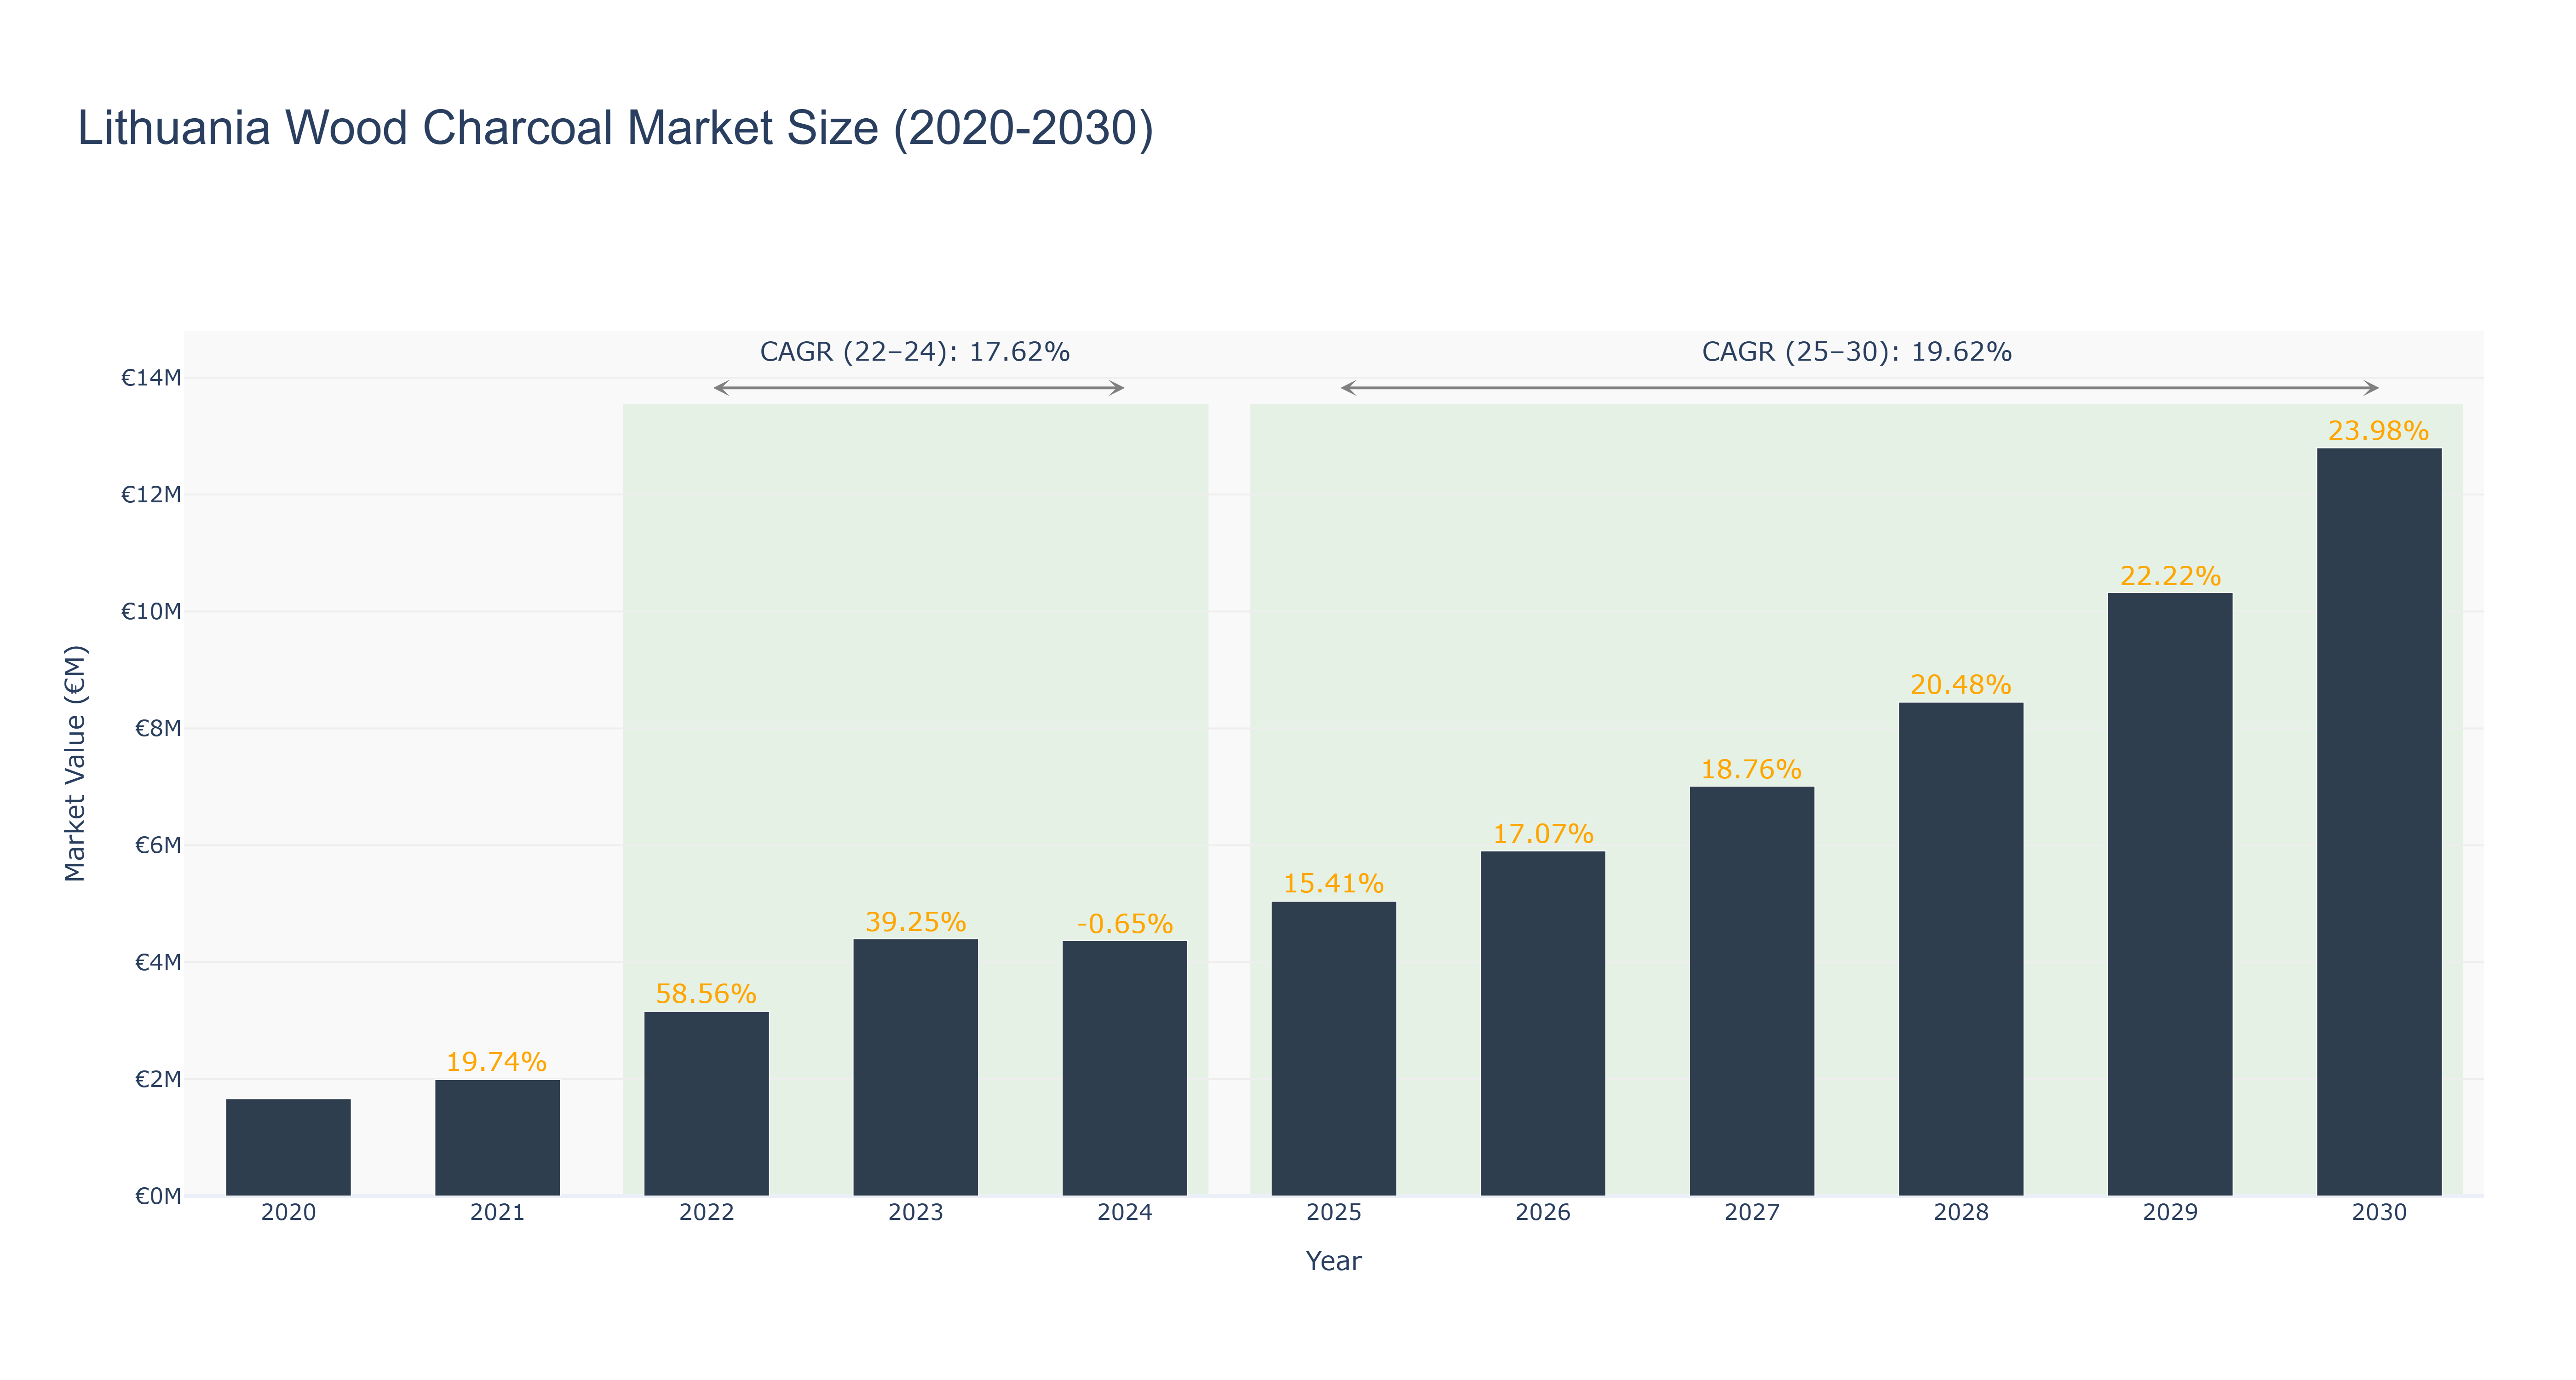
The Lithuania Wood Charcoal Market has shown a steady growth trajectory over the past decade. The peak market size of €12.80 million is forecasted for 2030, with a notable increase in market size from €1.66 million in 2020 to €4.40 million in 2023. The market experienced a slight decline in 2024, followed by consistent growth through 2029. The CAGR for the period 2022-24 was 17.62%, while the CAGR for 2025-30 is projected at 19.62%. This growth can be attributed to increasing consumer demand for eco-friendly fuel alternatives and the rising popularity of grilling and outdoor cooking activities. Moving forward, Lithuania is investing in sustainable forestry practices to ensure a stable supply of wood charcoal for the market, promoting environmental conservation and economic growth simultaneously.
Lithuania Wood Charcoal Market: Production & Trade Performance (2019-2025)
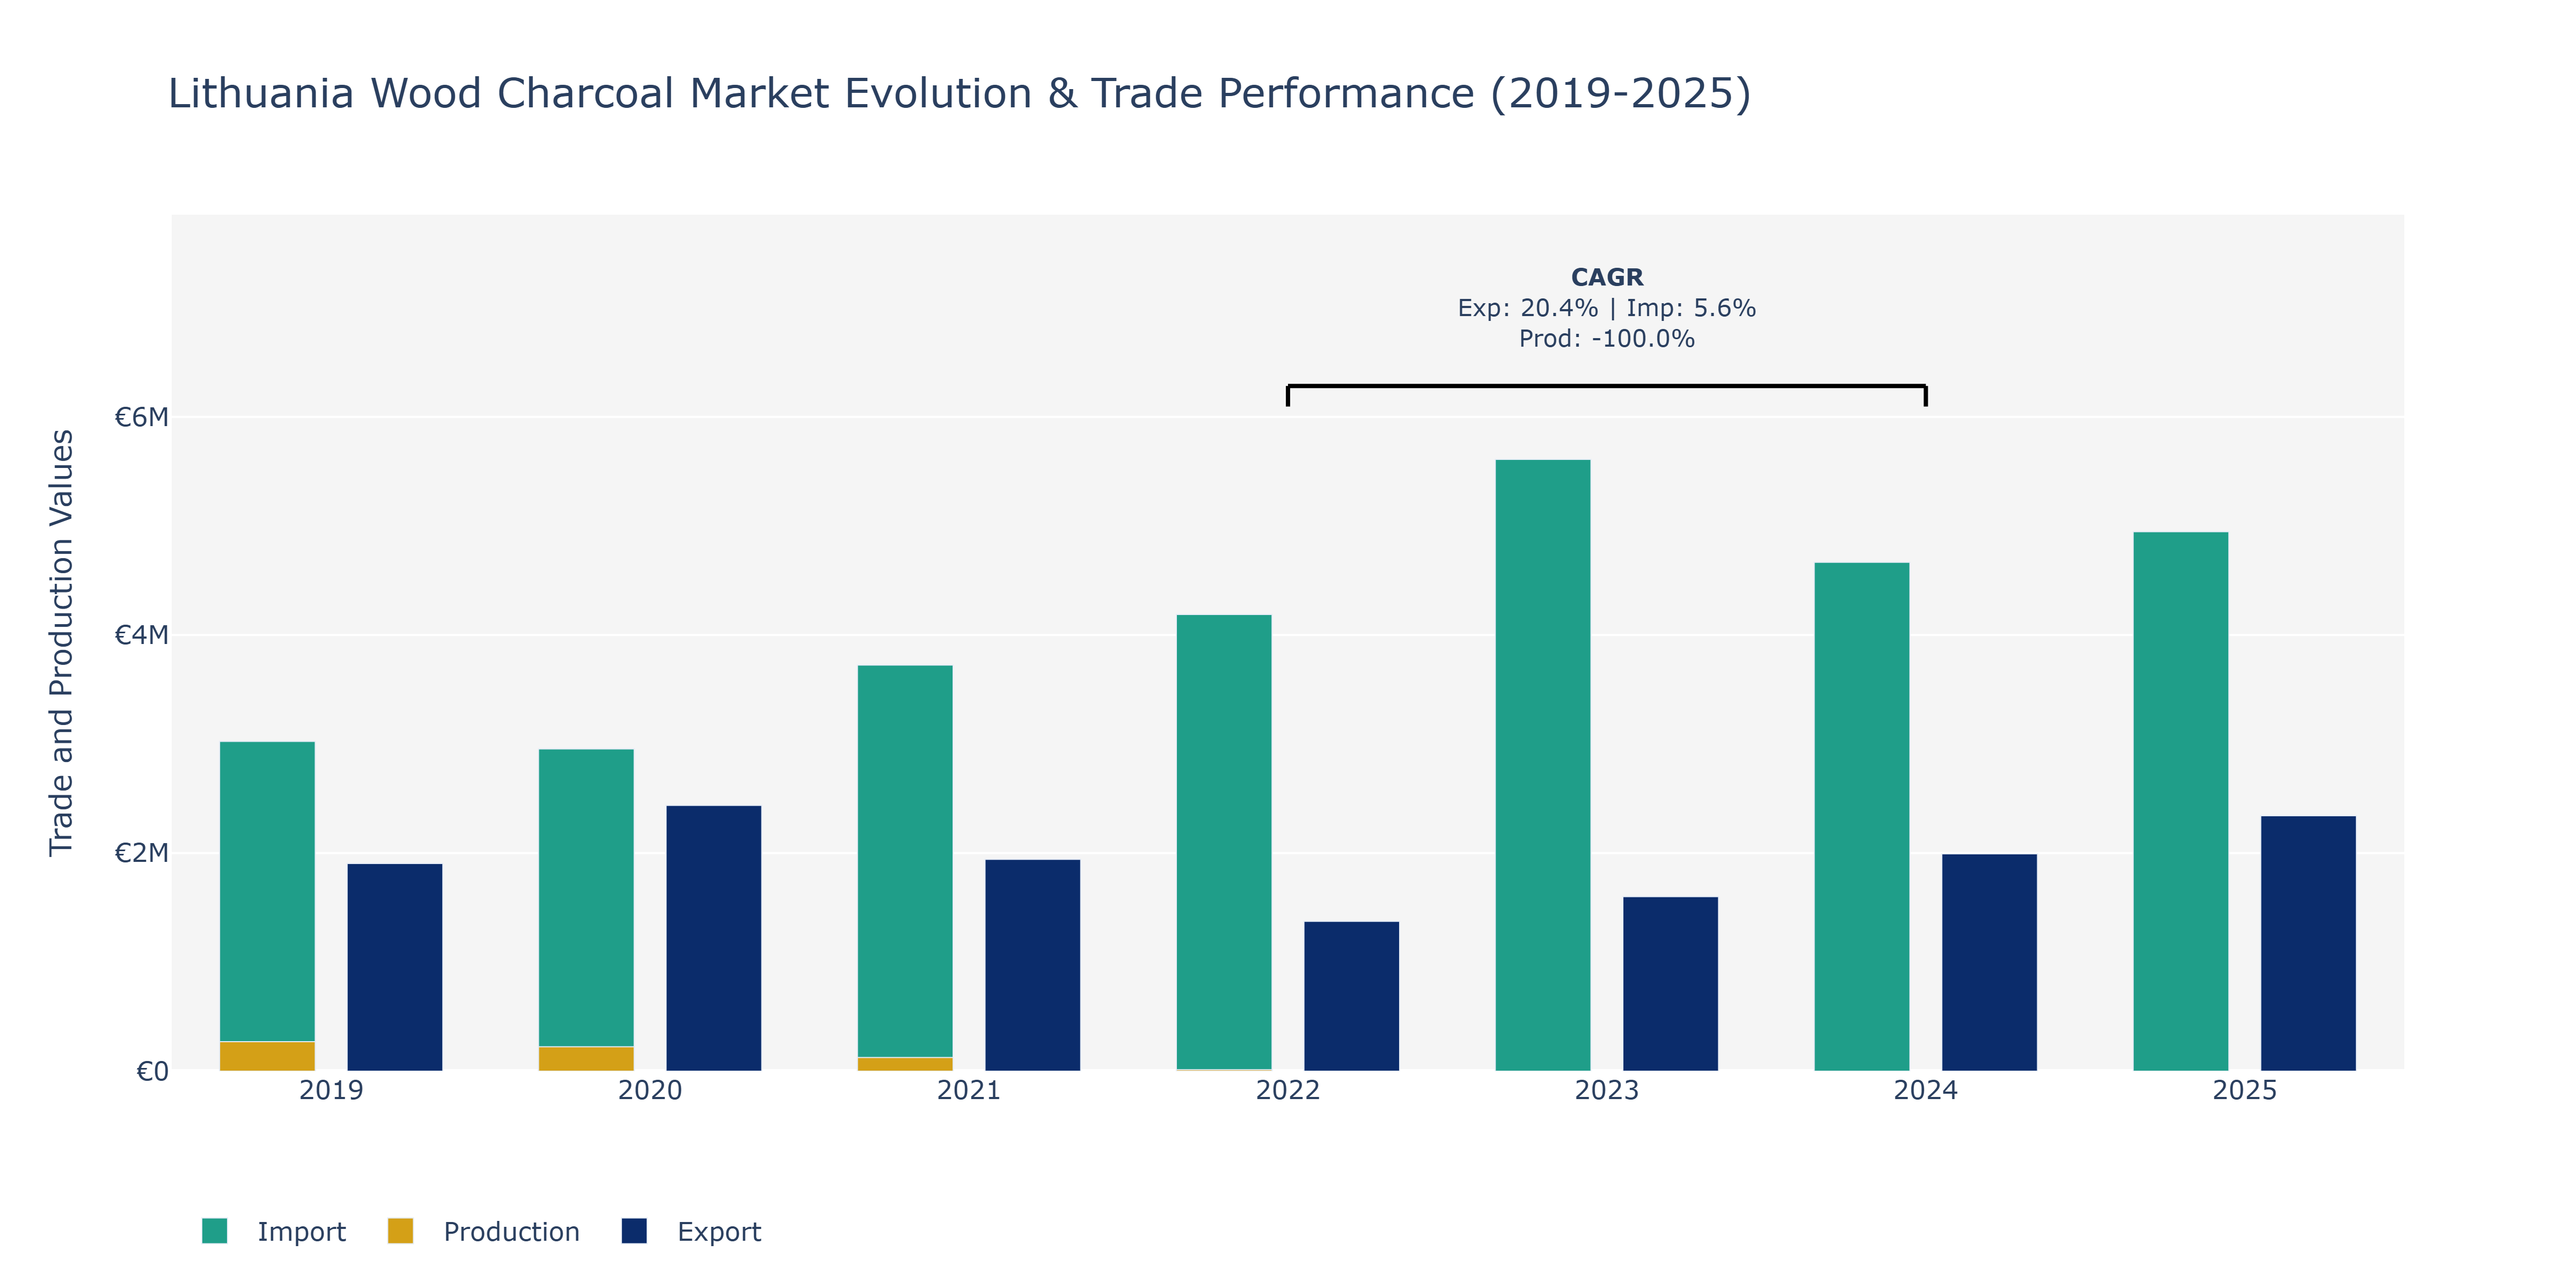
In the Lithuania Wood Charcoal Market, from 2019 to 2025, exports displayed varying trends. Exports saw a notable increase from €1.9 million in 2019 to €2.34 million in 2025, with a peak in 2020. This rise can be attributed to increased global demand for sustainable fuel alternatives and active international trade agreements supporting export growth. Conversely, imports experienced fluctuations, starting at €3.02 million in 2019, decreasing to €2.95 million in 2020, then rising to over €4.95 million in 2025. The surge in imports suggests a shift in market dynamics, potentially influenced by changes in domestic production capacity or cost competitiveness. Production, however, sharply declined from €270 million in 2019 to €14 million in 2022, potentially due to supply chain disruptions, environmental regulations impacting production processes, or shifts towards alternative charcoal sources. Such shifts emphasize the importance of market adaptability and sustainable practices within the wood charcoal industry.
Key Highlights of the Report:
- Lithuania Wood Charcoal Market Outlook
- Market Size of Lithuania Wood Charcoal Market, 2025
- Forecast of Lithuania Wood Charcoal Market, 2032
- Historical Data and Forecast of Lithuania Wood Charcoal Revenues & Volume for the Period 2022 - 2032F
- Lithuania Wood Charcoal Market Trend Evolution
- Lithuania Wood Charcoal Market Drivers and Challenges
- Lithuania Wood Charcoal Price Trends
- Lithuania Wood Charcoal Porter`s Five Forces
- Lithuania Wood Charcoal Industry Life Cycle
- Historical Data and Forecast of Lithuania Wood Charcoal Market Revenues & Volume By Product for the Period 2022 - 2032F
- Historical Data and Forecast of Lithuania Wood Charcoal Market Revenues & Volume By Charcoal Lumps for the Period 2022 - 2032F
- Historical Data and Forecast of Lithuania Wood Charcoal Market Revenues & Volume By Charcoal Briquettes for the Period 2022 - 2032F
- Historical Data and Forecast of Lithuania Wood Charcoal Market Revenues & Volume By Charcoal Powder for the Period 2022 - 2032F
- Historical Data and Forecast of Lithuania Wood Charcoal Market Revenues & Volume By Wood for the Period 2022 - 2032F
- Historical Data and Forecast of Lithuania Wood Charcoal Market Revenues & Volume By Softwood for the Period 2022 - 2032F
- Historical Data and Forecast of Lithuania Wood Charcoal Market Revenues & Volume By Hardwood for the Period 2022 - 2032F
- Historical Data and Forecast of Lithuania Wood Charcoal Market Revenues & Volume By Application for the Period 2022 - 2032F
- Historical Data and Forecast of Lithuania Wood Charcoal Market Revenues & Volume By Fuel Feedstock for the Period 2022 - 2032F
- Historical Data and Forecast of Lithuania Wood Charcoal Market Revenues & Volume By Reducing Agent for the Period 2022 - 2032F
- Historical Data and Forecast of Lithuania Wood Charcoal Market Revenues & Volume By Filtration Agent & Gas Masking for the Period 2022 - 2032F
- Historical Data and Forecast of Lithuania Wood Charcoal Market Revenues & Volume By Decolorizing Agent for the Period 2022 - 2032F
- Historical Data and Forecast of Lithuania Wood Charcoal Market Revenues & Volume By Gastric Medicine for the Period 2022 - 2032F
- Historical Data and Forecast of Lithuania Wood Charcoal Market Revenues & Volume By Sketches & Paints for the Period 2022 - 2032F
- Historical Data and Forecast of Lithuania Wood Charcoal Market Revenues & Volume By Soil Conditioning for the Period 2022 - 2032F
- Historical Data and Forecast of Lithuania Wood Charcoal Market Revenues & Volume By Others for the Period 2022 - 2032F
- Historical Data and Forecast of Lithuania Wood Charcoal Market Revenues & Volume By End Use for the Period 2022 - 2032F
- Historical Data and Forecast of Lithuania Wood Charcoal Market Revenues & Volume By Residential for the Period 2022 - 2032F
- Historical Data and Forecast of Lithuania Wood Charcoal Market Revenues & Volume By Cooking Fuel for the Period 2022 - 2032F
- Historical Data and Forecast of Lithuania Wood Charcoal Market Revenues & Volume By Gardening for the Period 2022 - 2032F
- Historical Data and Forecast of Lithuania Wood Charcoal Market Revenues & Volume By Commercial Paints & Sketches for the Period 2022 - 2032F
- Historical Data and Forecast of Lithuania Wood Charcoal Market Revenues & Volume By Water Treatment for the Period 2022 - 2032F
- Historical Data and Forecast of Lithuania Wood Charcoal Market Revenues & Volume By Industrial for the Period 2022 - 2032F
- Lithuania Wood Charcoal Import Export Trade Statistics
- Market Opportunity Assessment By Product
- Market Opportunity Assessment By Wood
- Market Opportunity Assessment By Application
- Market Opportunity Assessment By End Use
- Lithuania Wood Charcoal Top Companies Market Share
- Lithuania Wood Charcoal Competitive Benchmarking By Technical and Operational Parameters
- Lithuania Wood Charcoal Company Profiles
- Lithuania Wood Charcoal Key Strategic Recommendations
Frequently Asked Questions About the Market Study (FAQs):
6Wresearch actively monitors the Lithuania Wood Charcoal Market and publishes its comprehensive annual report, highlighting emerging trends, growth drivers, revenue analysis, and forecast outlook. Our insights help businesses to make data-backed strategic decisions with ongoing market dynamics. Our analysts track relevent industries related to the Lithuania Wood Charcoal Market, allowing our clients with actionable intelligence and reliable forecasts tailored to emerging regional needs.
Yes, we provide customisation as per your requirements. To learn more, feel free to contact us on sales@6wresearch.com
1 Executive Summary |
2 Introduction |
2.1 Key Highlights of the Report |
2.2 Report Description |
2.3 Market Scope & Segmentation |
2.4 Research Methodology |
2.5 Assumptions |
3 Lithuania Wood Charcoal Market Overview |
3.1 Lithuania Country Macro Economic Indicators |
3.2 Lithuania Wood Charcoal Market Revenues & Volume, 2022 & 2032F |
3.3 Lithuania Wood Charcoal Market - Industry Life Cycle |
3.4 Lithuania Wood Charcoal Market - Porter's Five Forces |
3.5 Lithuania Wood Charcoal Market Revenues & Volume Share, By Product, 2022 & 2032F |
3.6 Lithuania Wood Charcoal Market Revenues & Volume Share, By Wood, 2022 & 2032F |
3.7 Lithuania Wood Charcoal Market Revenues & Volume Share, By Application, 2022 & 2032F |
3.8 Lithuania Wood Charcoal Market Revenues & Volume Share, By End Use, 2022 & 2032F |
4 Lithuania Wood Charcoal Market Dynamics |
4.1 Impact Analysis |
4.2 Market Drivers |
4.2.1 Growing demand for natural and sustainable fuel alternatives |
4.2.2 Increasing popularity of outdoor cooking and BBQ culture |
4.2.3 Rising awareness about environmental conservation and renewable resources |
4.3 Market Restraints |
4.3.1 Fluctuations in raw material availability and pricing |
4.3.2 Competition from alternative fuel sources such as gas and electric grills |
4.3.3 Stringent regulations related to deforestation and forestry management |
5 Lithuania Wood Charcoal Market Trends |
6 Lithuania Wood Charcoal Market Segmentations |
6.1 Lithuania Wood Charcoal Market, By Product |
6.1.1 Overview and Analysis |
6.1.2 Lithuania Wood Charcoal Market Revenues & Volume, By Charcoal Lumps, 2022 - 2032F |
6.1.3 Lithuania Wood Charcoal Market Revenues & Volume, By Charcoal Briquettes, 2022 - 2032F |
6.1.4 Lithuania Wood Charcoal Market Revenues & Volume, By Charcoal Powder, 2022 - 2032F |
6.2 Lithuania Wood Charcoal Market, By Wood |
6.2.1 Overview and Analysis |
6.2.2 Lithuania Wood Charcoal Market Revenues & Volume, By Softwood, 2022 - 2032F |
6.2.3 Lithuania Wood Charcoal Market Revenues & Volume, By Hardwood, 2022 - 2032F |
6.3 Lithuania Wood Charcoal Market, By Application |
6.3.1 Overview and Analysis |
6.3.2 Lithuania Wood Charcoal Market Revenues & Volume, By Fuel Feedstock, 2022 - 2032F |
6.3.3 Lithuania Wood Charcoal Market Revenues & Volume, By Reducing Agent, 2022 - 2032F |
6.3.4 Lithuania Wood Charcoal Market Revenues & Volume, By Filtration Agent & Gas Masking, 2022 - 2032F |
6.3.5 Lithuania Wood Charcoal Market Revenues & Volume, By Decolorizing Agent, 2022 - 2032F |
6.3.6 Lithuania Wood Charcoal Market Revenues & Volume, By Gastric Medicine, 2022 - 2032F |
6.3.7 Lithuania Wood Charcoal Market Revenues & Volume, By Sketches & Paints, 2022 - 2032F |
6.3.8 Lithuania Wood Charcoal Market Revenues & Volume, By Others, 2022 - 2032F |
6.3.9 Lithuania Wood Charcoal Market Revenues & Volume, By Others, 2022 - 2032F |
6.4 Lithuania Wood Charcoal Market, By End Use |
6.4.1 Overview and Analysis |
6.4.2 Lithuania Wood Charcoal Market Revenues & Volume, By Residential, 2022 - 2032F |
6.4.3 Lithuania Wood Charcoal Market Revenues & Volume, By Cooking Fuel, 2022 - 2032F |
6.4.4 Lithuania Wood Charcoal Market Revenues & Volume, By Gardening, 2022 - 2032F |
6.4.5 Lithuania Wood Charcoal Market Revenues & Volume, By Commercial Paints & Sketches, 2022 - 2032F |
6.4.6 Lithuania Wood Charcoal Market Revenues & Volume, By Water Treatment, 2022 - 2032F |
6.4.7 Lithuania Wood Charcoal Market Revenues & Volume, By Industrial, 2022 - 2032F |
7 Lithuania Wood Charcoal Market Import-Export Trade Statistics |
7.1 Lithuania Wood Charcoal Market Export to Major Countries |
7.2 Lithuania Wood Charcoal Market Imports from Major Countries |
8 Lithuania Wood Charcoal Market Key Performance Indicators |
8.1 Average selling price of wood charcoal in Lithuania |
8.2 Number of new product innovations and technologies in wood charcoal production |
8.3 Percentage of households using wood charcoal for cooking or heating applications |
9 Lithuania Wood Charcoal Market - Opportunity Assessment |
9.1 Lithuania Wood Charcoal Market Opportunity Assessment, By Product, 2022 & 2032F |
9.2 Lithuania Wood Charcoal Market Opportunity Assessment, By Wood, 2022 & 2032F |
9.3 Lithuania Wood Charcoal Market Opportunity Assessment, By Application, 2022 & 2032F |
9.4 Lithuania Wood Charcoal Market Opportunity Assessment, By End Use, 2022 & 2032F |
10 Lithuania Wood Charcoal Market - Competitive Landscape |
10.1 Lithuania Wood Charcoal Market Revenue Share, By Companies, 2025 |
10.2 Lithuania Wood Charcoal Market Competitive Benchmarking, By Operating and Technical Parameters |
11 Company Profiles |
12 Recommendations | 13 Disclaimer |
Global Go To Market Strategy - 2030
Export potential enables firms to identify high-growth global markets with greater confidence by combining advanced trade intelligence with a structured quantitative methodology. The framework analyzes emerging demand trends and country-level import patterns while integrating macroeconomic and trade datasets such as GDP and population forecasts, bilateral import–export flows, tariff structures, elasticity differentials between developed and developing economies, geographic distance, and import demand projections. Using weighted trade values from 2020–2024 as the base period to project country-to-country export potential for 2030, these inputs are operationalized through calculated drivers such as gravity model parameters, tariff impact factors, and projected GDP per-capita growth. Through an analysis of hidden potentials, demand hotspots, and market conditions that are most favorable to success, this method enables firms to focus on target countries, maximize returns, and global expansion with data, backed by accuracy.
By factoring in the projected importer demand gap that is currently unmet and could be potential opportunity, it identifies the potential for the Exporter (Country) among 190 countries, against the general trade analysis, which identifies the biggest importer or exporter.
To discover high-growth global markets and optimize your business strategy:
Click Here
Pricing
- Single User License$ 1,995
- Department License$ 2,400
- Site License$ 3,120
- Global License$ 3,795

Leadership Perspectives from Industry Events
Search
Thought Leadership and Analyst Meet


Our Clients
6WResearch In News
- India Export Attractiveness Tracker 2026
- India Air Conditioner Market Set for Strong Rebound in 2026 After Weather-Led Correction and GST-Driven Recovery: 6Wresearch
- ADAS in India: How Automatic Emergency Braking, Blind Spot Detection & Driver Monitoring are Transforming Road Safety
- Doha a strategic location for EV manufacturing hub: IPA Qatar
- Demand for luxury TVs surging in the GCC, says Samsung
- Empowering Growth: The Thriving Journey of Bangladesh’s Cable Industry
Latest Reports
- Nicaragua RPG Gaming Market (2026-2032)
- New Zealand RPG Gaming Market (2026-2032)
- Netherlands RPG Gaming Market (2026-2032)
- Nauru RPG Gaming Market (2026-2032)
- Namibia RPG Gaming Market (2026-2032)
- Mozambique RPG Gaming Market (2026-2032)
- Montenegro RPG Gaming Market (2026-2032)
- Mongolia RPG Gaming Market (2026-2032)
- Monaco RPG Gaming Market (2026-2032)
- Micronesia RPG Gaming Market (2026-2032)
Industry Events and Analyst Meet

EV India Expo 2026

HIMTEX 2026

India Refining Summit 2026

India EV Show 2026

EV tech India Expo 2026
Whitepaper
- Middle East & Africa Commercial Security Market Click here to view more.
- Middle East & Africa Fire Safety Systems & Equipment Market Click here to view more.
- GCC Drone Market Click here to view more.
- Middle East Lighting Fixture Market Click here to view more.
- GCC Physical & Perimeter Security Market Click here to view more.