Luxembourg Rubber Stamps Market (2026-2032) | Outlook, Companies, Value, Segmentation, Analysis, Growth, Revenue, Trends, Forecast, Size, Share & Industry
Market Forecast By Product (Custom Rubber Stamps, Common Rubber Stamps), By Application (Household, Commercial, Others) And Competitive Landscape
| Product Code: ETC5103935 | Publication Date: Nov 2023 | Updated Date: Apr 2026 | Product Type: Market Research Report | |
| Publisher: 6Wresearch | Author: Shubham Padhi | No. of Pages: 60 | No. of Figures: 30 | No. of Tables: 5 |
Luxembourg Rubber Stamps Market Size (2020-2030)
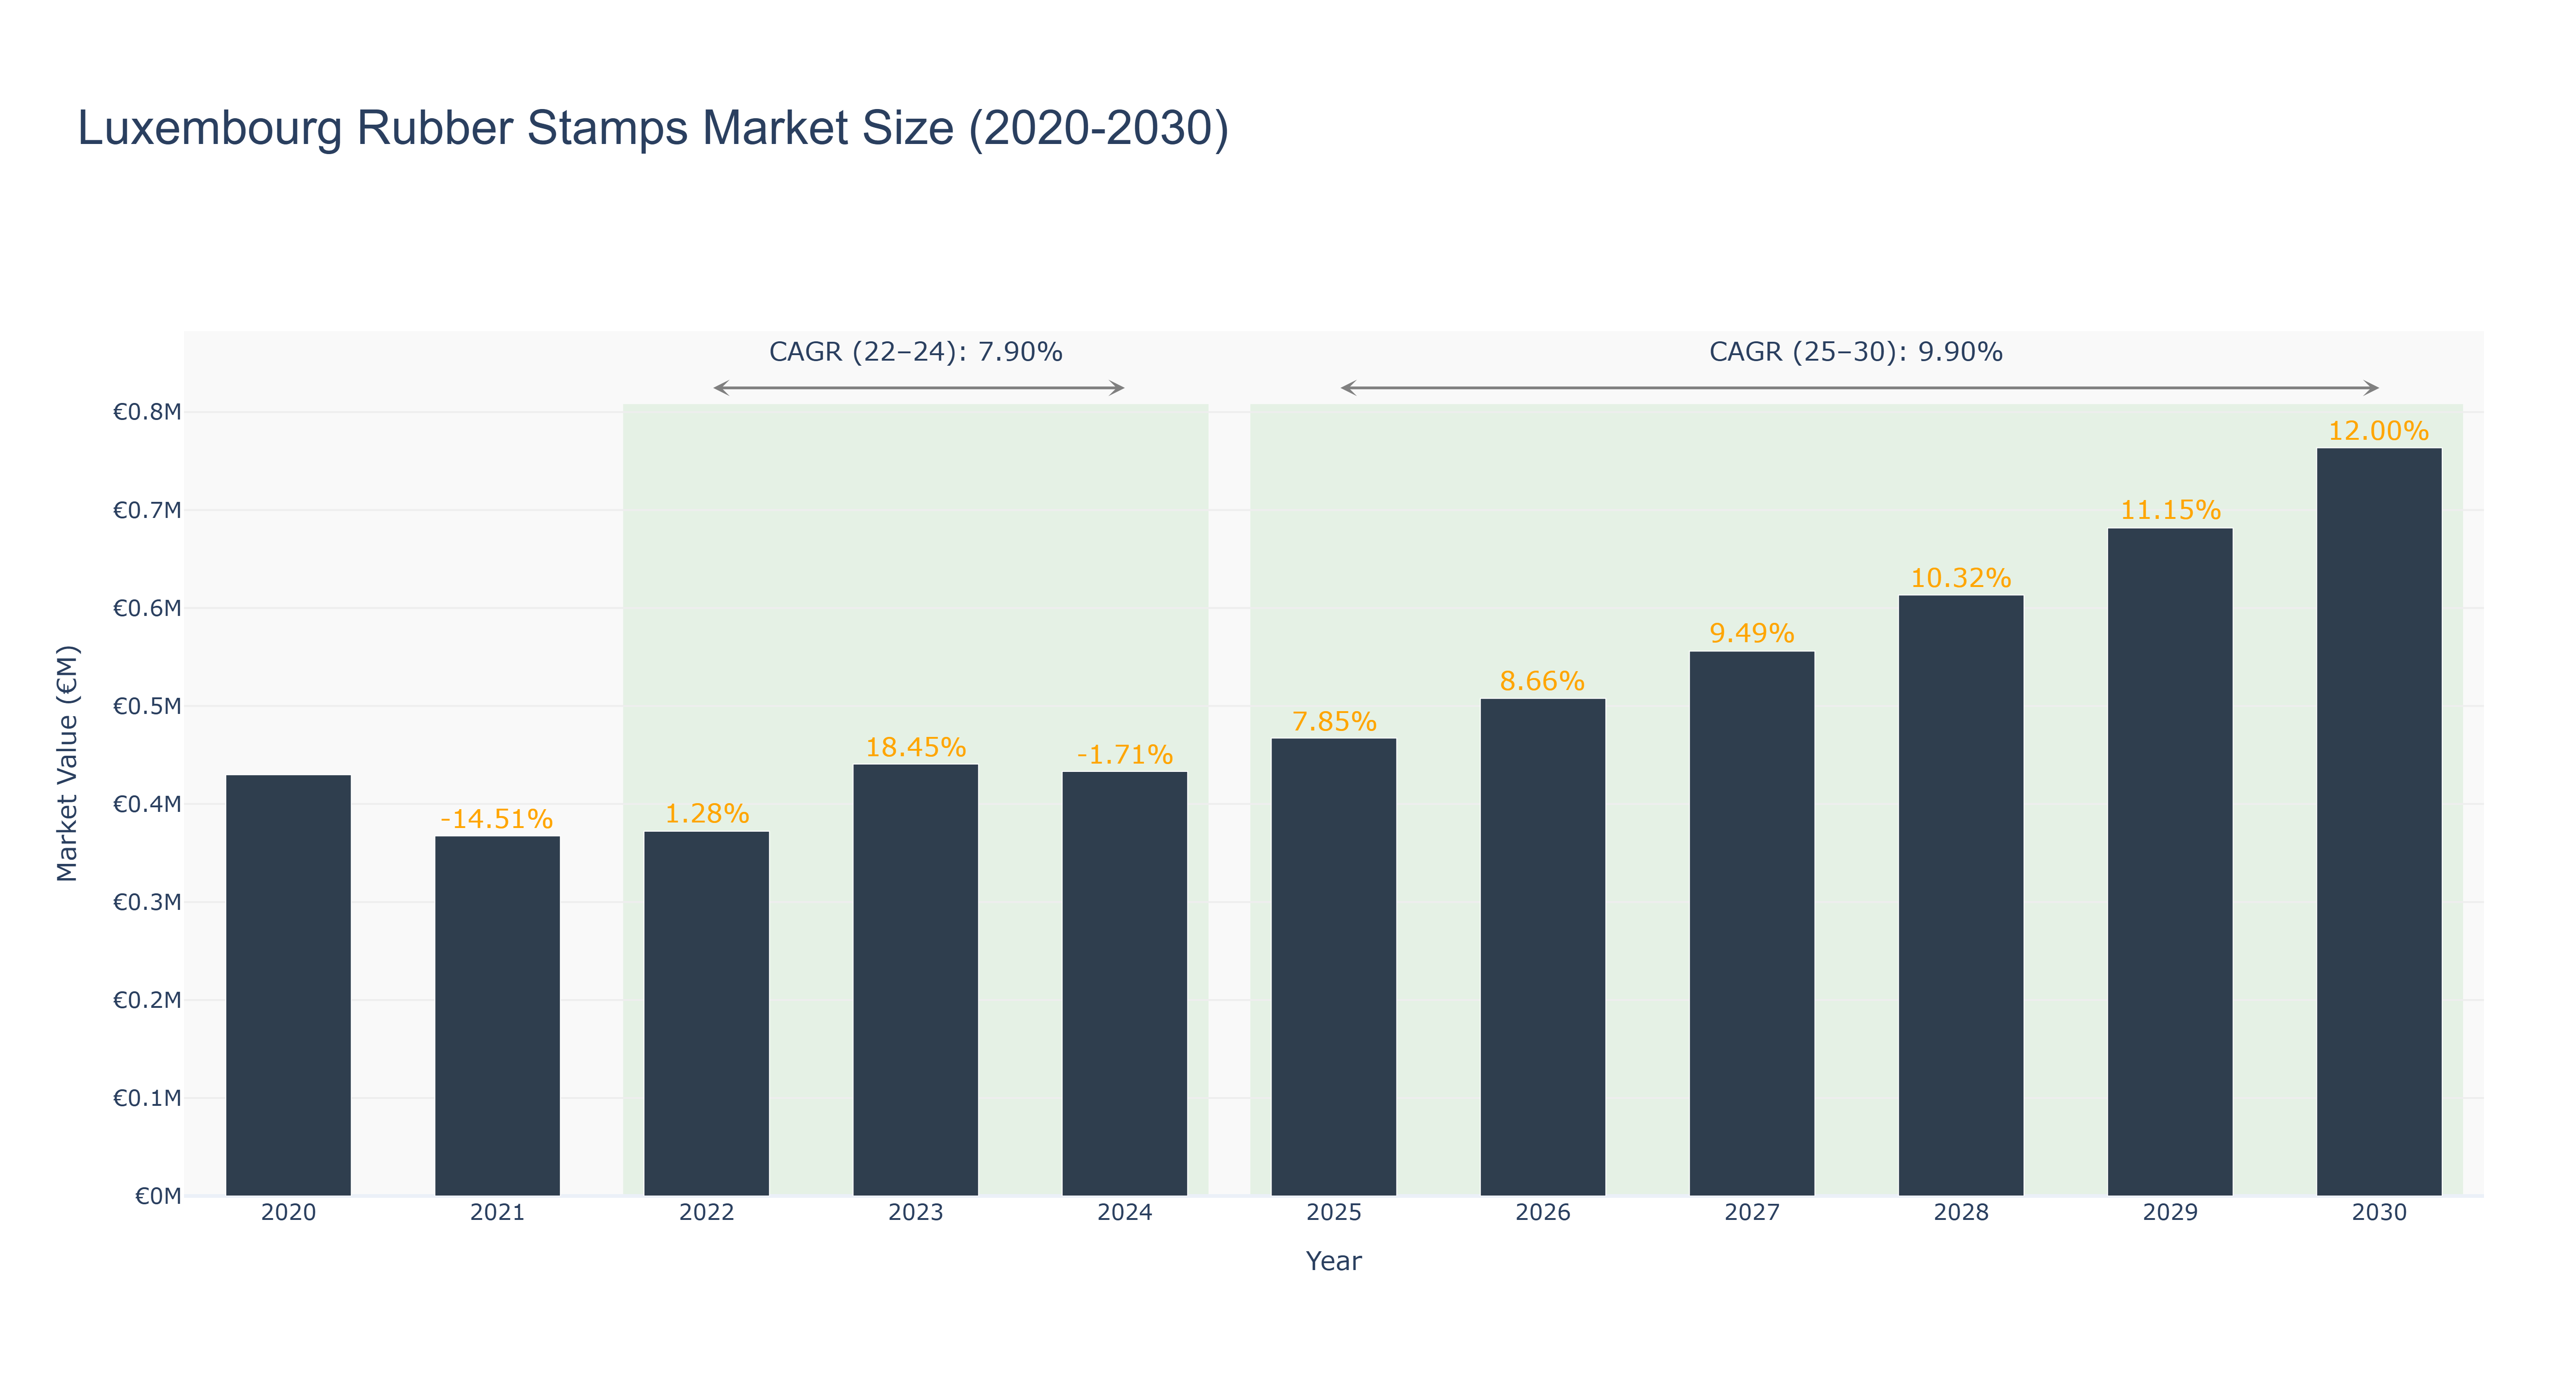
Luxembourg Rubber Stamps Market has shown a fluctuating trend in market size over the years. The peak market size of €0.76 million is forecasted for 2030, with a steady increase in size from 2025 to 2030. The market experienced a slight decline from 2020 to 2021, followed by a recovery and growth phase. The CAGR from 2022 to 2024 is 7.90%, attributed to consistent demand and innovation in stamping technology. Subsequently, the CAGR from 2025 to 2030 is projected at 9.90%, indicating a promising future for the market. Industry drivers include a growing need for personalized branding and administrative documentation. Looking ahead, Luxembourg is set to implement digital stamping solutions to enhance efficiency and security in document verification processes, further driving market expansion.
Luxembourg Rubber Stamps Market: Production & Trade Performance (2019-2025)
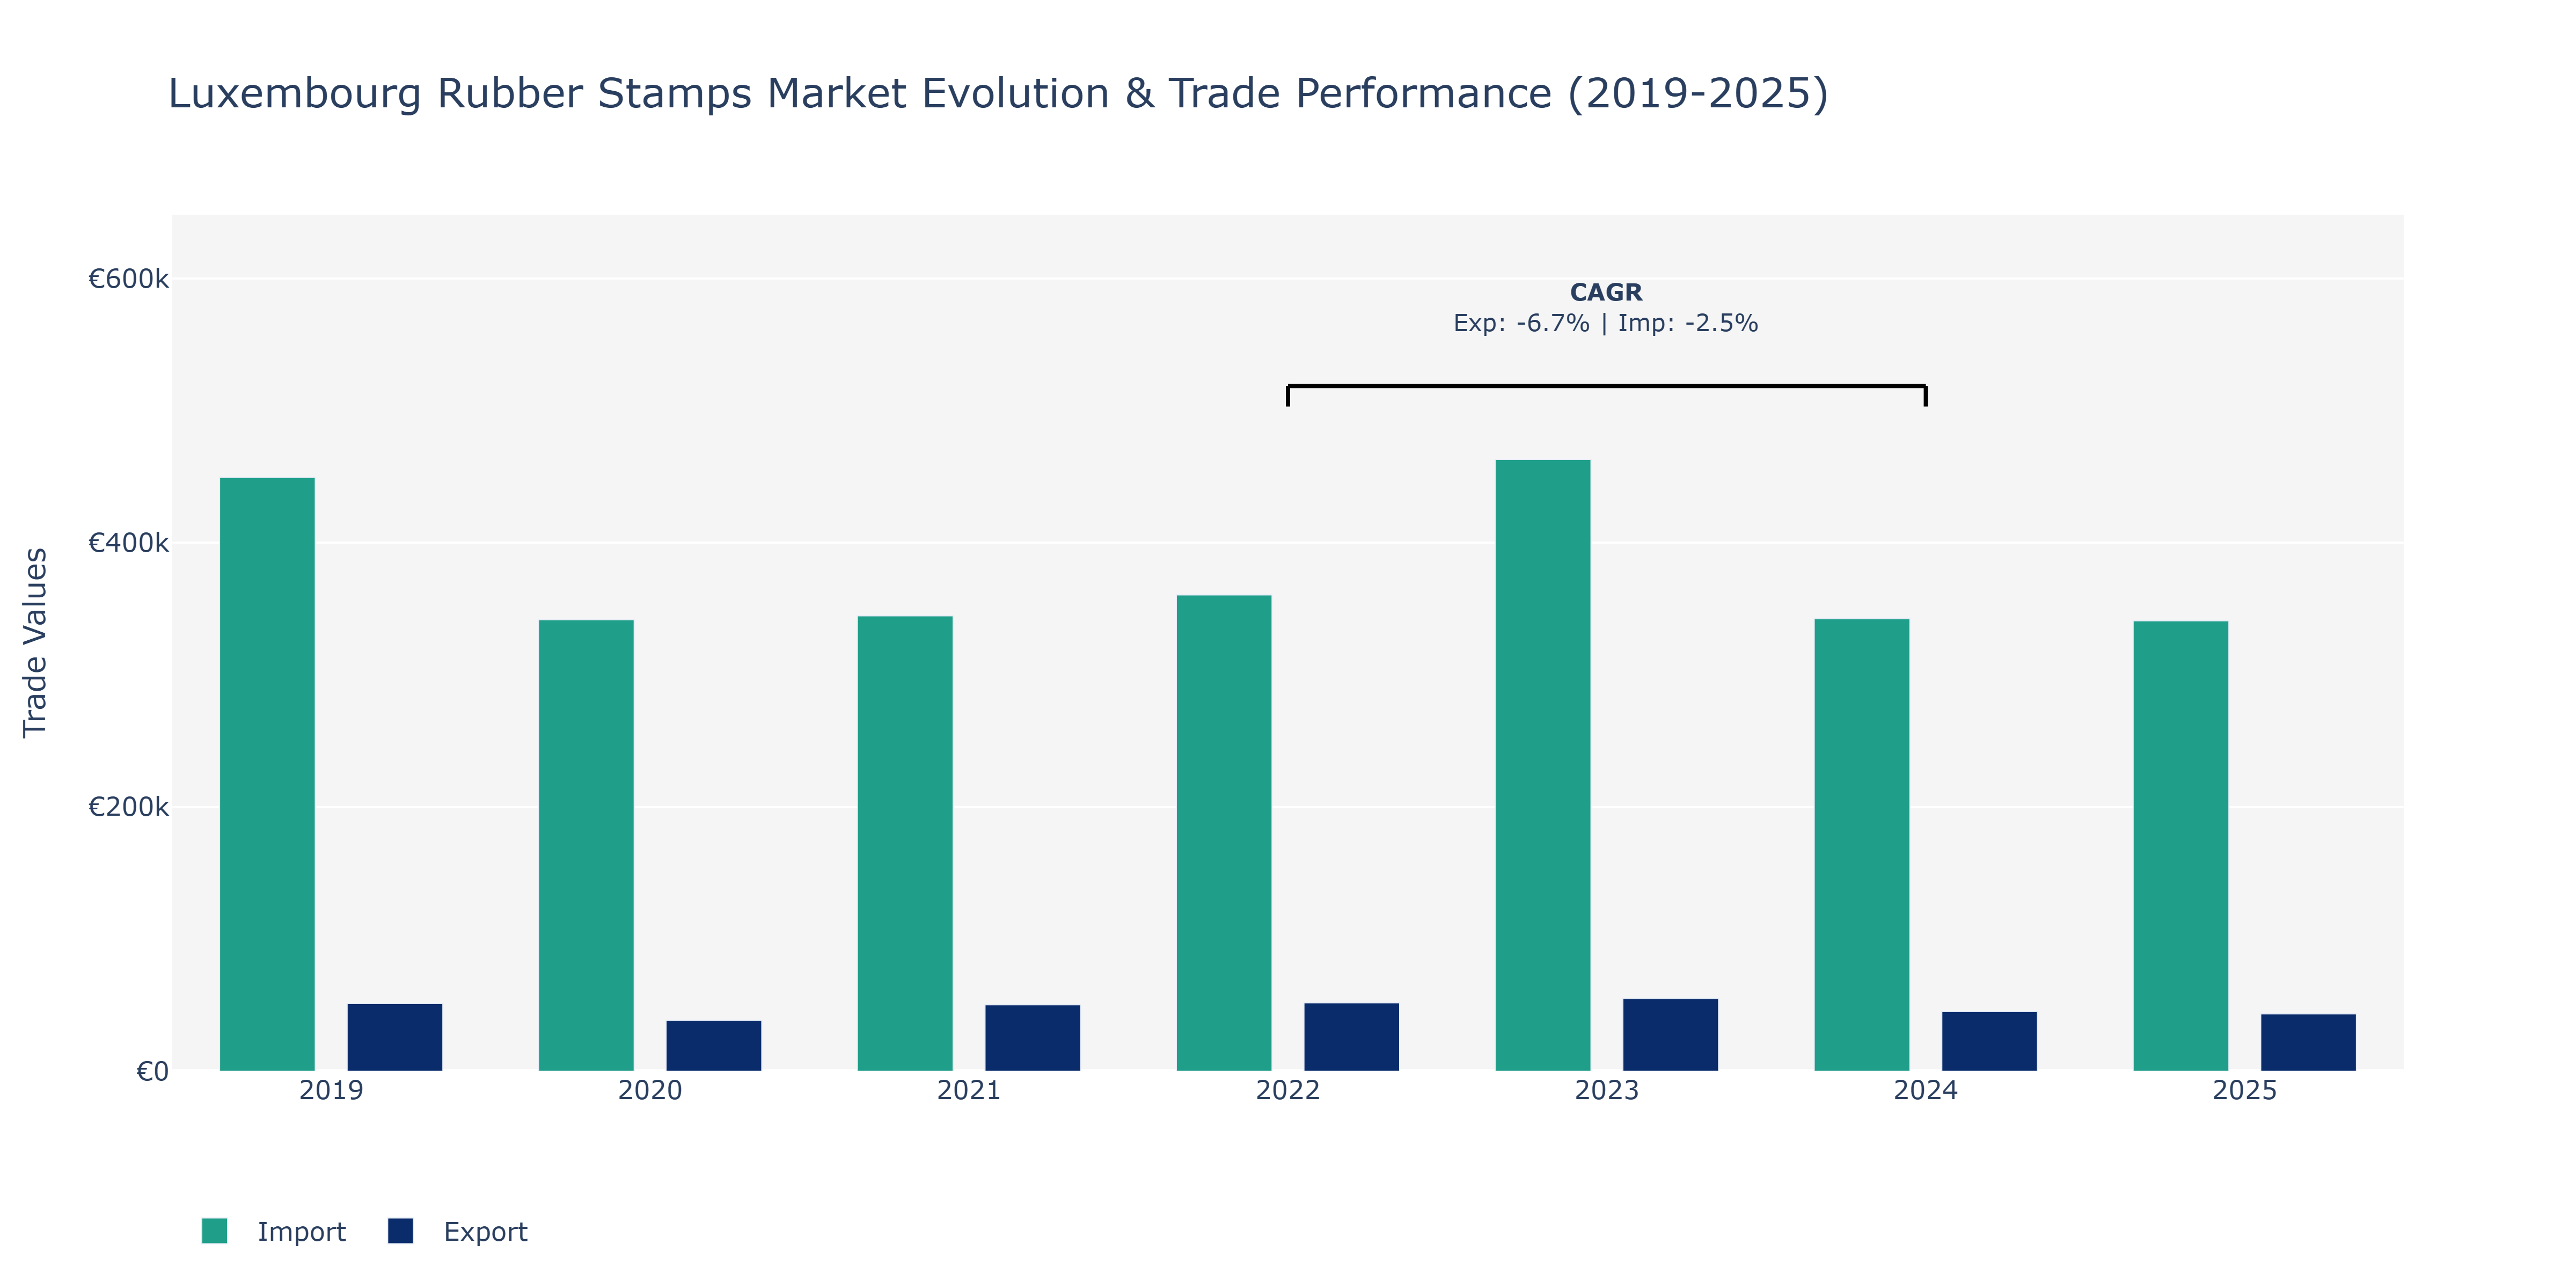
In the Luxembourg Rubber Stamps Market, exports experienced a fluctuating trajectory over the observed period. Starting at €51.16 thousand in 2019, exports decreased to €38.6 thousand in 2020 before rebounding to €50.27 thousand in 2021. The peak was seen in 2023 at €55.02 thousand, followed by a decline to €45.04 thousand in 2024 and €43.34 thousand in 2025. Conversely, imports showcased a more stable pattern, declining from €449.42 thousand in 2019 to €341.77 thousand in 2020 before gradually increasing to €463.11 thousand in 2023. A notable drop was observed in 2024 to €342.45 thousand and a subtle decrease to €340.96 thousand in 2025. The fluctuations in exports could be attributed to global economic uncertainties impacting demand for rubber stamps, while the stable imports indicate consistent demand for foreign products used in the manufacturing process. The decline in exports in 2024 might be influenced by competitive pricing strategies in the market, impacting Luxembourg's export competitiveness.
Key Highlights of the Report:
- Luxembourg Rubber Stamps Market Outlook
- Market Size of Luxembourg Rubber Stamps Market, 2025
- Forecast of Luxembourg Rubber Stamps Market, 2032
- Historical Data and Forecast of Luxembourg Rubber Stamps Revenues & Volume for the Period 2022-2032F
- Luxembourg Rubber Stamps Market Trend Evolution
- Luxembourg Rubber Stamps Market Drivers and Challenges
- Luxembourg Rubber Stamps Price Trends
- Luxembourg Rubber Stamps Porter`s Five Forces
- Luxembourg Rubber Stamps Industry Life Cycle
- Historical Data and Forecast of Luxembourg Rubber Stamps Market Revenues & Volume By Product for the Period 2022-2032F
- Historical Data and Forecast of Luxembourg Rubber Stamps Market Revenues & Volume By Custom Rubber Stamps for the Period 2022-2032F
- Historical Data and Forecast of Luxembourg Rubber Stamps Market Revenues & Volume By Common Rubber Stamps for the Period 2022-2032F
- Historical Data and Forecast of Luxembourg Rubber Stamps Market Revenues & Volume By Application for the Period 2022-2032F
- Historical Data and Forecast of Luxembourg Rubber Stamps Market Revenues & Volume By Household for the Period 2022-2032F
- Historical Data and Forecast of Luxembourg Rubber Stamps Market Revenues & Volume By Commercial for the Period 2022-2032F
- Historical Data and Forecast of Luxembourg Rubber Stamps Market Revenues & Volume By Others for the Period 2022-2032F
- Luxembourg Rubber Stamps Import Export Trade Statistics
- Market Opportunity Assessment By Product
- Market Opportunity Assessment By Application
- Luxembourg Rubber Stamps Top Companies Market Share
- Luxembourg Rubber Stamps Competitive Benchmarking By Technical and Operational Parameters
- Luxembourg Rubber Stamps Company Profiles
- Luxembourg Rubber Stamps Key Strategic Recommendations
Frequently Asked Questions About the Market Study (FAQs):
6Wresearch actively monitors the Luxembourg Rubber Stamps Market and publishes its comprehensive annual report, highlighting emerging trends, growth drivers, revenue analysis, and forecast outlook. Our insights help businesses to make data-backed strategic decisions with ongoing market dynamics. Our analysts track relevent industries related to the Luxembourg Rubber Stamps Market, allowing our clients with actionable intelligence and reliable forecasts tailored to emerging regional needs.
Yes, we provide customisation as per your requirements. To learn more, feel free to contact us on sales@6wresearch.com
1 Executive Summary |
2 Introduction |
2.1 Key Highlights of the Report |
2.2 Report Description |
2.3 Market Scope & Segmentation |
2.4 Research Methodology |
2.5 Assumptions |
3 Luxembourg Rubber Stamps Market Overview |
3.1 Luxembourg Country Macro Economic Indicators |
3.2 Luxembourg Rubber Stamps Market Revenues & Volume, 2022 & 2032F |
3.3 Luxembourg Rubber Stamps Market - Industry Life Cycle |
3.4 Luxembourg Rubber Stamps Market - Porter's Five Forces |
3.5 Luxembourg Rubber Stamps Market Revenues & Volume Share, By Product, 2022 & 2032F |
3.6 Luxembourg Rubber Stamps Market Revenues & Volume Share, By Application, 2022 & 2032F |
4 Luxembourg Rubber Stamps Market Dynamics |
4.1 Impact Analysis |
4.2 Market Drivers |
4.2.1 Increasing demand for personalized and customized rubber stamps for businesses and individuals |
4.2.2 Growth of e-commerce and online platforms leading to higher accessibility and distribution channels for rubber stamps |
4.2.3 Government initiatives promoting small businesses and entrepreneurship, leading to higher demand for office supplies like rubber stamps |
4.3 Market Restraints |
4.3.1 Rising competition from digital alternatives like electronic signatures impacting the traditional rubber stamp market |
4.3.2 Fluctuating raw material prices affecting the production cost of rubber stamps |
4.3.3 Regulatory changes and compliance requirements impacting the manufacturing and distribution of rubber stamps |
5 Luxembourg Rubber Stamps Market Trends |
6 Luxembourg Rubber Stamps Market Segmentations |
6.1 Luxembourg Rubber Stamps Market, By Product |
6.1.1 Overview and Analysis |
6.1.2 Luxembourg Rubber Stamps Market Revenues & Volume, By Custom Rubber Stamps, 2022-2032F |
6.1.3 Luxembourg Rubber Stamps Market Revenues & Volume, By Common Rubber Stamps, 2022-2032F |
6.2 Luxembourg Rubber Stamps Market, By Application |
6.2.1 Overview and Analysis |
6.2.2 Luxembourg Rubber Stamps Market Revenues & Volume, By Household, 2022-2032F |
6.2.3 Luxembourg Rubber Stamps Market Revenues & Volume, By Commercial, 2022-2032F |
6.2.4 Luxembourg Rubber Stamps Market Revenues & Volume, By Others, 2022-2032F |
7 Luxembourg Rubber Stamps Market Import-Export Trade Statistics |
7.1 Luxembourg Rubber Stamps Market Export to Major Countries |
7.2 Luxembourg Rubber Stamps Market Imports from Major Countries |
8 Luxembourg Rubber Stamps Market Key Performance Indicators |
8.1 Average order value for rubber stamps |
8.2 Customer retention rate for rubber stamp purchases |
8.3 Number of new product launches and innovations in the rubber stamp market |
9 Luxembourg Rubber Stamps Market - Opportunity Assessment |
9.1 Luxembourg Rubber Stamps Market Opportunity Assessment, By Product, 2022 & 2032F |
9.2 Luxembourg Rubber Stamps Market Opportunity Assessment, By Application, 2022 & 2032F |
10 Luxembourg Rubber Stamps Market - Competitive Landscape |
10.1 Luxembourg Rubber Stamps Market Revenue Share, By Companies, 2025 |
10.2 Luxembourg Rubber Stamps Market Competitive Benchmarking, By Operating and Technical Parameters |
11 Company Profiles |
12 Recommendations | 13 Disclaimer |
Global Go To Market Strategy - 2030
Export potential enables firms to identify high-growth global markets with greater confidence by combining advanced trade intelligence with a structured quantitative methodology. The framework analyzes emerging demand trends and country-level import patterns while integrating macroeconomic and trade datasets such as GDP and population forecasts, bilateral import–export flows, tariff structures, elasticity differentials between developed and developing economies, geographic distance, and import demand projections. Using weighted trade values from 2020–2024 as the base period to project country-to-country export potential for 2030, these inputs are operationalized through calculated drivers such as gravity model parameters, tariff impact factors, and projected GDP per-capita growth. Through an analysis of hidden potentials, demand hotspots, and market conditions that are most favorable to success, this method enables firms to focus on target countries, maximize returns, and global expansion with data, backed by accuracy.
By factoring in the projected importer demand gap that is currently unmet and could be potential opportunity, it identifies the potential for the Exporter (Country) among 190 countries, against the general trade analysis, which identifies the biggest importer or exporter.
To discover high-growth global markets and optimize your business strategy:
Click Here
Pricing
- Single User License$ 1,995
- Department License$ 2,400
- Site License$ 3,120
- Global License$ 3,795

Leadership Perspectives from Industry Events
Search
Thought Leadership and Analyst Meet


Our Clients
6WResearch In News
- India Export Attractiveness Tracker 2026
- India Air Conditioner Market Set for Strong Rebound in 2026 After Weather-Led Correction and GST-Driven Recovery: 6Wresearch
- ADAS in India: How Automatic Emergency Braking, Blind Spot Detection & Driver Monitoring are Transforming Road Safety
- Doha a strategic location for EV manufacturing hub: IPA Qatar
- Demand for luxury TVs surging in the GCC, says Samsung
- Empowering Growth: The Thriving Journey of Bangladesh’s Cable Industry
Latest Reports
- Nicaragua RPG Gaming Market (2026-2032)
- New Zealand RPG Gaming Market (2026-2032)
- Netherlands RPG Gaming Market (2026-2032)
- Nauru RPG Gaming Market (2026-2032)
- Namibia RPG Gaming Market (2026-2032)
- Mozambique RPG Gaming Market (2026-2032)
- Montenegro RPG Gaming Market (2026-2032)
- Mongolia RPG Gaming Market (2026-2032)
- Monaco RPG Gaming Market (2026-2032)
- Micronesia RPG Gaming Market (2026-2032)
Industry Events and Analyst Meet

EV India Expo 2026

HIMTEX 2026

India Refining Summit 2026

India EV Show 2026

EV tech India Expo 2026
Whitepaper
- Middle East & Africa Commercial Security Market Click here to view more.
- Middle East & Africa Fire Safety Systems & Equipment Market Click here to view more.
- GCC Drone Market Click here to view more.
- Middle East Lighting Fixture Market Click here to view more.
- GCC Physical & Perimeter Security Market Click here to view more.