Luxembourg Steel Drawn Wire Market (2026-2032) | Growth, Size & Revenue, Trends, Value, Industry, Companies, Competitive Landscape, Analysis, Forecast, Share, Segmentation, Outlook
Market Forecast By Product Type (Carbon Steel, Stainless Steel, Alloy Steel), By Diameter (Up to 5 mm, 6-10 mm, 11-15 mm, 16-20 mm, Above 20 mm), By End-user (Automotive, Construction, Military, Telecom, Power & Energy, Heavy Machinery, Others (Aviation, Agriculture, etc.)), By Distribution Channel (Direct Sales, Indirect Sales) And Competitive Landscape
| Product Code: ETC8073724 | Publication Date: Sep 2024 | Updated Date: Apr 2026 | Product Type: Market Research Report | |
| Publisher: 6Wresearch | Author: Dhaval Chaurasia | No. of Pages: 75 | No. of Figures: 35 | No. of Tables: 20 |
Luxembourg Steel Drawn Wire Market Size (2020-2030)
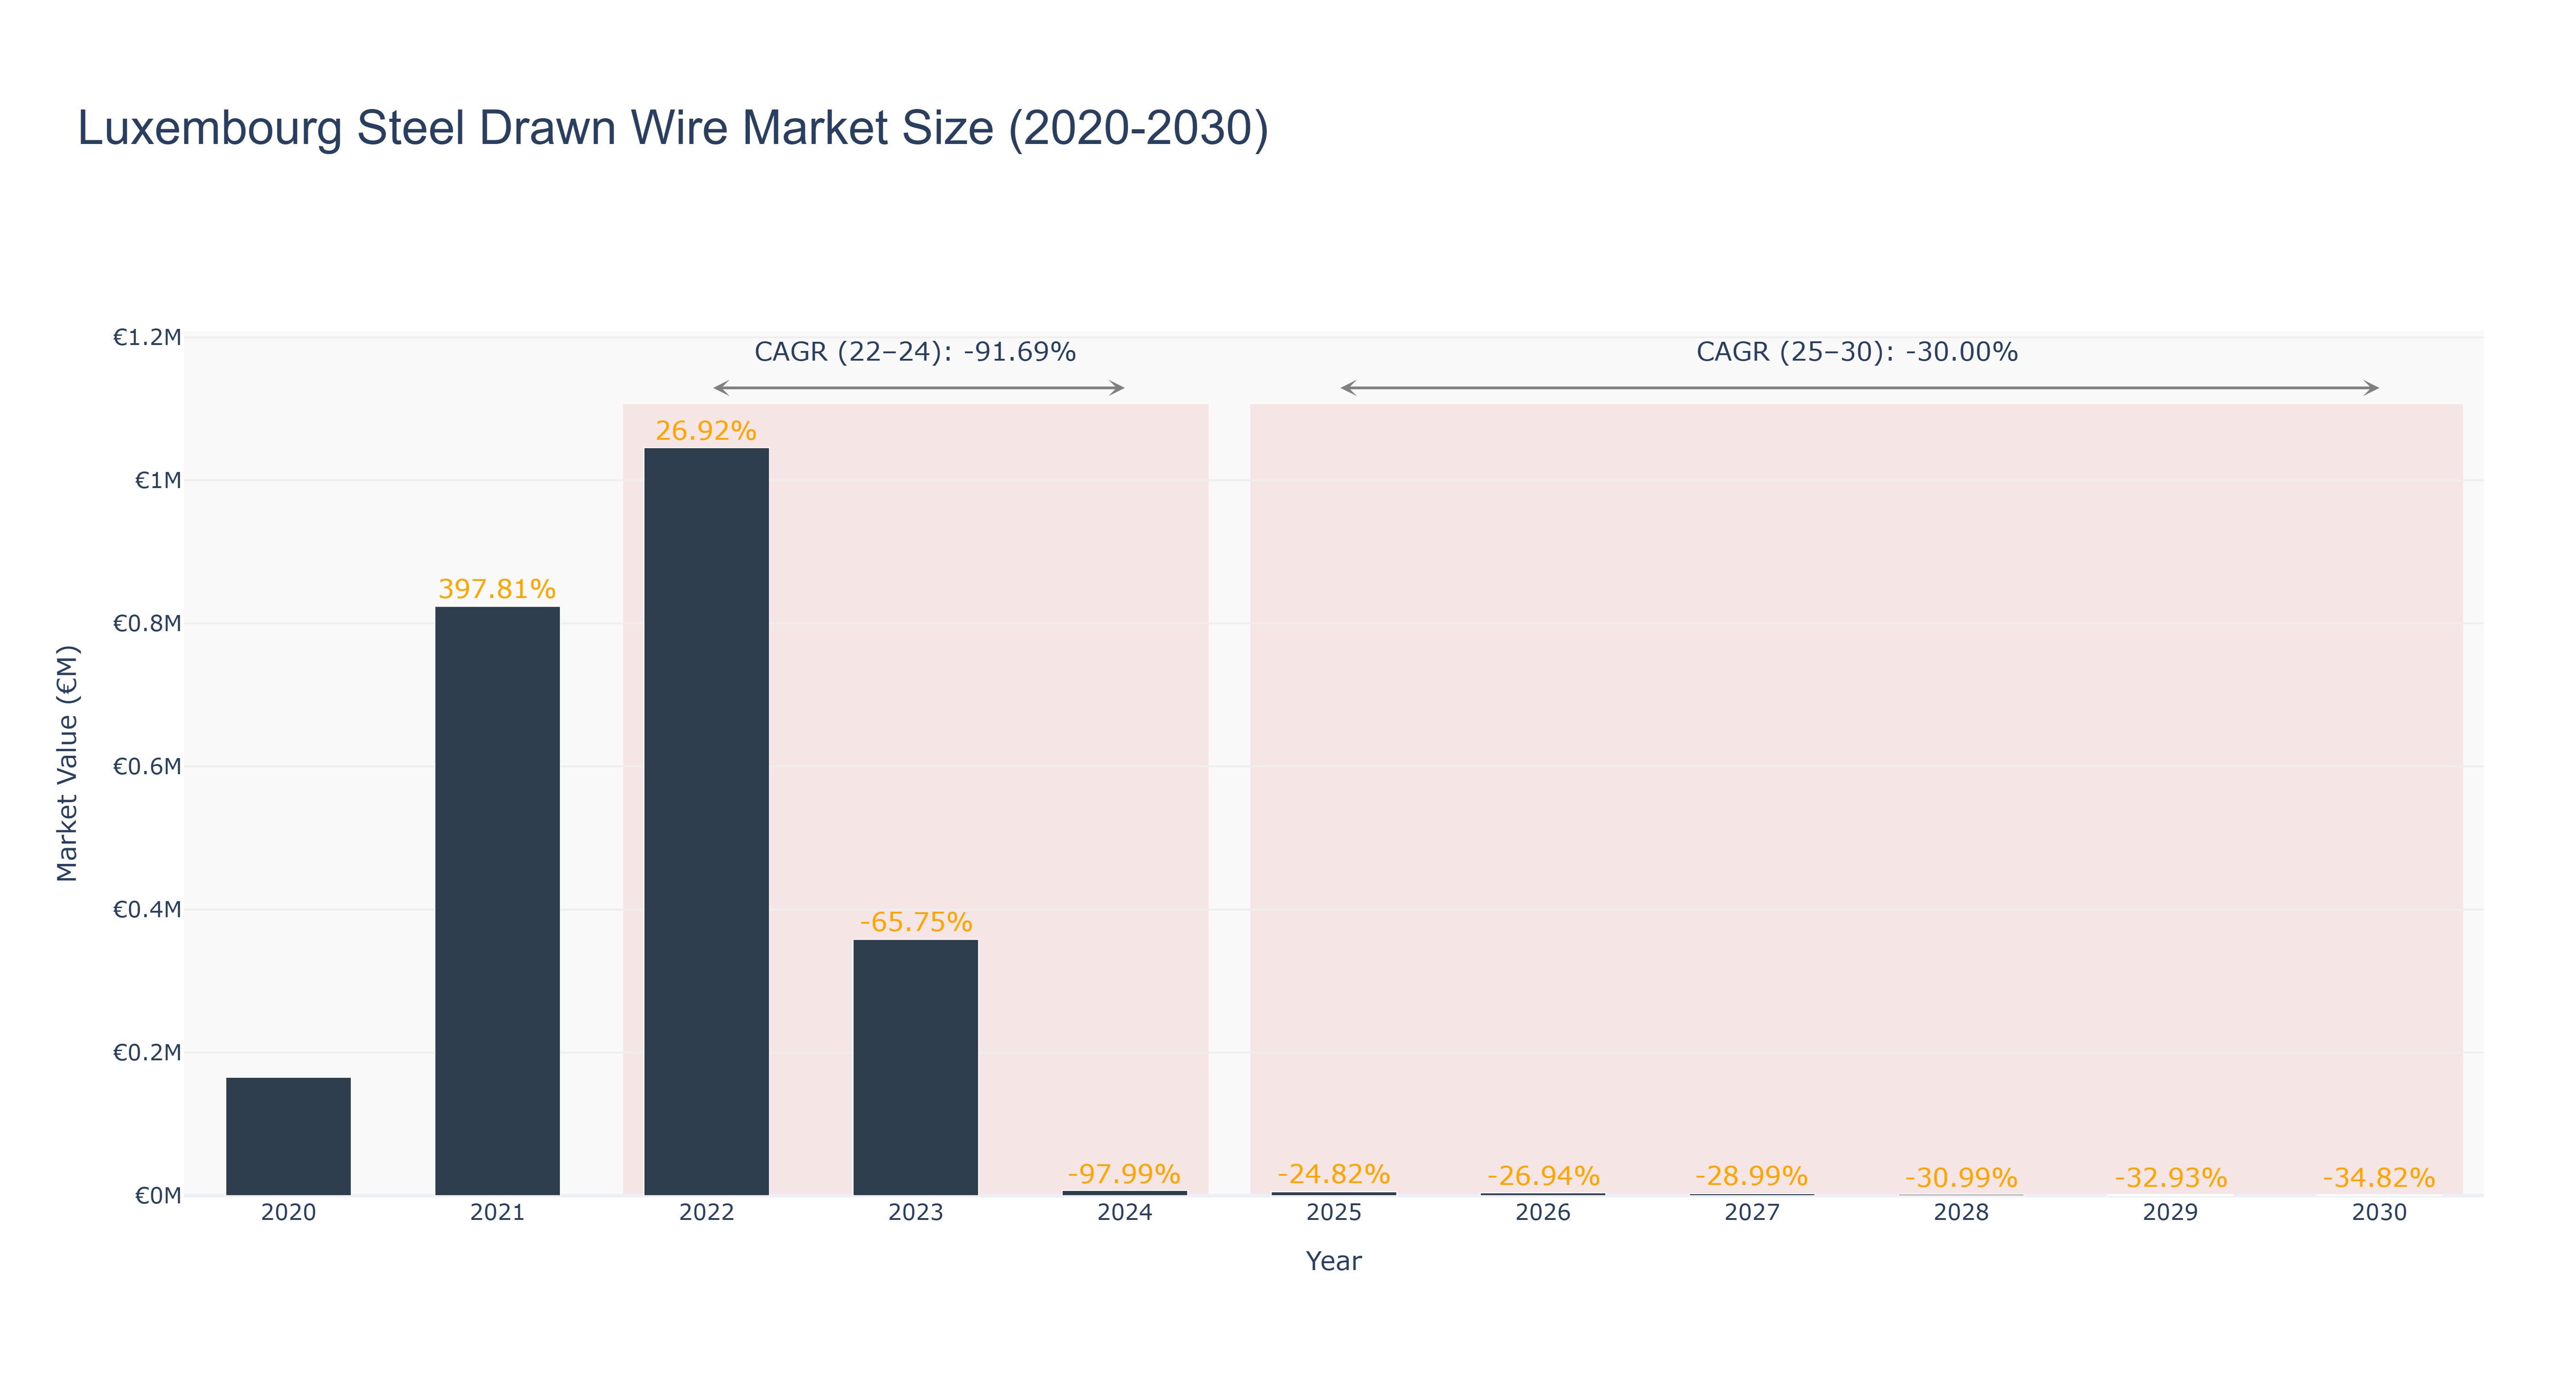
The Luxembourg Steel Drawn Wire Market has experienced significant volatility, characterized by a dramatic peak in 2021 with a market size of €823.76 thousand, following a modest €165.48 thousand in 2020. The actual market saw a decline to €358.14 thousand in 2023, and further plummeted to €7.22 thousand in 2024, resulting in a compound annual growth rate (CAGR) of -91.69% from 2022 to 2024. Looking ahead, the forecasted period from 2025 to 2030 anticipates continued contraction, with projected market sizes declining to €1.30 thousand by 2029, reflecting a CAGR of -30.00%. This downturn can be attributed to reduced demand in key sectors, increased competition from alternative materials, and potential supply chain disruptions. The future outlook remains uncertain, contingent upon broader economic conditions and potential investments in infrastructure that could stimulate demand for steel products.
Luxembourg Steel Drawn Wire Market: Production & Trade Performance (2019-2025)
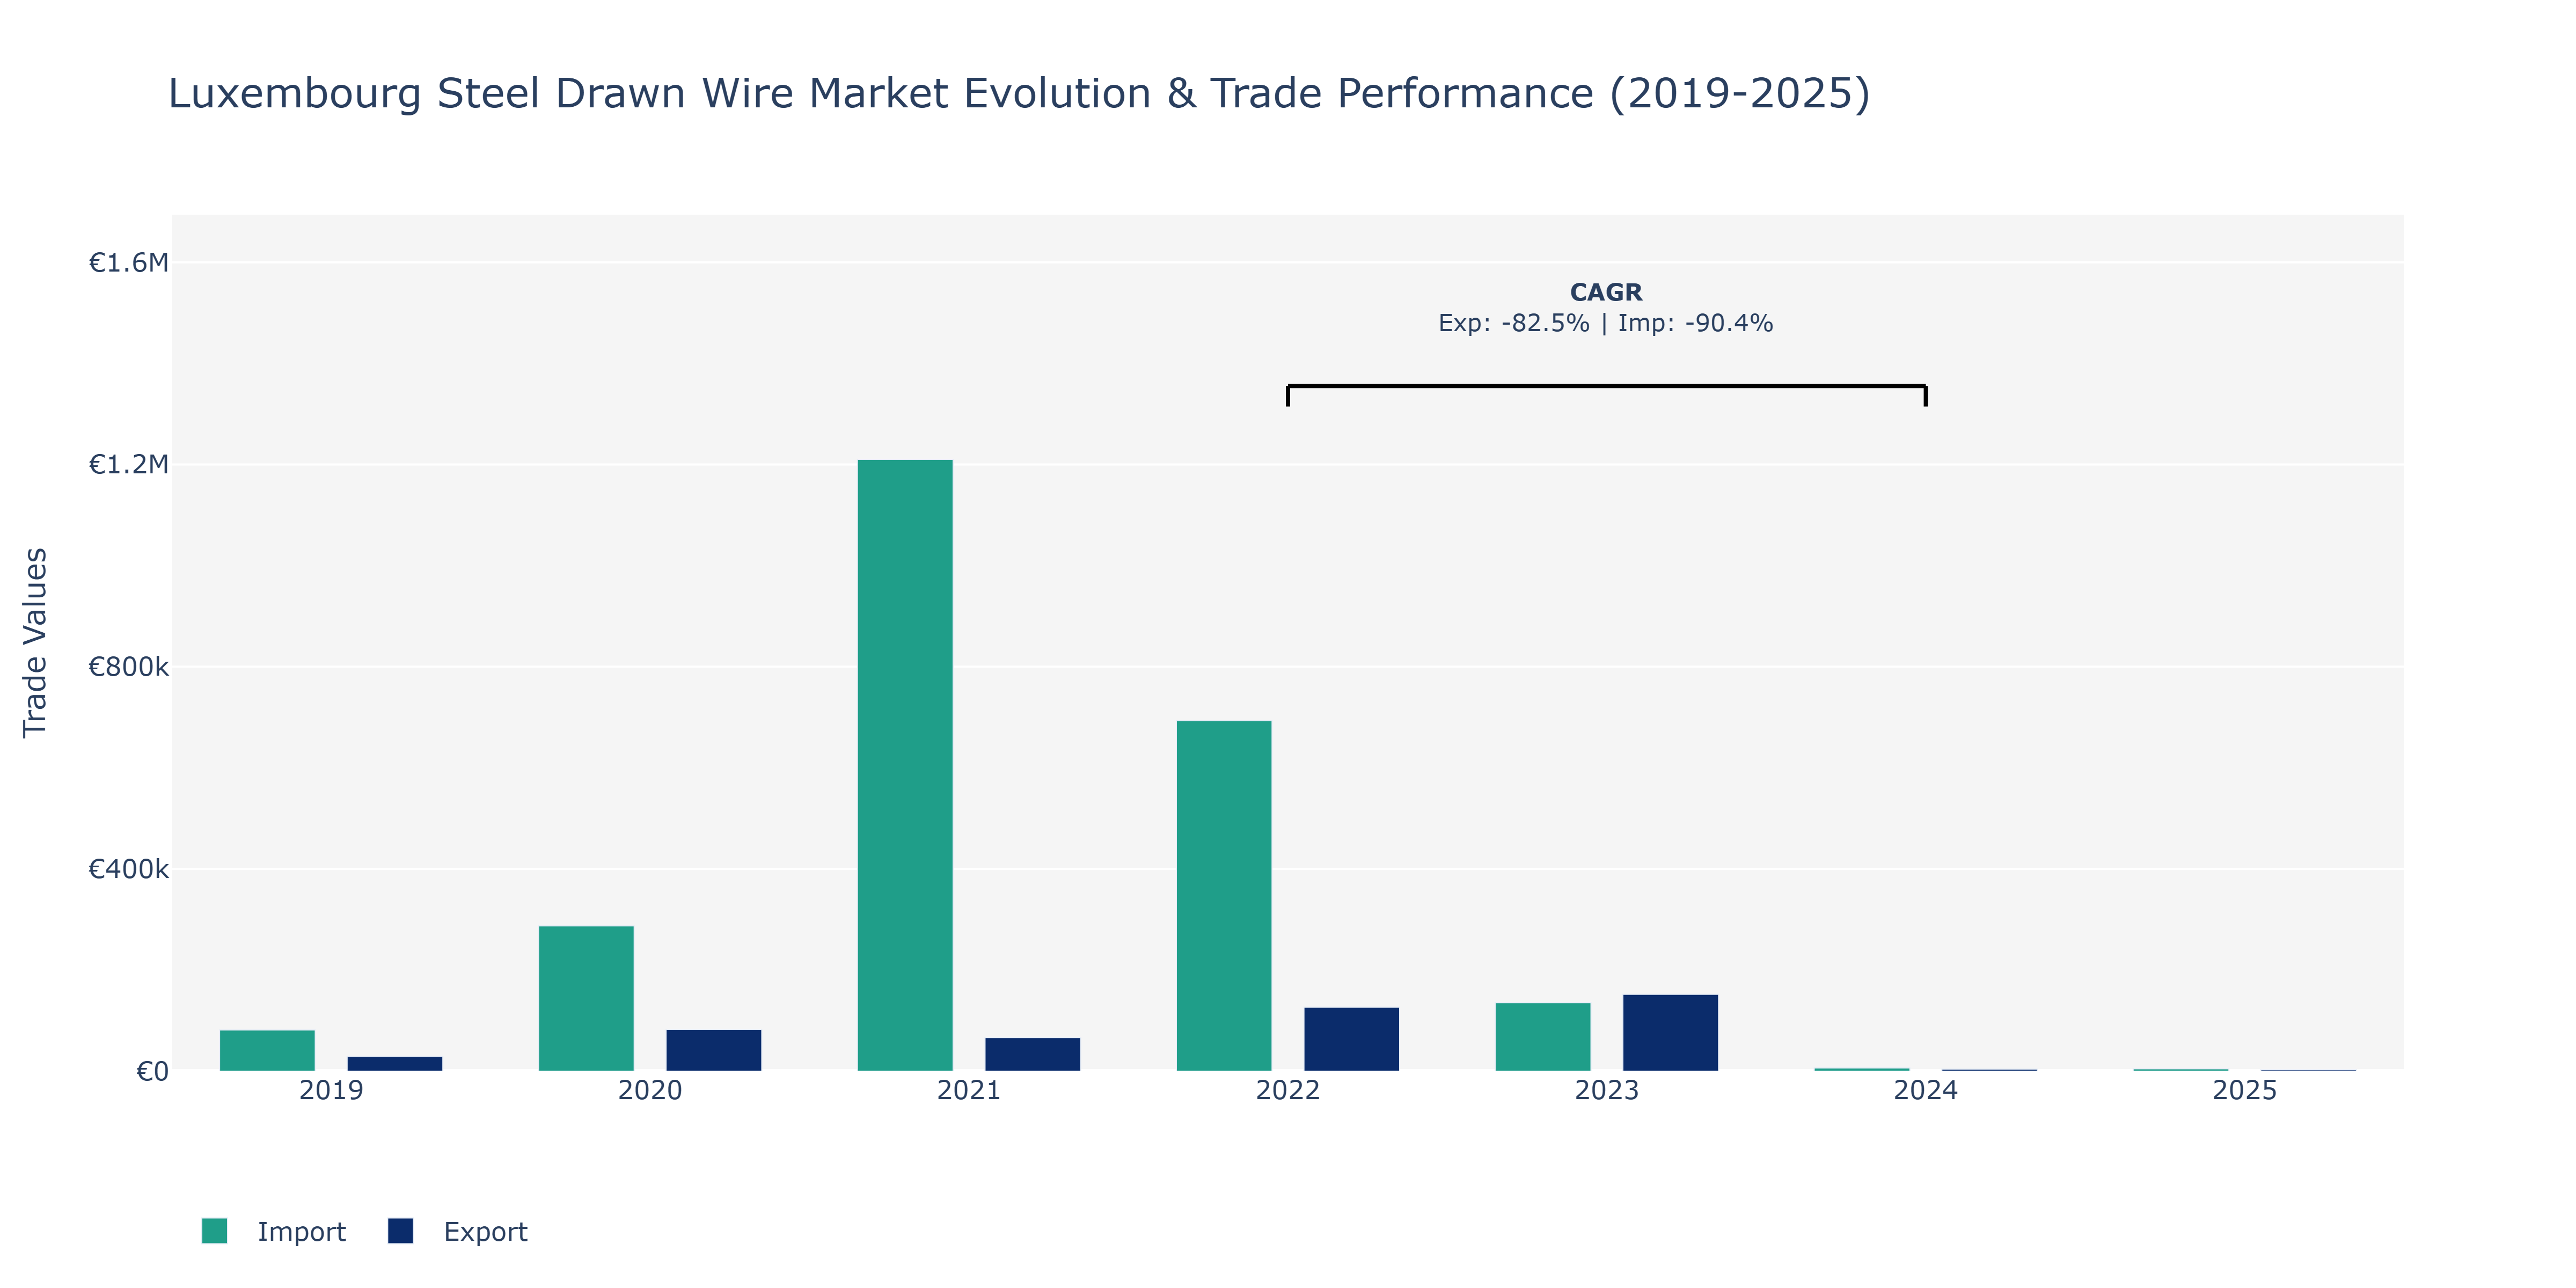
The Luxembourg Steel Drawn Wire Market witnessed fluctuations in both exports and imports from 2019 to 2025. In 2022, exports peaked at €126.53 thousand, showcasing a substantial increase from the previous year. This surge could be attributed to increased demand for steel drawn wire products in international markets, potentially driven by infrastructure development projects globally. Similarly, imports also peaked in 2021 at €1.21 million, indicating a significant rise in the need for raw materials or unique steel wire products in Luxembourg. The subsequent decline in 2024 for both exports and imports can be linked to global economic fluctuations impacting trade volumes. Notably, the sharp decrease in exports and imports in 2024 could be tied to the challenging economic conditions prevailing during that period, leading to reduced demand for steel drawn wire products. The market's resilience is evident in the recovery seen in 2025, albeit at lower levels, reflecting potential stabilization and gradual market growth post the economic downturn.
Key Highlights of the Report:
- Luxembourg Steel Drawn Wire Market Outlook
- Market Size of Luxembourg Steel Drawn Wire Market, 2025
- Forecast of Luxembourg Steel Drawn Wire Market, 2032
- Historical Data and Forecast of Luxembourg Steel Drawn Wire Revenues & Volume for the Period 2022-2032F
- Luxembourg Steel Drawn Wire Market Trend Evolution
- Luxembourg Steel Drawn Wire Market Drivers and Challenges
- Luxembourg Steel Drawn Wire Price Trends
- Luxembourg Steel Drawn Wire Porter's Five Forces
- Luxembourg Steel Drawn Wire Industry Life Cycle
- Historical Data and Forecast of Luxembourg Steel Drawn Wire Market Revenues & Volume By Product Type for the Period 2022-2032F
- Historical Data and Forecast of Luxembourg Steel Drawn Wire Market Revenues & Volume By Carbon Steel for the Period 2022-2032F
- Historical Data and Forecast of Luxembourg Steel Drawn Wire Market Revenues & Volume By Stainless Steel for the Period 2022-2032F
- Historical Data and Forecast of Luxembourg Steel Drawn Wire Market Revenues & Volume By Alloy Steel for the Period 2022-2032F
- Historical Data and Forecast of Luxembourg Steel Drawn Wire Market Revenues & Volume By Diameter for the Period 2022-2032F
- Historical Data and Forecast of Luxembourg Steel Drawn Wire Market Revenues & Volume By Up to 5 mm for the Period 2022-2032F
- Historical Data and Forecast of Luxembourg Steel Drawn Wire Market Revenues & Volume By 6-10 mm for the Period 2022-2032F
- Historical Data and Forecast of Luxembourg Steel Drawn Wire Market Revenues & Volume By 11-15 mm for the Period 2022-2032F
- Historical Data and Forecast of Luxembourg Steel Drawn Wire Market Revenues & Volume By 16-20 mm for the Period 2022-2032F
- Historical Data and Forecast of Luxembourg Steel Drawn Wire Market Revenues & Volume By Above 20 mm for the Period 2022-2032F
- Historical Data and Forecast of Luxembourg Steel Drawn Wire Market Revenues & Volume By End-user for the Period 2022-2032F
- Historical Data and Forecast of Luxembourg Steel Drawn Wire Market Revenues & Volume By Automotive for the Period 2022-2032F
- Historical Data and Forecast of Luxembourg Steel Drawn Wire Market Revenues & Volume By Construction for the Period 2022-2032F
- Historical Data and Forecast of Luxembourg Steel Drawn Wire Market Revenues & Volume By Military for the Period 2022-2032F
- Historical Data and Forecast of Luxembourg Steel Drawn Wire Market Revenues & Volume By Telecom for the Period 2022-2032F
- Historical Data and Forecast of Luxembourg Steel Drawn Wire Market Revenues & Volume By Power & Energy for the Period 2022-2032F
- Historical Data and Forecast of Luxembourg Steel Drawn Wire Market Revenues & Volume By Heavy Machinery for the Period 2022-2032F
- Historical Data and Forecast of Luxembourg Steel Drawn Wire Market Revenues & Volume By Others (Aviation, Agriculture, etc.) for the Period 2022-2032F
- Historical Data and Forecast of Luxembourg Steel Drawn Wire Market Revenues & Volume By Distribution Channel for the Period 2022-2032F
- Historical Data and Forecast of Luxembourg Steel Drawn Wire Market Revenues & Volume By Direct Sales for the Period 2022-2032F
- Historical Data and Forecast of Luxembourg Steel Drawn Wire Market Revenues & Volume By Indirect Sales for the Period 2022-2032F
- Luxembourg Steel Drawn Wire Import Export Trade Statistics
- Market Opportunity Assessment By Product Type
- Market Opportunity Assessment By Diameter
- Market Opportunity Assessment By End-user
- Market Opportunity Assessment By Distribution Channel
- Luxembourg Steel Drawn Wire Top Companies Market Share
- Luxembourg Steel Drawn Wire Competitive Benchmarking By Technical and Operational Parameters
- Luxembourg Steel Drawn Wire Company Profiles
- Luxembourg Steel Drawn Wire Key Strategic Recommendations
Frequently Asked Questions About the Market Study (FAQs):
6Wresearch actively monitors the Luxembourg Steel Drawn Wire Market and publishes its comprehensive annual report, highlighting emerging trends, growth drivers, revenue analysis, and forecast outlook. Our insights help businesses to make data-backed strategic decisions with ongoing market dynamics. Our analysts track relevent industries related to the Luxembourg Steel Drawn Wire Market, allowing our clients with actionable intelligence and reliable forecasts tailored to emerging regional needs.
Yes, we provide customisation as per your requirements. To learn more, feel free to contact us on sales@6wresearch.com
1 Executive Summary |
2 Introduction |
2.1 Key Highlights of the Report |
2.2 Report Description |
2.3 Market Scope & Segmentation |
2.4 Research Methodology |
2.5 Assumptions |
3 Luxembourg Steel Drawn Wire Market Overview |
3.1 Luxembourg Country Macro Economic Indicators |
3.2 Luxembourg Steel Drawn Wire Market Revenues & Volume, 2022 & 2032F |
3.3 Luxembourg Steel Drawn Wire Market - Industry Life Cycle |
3.4 Luxembourg Steel Drawn Wire Market - Porter's Five Forces |
3.5 Luxembourg Steel Drawn Wire Market Revenues & Volume Share, By Product Type, 2022 & 2032F |
3.6 Luxembourg Steel Drawn Wire Market Revenues & Volume Share, By Diameter, 2022 & 2032F |
3.7 Luxembourg Steel Drawn Wire Market Revenues & Volume Share, By End-user, 2022 & 2032F |
3.8 Luxembourg Steel Drawn Wire Market Revenues & Volume Share, By Distribution Channel, 2022 & 2032F |
4 Luxembourg Steel Drawn Wire Market Dynamics |
4.1 Impact Analysis |
4.2 Market Drivers |
4.2.1 Increasing demand for steel drawn wire in various industries such as construction, automotive, and manufacturing. |
4.2.2 Growing infrastructure development projects in Luxembourg and neighboring regions. |
4.2.3 Technological advancements leading to the development of high-quality steel drawn wire products. |
4.3 Market Restraints |
4.3.1 Fluctuating raw material prices impacting the production cost of steel drawn wire. |
4.3.2 Economic uncertainty affecting investment decisions and overall market demand. |
4.3.3 Competition from alternative materials like aluminum and synthetic fibers. |
5 Luxembourg Steel Drawn Wire Market Trends |
6 Luxembourg Steel Drawn Wire Market, By Types |
6.1 Luxembourg Steel Drawn Wire Market, By Product Type |
6.1.1 Overview and Analysis |
6.1.2 Luxembourg Steel Drawn Wire Market Revenues & Volume, By Product Type, 2022-2032F |
6.1.3 Luxembourg Steel Drawn Wire Market Revenues & Volume, By Carbon Steel, 2022-2032F |
6.1.4 Luxembourg Steel Drawn Wire Market Revenues & Volume, By Stainless Steel, 2022-2032F |
6.1.5 Luxembourg Steel Drawn Wire Market Revenues & Volume, By Alloy Steel, 2022-2032F |
6.2 Luxembourg Steel Drawn Wire Market, By Diameter |
6.2.1 Overview and Analysis |
6.2.2 Luxembourg Steel Drawn Wire Market Revenues & Volume, By Up to 5 mm, 2022-2032F |
6.2.3 Luxembourg Steel Drawn Wire Market Revenues & Volume, By 6-10 mm, 2022-2032F |
6.2.4 Luxembourg Steel Drawn Wire Market Revenues & Volume, By 11-15 mm, 2022-2032F |
6.2.5 Luxembourg Steel Drawn Wire Market Revenues & Volume, By 16-20 mm, 2022-2032F |
6.2.6 Luxembourg Steel Drawn Wire Market Revenues & Volume, By Above 20 mm, 2022-2032F |
6.3 Luxembourg Steel Drawn Wire Market, By End-user |
6.3.1 Overview and Analysis |
6.3.2 Luxembourg Steel Drawn Wire Market Revenues & Volume, By Automotive, 2022-2032F |
6.3.3 Luxembourg Steel Drawn Wire Market Revenues & Volume, By Construction, 2022-2032F |
6.3.4 Luxembourg Steel Drawn Wire Market Revenues & Volume, By Military, 2022-2032F |
6.3.5 Luxembourg Steel Drawn Wire Market Revenues & Volume, By Telecom, 2022-2032F |
6.3.6 Luxembourg Steel Drawn Wire Market Revenues & Volume, By Power & Energy, 2022-2032F |
6.3.7 Luxembourg Steel Drawn Wire Market Revenues & Volume, By Heavy Machinery, 2022-2032F |
6.4 Luxembourg Steel Drawn Wire Market, By Distribution Channel |
6.4.1 Overview and Analysis |
6.4.2 Luxembourg Steel Drawn Wire Market Revenues & Volume, By Direct Sales, 2022-2032F |
6.4.3 Luxembourg Steel Drawn Wire Market Revenues & Volume, By Indirect Sales, 2022-2032F |
7 Luxembourg Steel Drawn Wire Market Import-Export Trade Statistics |
7.1 Luxembourg Steel Drawn Wire Market Export to Major Countries |
7.2 Luxembourg Steel Drawn Wire Market Imports from Major Countries |
8 Luxembourg Steel Drawn Wire Market Key Performance Indicators |
8.1 Average selling price of steel drawn wire products. |
8.2 Rate of adoption of advanced manufacturing technologies in the production process. |
8.3 Percentage of market share held by Luxembourg steel drawn wire manufacturers. |
8.4 Customer satisfaction levels and retention rates for steel drawn wire products. |
8.5 Percentage of sales generated from new product developments and innovations in the market. |
9 Luxembourg Steel Drawn Wire Market - Opportunity Assessment |
9.1 Luxembourg Steel Drawn Wire Market Opportunity Assessment, By Product Type, 2022 & 2032F |
9.2 Luxembourg Steel Drawn Wire Market Opportunity Assessment, By Diameter, 2022 & 2032F |
9.3 Luxembourg Steel Drawn Wire Market Opportunity Assessment, By End-user, 2022 & 2032F |
9.4 Luxembourg Steel Drawn Wire Market Opportunity Assessment, By Distribution Channel, 2022 & 2032F |
10 Luxembourg Steel Drawn Wire Market - Competitive Landscape |
10.1 Luxembourg Steel Drawn Wire Market Revenue Share, By Companies, 2025 |
10.2 Luxembourg Steel Drawn Wire Market Competitive Benchmarking, By Operating and Technical Parameters |
11 Company Profiles |
12 Recommendations |
13 Disclaimer |
Global Go To Market Strategy - 2030
Export potential enables firms to identify high-growth global markets with greater confidence by combining advanced trade intelligence with a structured quantitative methodology. The framework analyzes emerging demand trends and country-level import patterns while integrating macroeconomic and trade datasets such as GDP and population forecasts, bilateral import–export flows, tariff structures, elasticity differentials between developed and developing economies, geographic distance, and import demand projections. Using weighted trade values from 2020–2024 as the base period to project country-to-country export potential for 2030, these inputs are operationalized through calculated drivers such as gravity model parameters, tariff impact factors, and projected GDP per-capita growth. Through an analysis of hidden potentials, demand hotspots, and market conditions that are most favorable to success, this method enables firms to focus on target countries, maximize returns, and global expansion with data, backed by accuracy.
By factoring in the projected importer demand gap that is currently unmet and could be potential opportunity, it identifies the potential for the Exporter (Country) among 190 countries, against the general trade analysis, which identifies the biggest importer or exporter.
To discover high-growth global markets and optimize your business strategy:
Click Here
Pricing
- Single User License$ 1,995
- Department License$ 2,400
- Site License$ 3,120
- Global License$ 3,795

Leadership Perspectives from Industry Events
Search
Thought Leadership and Analyst Meet


Our Clients
6WResearch In News
- India Export Attractiveness Tracker 2026
- India Air Conditioner Market Set for Strong Rebound in 2026 After Weather-Led Correction and GST-Driven Recovery: 6Wresearch
- ADAS in India: How Automatic Emergency Braking, Blind Spot Detection & Driver Monitoring are Transforming Road Safety
- Doha a strategic location for EV manufacturing hub: IPA Qatar
- Demand for luxury TVs surging in the GCC, says Samsung
- Empowering Growth: The Thriving Journey of Bangladesh’s Cable Industry
Latest Reports
- Nicaragua RPG Gaming Market (2026-2032)
- New Zealand RPG Gaming Market (2026-2032)
- Netherlands RPG Gaming Market (2026-2032)
- Nauru RPG Gaming Market (2026-2032)
- Namibia RPG Gaming Market (2026-2032)
- Mozambique RPG Gaming Market (2026-2032)
- Montenegro RPG Gaming Market (2026-2032)
- Mongolia RPG Gaming Market (2026-2032)
- Monaco RPG Gaming Market (2026-2032)
- Micronesia RPG Gaming Market (2026-2032)
Industry Events and Analyst Meet

EV India Expo 2026

HIMTEX 2026

India Refining Summit 2026

India EV Show 2026

EV tech India Expo 2026
Whitepaper
- Middle East & Africa Commercial Security Market Click here to view more.
- Middle East & Africa Fire Safety Systems & Equipment Market Click here to view more.
- GCC Drone Market Click here to view more.
- Middle East Lighting Fixture Market Click here to view more.
- GCC Physical & Perimeter Security Market Click here to view more.