Maldives Grab and Go Container Market (2026-2032) | Competitive Landscape, Companies, Analysis, Growth, Industry, Outlook, Trends, Share, Value, Forecast, Size & Revenue, Segmentation
Market Forecast By Product (Cups, Bowls, Cans, Trays, Bottles, Deli Containers), By Material (Plastic, PET, PE, PVC, Paper, Others), By End Use (B2B, Food Service Outlets, Educational Institutes, Corporate Offices, Healthcare Facilities, B2C (Retail), E-commerce, Supermarket) And Competitive Landscape
| Product Code: ETC8150189 | Publication Date: Sep 2024 | Updated Date: Apr 2026 | Product Type: Market Research Report | |
| Publisher: 6Wresearch | Author: Dhaval Chaurasia | No. of Pages: 75 | No. of Figures: 35 | No. of Tables: 20 |
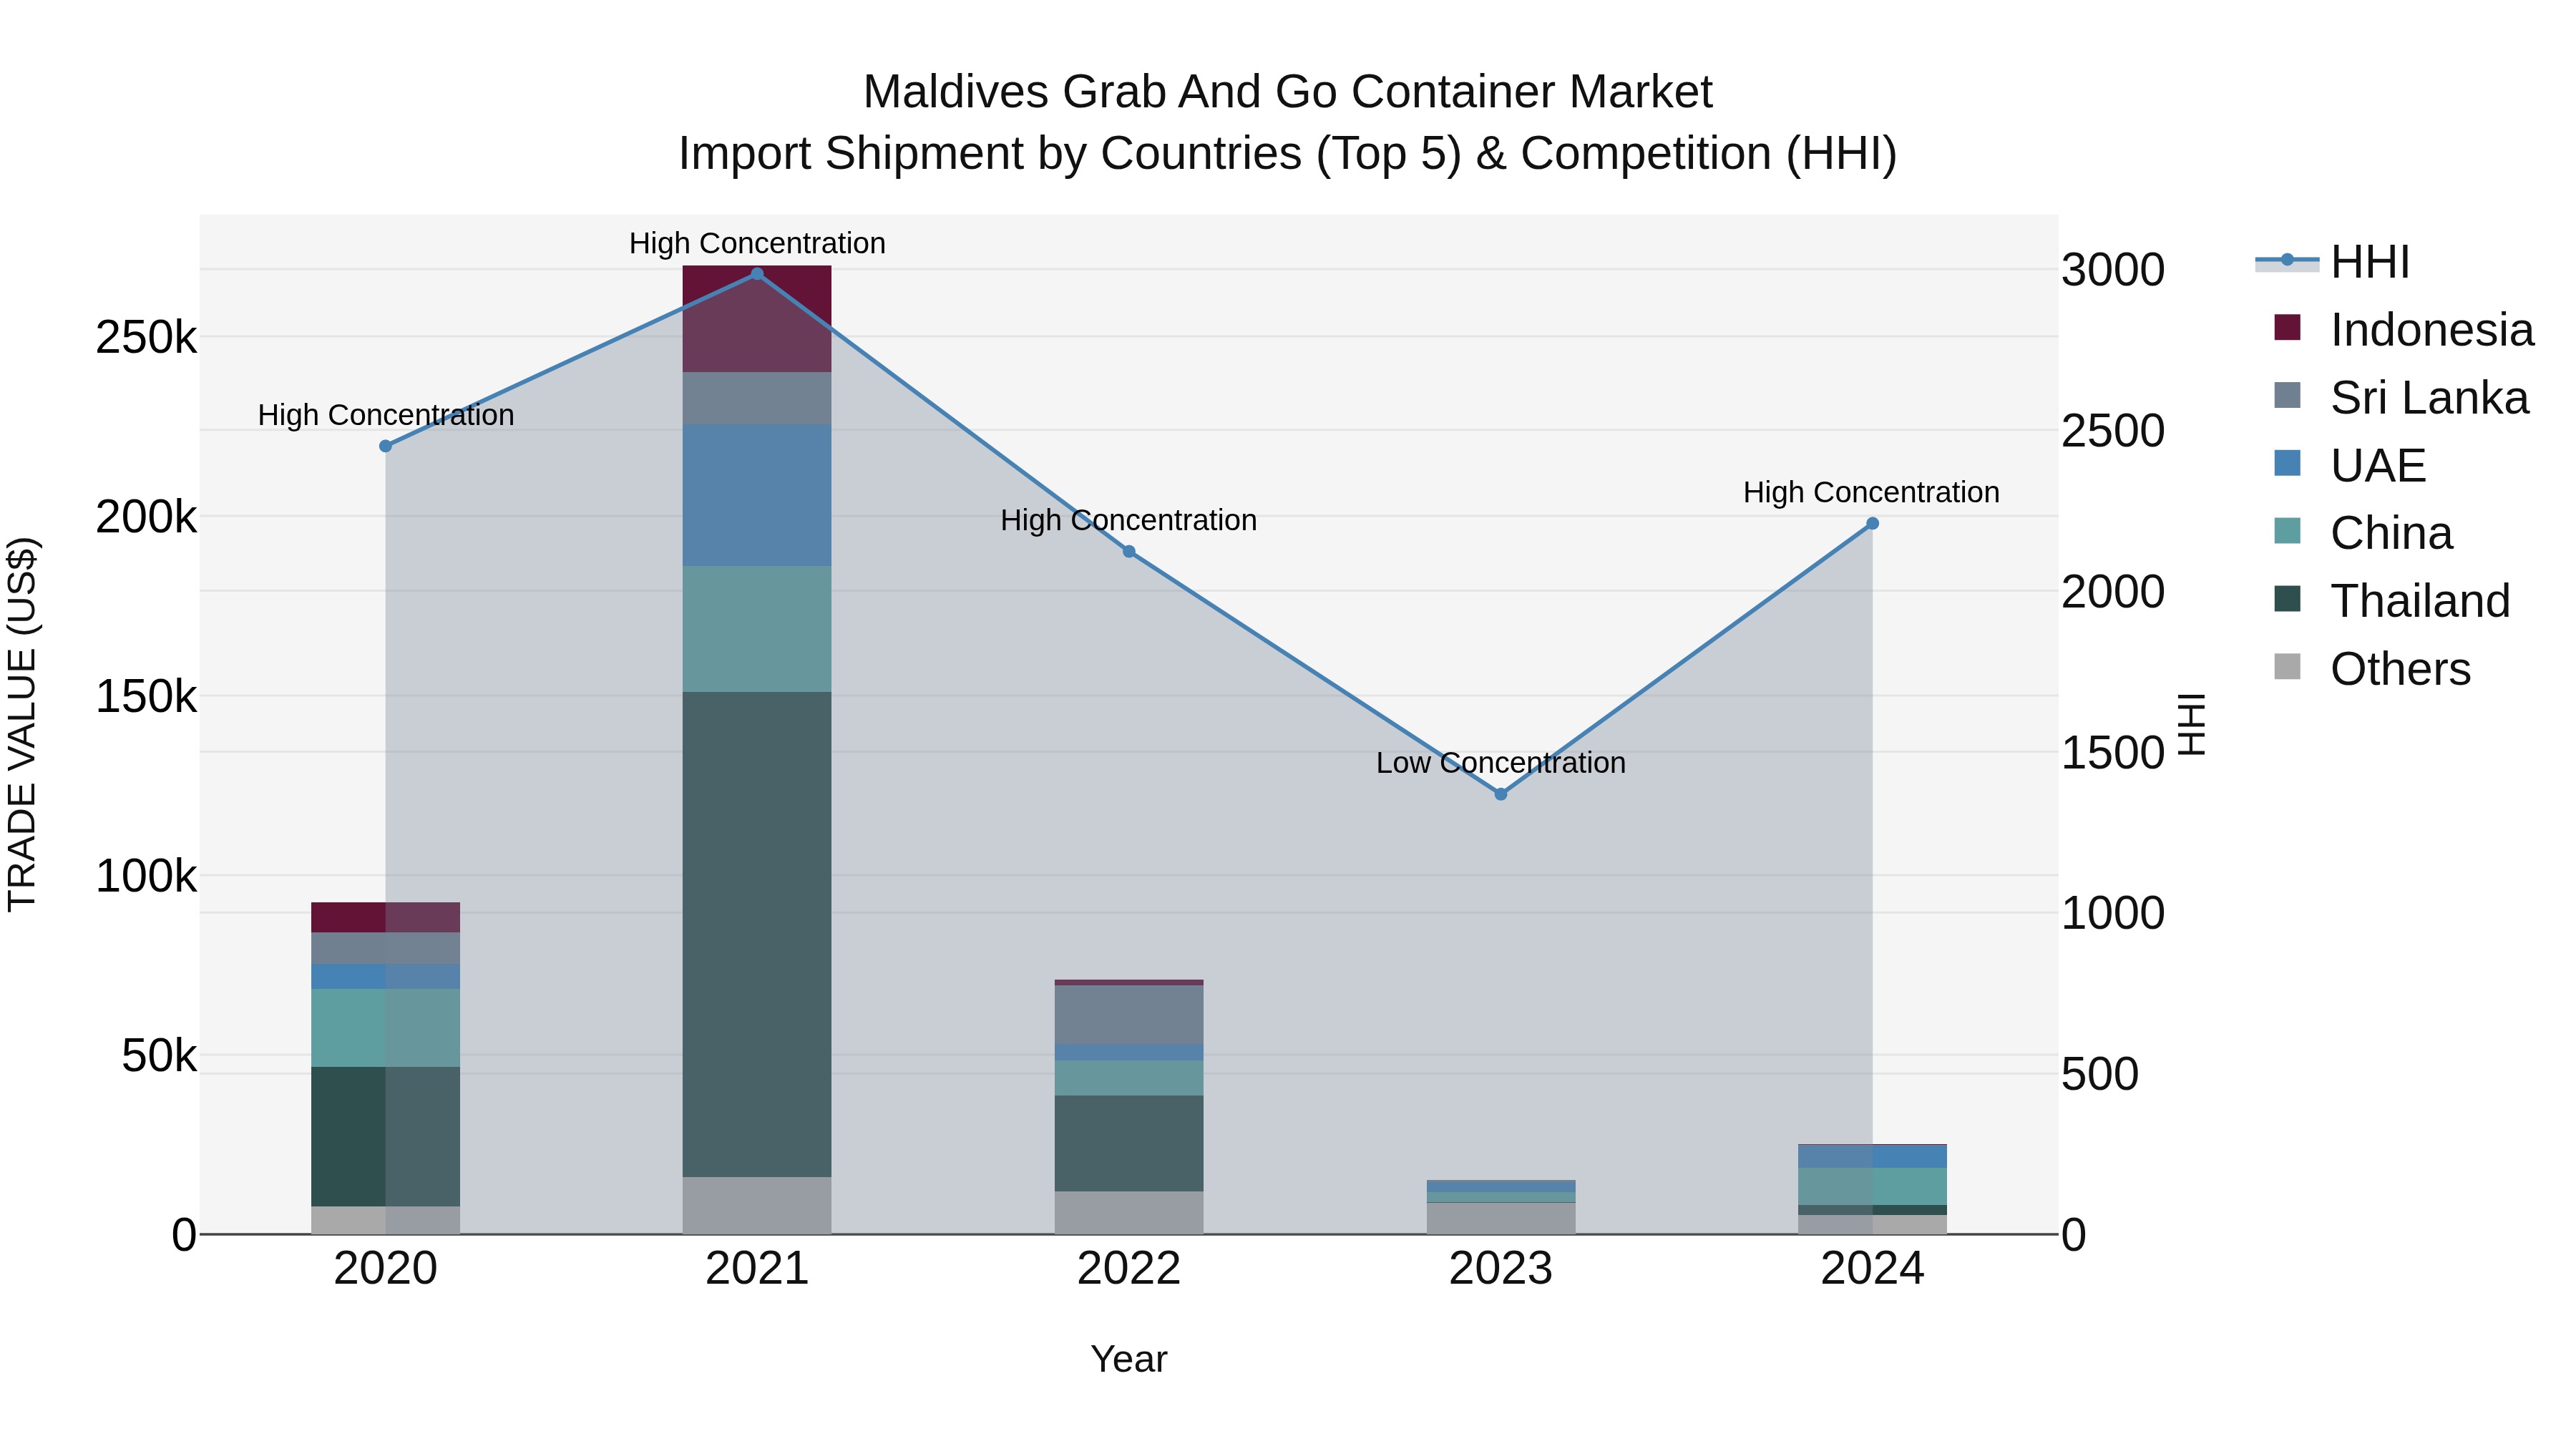
Maldives Grab and Go Container Market Top 5 Importing Countries and Market Competition (HHI) Analysis
The Maldives` grab-and-go container import market saw a significant shift in 2024, with top exporting countries including China, UAE, Malaysia, Thailand, and India. The market concentration, as measured by the HHI, increased from moderate to high levels, indicating a heightened level of supplier concentration. Despite a negative CAGR from 2020 to 2024, the market experienced a remarkable growth rate of 66.5% from 2023 to 2024. This trend suggests a dynamic and evolving import market landscape in the Maldives, with key players driving substantial growth and competition.
Key Highlights of the Report:
- Maldives Grab and Go Container Market Outlook
- Market Size of Maldives Grab and Go Container Market, 2025
- Forecast of Maldives Grab and Go Container Market, 2032
- Historical Data and Forecast of Maldives Grab and Go Container Revenues & Volume for the Period 2022 - 2032
- Maldives Grab and Go Container Market Trend Evolution
- Maldives Grab and Go Container Market Drivers and Challenges
- Maldives Grab and Go Container Price Trends
- Maldives Grab and Go Container Porter's Five Forces
- Maldives Grab and Go Container Industry Life Cycle
- Historical Data and Forecast of Maldives Grab and Go Container Market Revenues & Volume By Product for the Period 2022 - 2032
- Historical Data and Forecast of Maldives Grab and Go Container Market Revenues & Volume By Cups for the Period 2022 - 2032
- Historical Data and Forecast of Maldives Grab and Go Container Market Revenues & Volume By Bowls for the Period 2022 - 2032
- Historical Data and Forecast of Maldives Grab and Go Container Market Revenues & Volume By Cans for the Period 2022 - 2032
- Historical Data and Forecast of Maldives Grab and Go Container Market Revenues & Volume By Trays for the Period 2022 - 2032
- Historical Data and Forecast of Maldives Grab and Go Container Market Revenues & Volume By Bottles for the Period 2022 - 2032
- Historical Data and Forecast of Maldives Grab and Go Container Market Revenues & Volume By Deli Containers for the Period 2022 - 2032
- Historical Data and Forecast of Maldives Grab and Go Container Market Revenues & Volume By Material for the Period 2022 - 2032
- Historical Data and Forecast of Maldives Grab and Go Container Market Revenues & Volume By Plastic for the Period 2022 - 2032
- Historical Data and Forecast of Maldives Grab and Go Container Market Revenues & Volume By PET for the Period 2022 - 2032
- Historical Data and Forecast of Maldives Grab and Go Container Market Revenues & Volume By PE for the Period 2022 - 2032
- Historical Data and Forecast of Maldives Grab and Go Container Market Revenues & Volume By PVC for the Period 2022 - 2032
- Historical Data and Forecast of Maldives Grab and Go Container Market Revenues & Volume By Paper for the Period 2022 - 2032
- Historical Data and Forecast of Maldives Grab and Go Container Market Revenues & Volume By Others for the Period 2022 - 2032
- Historical Data and Forecast of Maldives Grab and Go Container Market Revenues & Volume By End Use for the Period 2022 - 2032
- Historical Data and Forecast of Maldives Grab and Go Container Market Revenues & Volume By B2B for the Period 2022 - 2032
- Historical Data and Forecast of Maldives Grab and Go Container Market Revenues & Volume By Food Service Outlets for the Period 2022 - 2032
- Historical Data and Forecast of Maldives Grab and Go Container Market Revenues & Volume By Educational Institutes for the Period 2022 - 2032
- Historical Data and Forecast of Maldives Grab and Go Container Market Revenues & Volume By Corporate Offices for the Period 2022 - 2032
- Historical Data and Forecast of Maldives Grab and Go Container Market Revenues & Volume By Healthcare Facilities for the Period 2022 - 2032
- Historical Data and Forecast of Maldives Grab and Go Container Market Revenues & Volume By B2C (Retail) for the Period 2022 - 2032
- Historical Data and Forecast of Maldives Grab and Go Container Market Revenues & Volume By E-commerce for the Period 2022 - 2032
- Historical Data and Forecast of Maldives Grab and Go Container Market Revenues & Volume By Supermarket for the Period 2022 - 2032
- Maldives Grab and Go Container Import Export Trade Statistics
- Market Opportunity Assessment By Product
- Market Opportunity Assessment By Material
- Market Opportunity Assessment By End Use
- Maldives Grab and Go Container Top Companies Market Share
- Maldives Grab and Go Container Competitive Benchmarking By Technical and Operational Parameters
- Maldives Grab and Go Container Company Profiles
- Maldives Grab and Go Container Key Strategic Recommendations
Frequently Asked Questions About the Market Study (FAQs):
6Wresearch actively monitors the Maldives Grab and Go Container Market and publishes its comprehensive annual report, highlighting emerging trends, growth drivers, revenue analysis, and forecast outlook. Our insights help businesses to make data-backed strategic decisions with ongoing market dynamics. Our analysts track relevent industries related to the Maldives Grab and Go Container Market, allowing our clients with actionable intelligence and reliable forecasts tailored to emerging regional needs.
Yes, we provide customisation as per your requirements. To learn more, feel free to contact us on sales@6wresearch.com
1 Executive Summary |
2 Introduction |
2.1 Key Highlights of the Report |
2.2 Report Description |
2.3 Market Scope & Segmentation |
2.4 Research Methodology |
2.5 Assumptions |
3 Maldives Grab and Go Container Market Overview |
3.1 Maldives Country Macro Economic Indicators |
3.2 Maldives Grab and Go Container Market Revenues & Volume, 2022 & 2032F |
3.3 Maldives Grab and Go Container Market - Industry Life Cycle |
3.4 Maldives Grab and Go Container Market - Porter's Five Forces |
3.5 Maldives Grab and Go Container Market Revenues & Volume Share, By Product, 2022 & 2032F |
3.6 Maldives Grab and Go Container Market Revenues & Volume Share, By Material, 2022 & 2032F |
3.7 Maldives Grab and Go Container Market Revenues & Volume Share, By End Use, 2022 & 2032F |
4 Maldives Grab and Go Container Market Dynamics |
4.1 Impact Analysis |
4.2 Market Drivers |
4.2.1 Increasing consumer demand for convenient and ready-to-eat food options |
4.2.2 Growth in urbanization leading to busy lifestyles and increased reliance on on-the-go meals |
4.2.3 Rising tourism in the Maldives driving the need for quick and portable food solutions |
4.3 Market Restraints |
4.3.1 Limited availability of suitable grab-and-go packaging options in the market |
4.3.2 High competition among existing players in the grab-and-go container segment |
5 Maldives Grab and Go Container Market Trends |
6 Maldives Grab and Go Container Market, By Types |
6.1 Maldives Grab and Go Container Market, By Product |
6.1.1 Overview and Analysis |
6.1.2 Maldives Grab and Go Container Market Revenues & Volume, By Product, 2022 - 2032F |
6.1.3 Maldives Grab and Go Container Market Revenues & Volume, By Cups, 2022 - 2032F |
6.1.4 Maldives Grab and Go Container Market Revenues & Volume, By Bowls, 2022 - 2032F |
6.1.5 Maldives Grab and Go Container Market Revenues & Volume, By Cans, 2022 - 2032F |
6.1.6 Maldives Grab and Go Container Market Revenues & Volume, By Trays, 2022 - 2032F |
6.1.7 Maldives Grab and Go Container Market Revenues & Volume, By Bottles, 2022 - 2032F |
6.1.8 Maldives Grab and Go Container Market Revenues & Volume, By Deli Containers, 2022 - 2032F |
6.2 Maldives Grab and Go Container Market, By Material |
6.2.1 Overview and Analysis |
6.2.2 Maldives Grab and Go Container Market Revenues & Volume, By Plastic, 2022 - 2032F |
6.2.3 Maldives Grab and Go Container Market Revenues & Volume, By PET, 2022 - 2032F |
6.2.4 Maldives Grab and Go Container Market Revenues & Volume, By PE, 2022 - 2032F |
6.2.5 Maldives Grab and Go Container Market Revenues & Volume, By PVC, 2022 - 2032F |
6.2.6 Maldives Grab and Go Container Market Revenues & Volume, By Paper, 2022 - 2032F |
6.2.7 Maldives Grab and Go Container Market Revenues & Volume, By Others, 2022 - 2032F |
6.3 Maldives Grab and Go Container Market, By End Use |
6.3.1 Overview and Analysis |
6.3.2 Maldives Grab and Go Container Market Revenues & Volume, By B2B, 2022 - 2032F |
6.3.3 Maldives Grab and Go Container Market Revenues & Volume, By Food Service Outlets, 2022 - 2032F |
6.3.4 Maldives Grab and Go Container Market Revenues & Volume, By Educational Institutes, 2022 - 2032F |
6.3.5 Maldives Grab and Go Container Market Revenues & Volume, By Corporate Offices, 2022 - 2032F |
6.3.6 Maldives Grab and Go Container Market Revenues & Volume, By Healthcare Facilities, 2022 - 2032F |
6.3.7 Maldives Grab and Go Container Market Revenues & Volume, By B2C (Retail), 2022 - 2032F |
6.3.8 Maldives Grab and Go Container Market Revenues & Volume, By Supermarket, 2022 - 2032F |
6.3.9 Maldives Grab and Go Container Market Revenues & Volume, By Supermarket, 2022 - 2032F |
7 Maldives Grab and Go Container Market Import-Export Trade Statistics |
7.1 Maldives Grab and Go Container Market Export to Major Countries |
7.2 Maldives Grab and Go Container Market Imports from Major Countries |
8 Maldives Grab and Go Container Market Key Performance Indicators |
8.1 Average time taken to prepare a meal using grab-and-go containers |
8.2 Percentage increase in the number of grab-and-go container purchases per capita |
8.3 Customer satisfaction ratings for grab-and-go container convenience and usability |
9 Maldives Grab and Go Container Market - Opportunity Assessment |
9.1 Maldives Grab and Go Container Market Opportunity Assessment, By Product, 2022 & 2032F |
9.2 Maldives Grab and Go Container Market Opportunity Assessment, By Material, 2022 & 2032F |
9.3 Maldives Grab and Go Container Market Opportunity Assessment, By End Use, 2022 & 2032F |
10 Maldives Grab and Go Container Market - Competitive Landscape |
10.1 Maldives Grab and Go Container Market Revenue Share, By Companies, 2025 |
10.2 Maldives Grab and Go Container Market Competitive Benchmarking, By Operating and Technical Parameters |
11 Company Profiles |
12 Recommendations |
13 Disclaimer |
Export potential assessment - trade Analytics for 2030
Export potential enables firms to identify high-growth global markets with greater confidence by combining advanced trade intelligence with a structured quantitative methodology. The framework analyzes emerging demand trends and country-level import patterns while integrating macroeconomic and trade datasets such as GDP and population forecasts, bilateral import–export flows, tariff structures, elasticity differentials between developed and developing economies, geographic distance, and import demand projections. Using weighted trade values from 2020–2024 as the base period to project country-to-country export potential for 2030, these inputs are operationalized through calculated drivers such as gravity model parameters, tariff impact factors, and projected GDP per-capita growth. Through an analysis of hidden potentials, demand hotspots, and market conditions that are most favorable to success, this method enables firms to focus on target countries, maximize returns, and global expansion with data, backed by accuracy.
By factoring in the projected importer demand gap that is currently unmet and could be potential opportunity, it identifies the potential for the Exporter (Country) among 190 countries, against the general trade analysis, which identifies the biggest importer or exporter.
To discover high-growth global markets and optimize your business strategy:
Click Here
Pricing
- Single User License$ 1,995
- Department License$ 2,400
- Site License$ 3,120
- Global License$ 3,795

Search
Thought Leadership and Analyst Meet


Our Clients
Latest Reports
- India Ultrasonic Smart Water Meter Market (2026-2032) | Outlook, Competition, Drivers, Trends, Demand, Competitive, Strategic Insights, Companies, Challenges, Strategy, Consumer Insights, Analysis, Opportunities, Growth, Size, Share, Industry, Revenue, Segments, Value, Segmentation, Supply, Forecast, Restraints,
- India Electromagnetic Bulk Flow Meter Market (2026-2032) | Analysis, Challenges, Strategic Insights, Supply, Forecast, Growth, Share, Consumer Insights, Competitive, Value, Outlook, Size & Demand,
- India Battery Powered Bulk Flow Meter Market (2026-2032) | Outlook, Analysis, Competitive Landscape, Growth, Size, Trends, Value, Revenue, Companies, Segmentation, Share & Forecast
- Bosnia and Herzegovina Fuel-Efficient Winglets Market (2026-2032) | Growth, Competition, Strategy, Restraints, Trends, Challenges, segmentation, Value, Outlook, Investment Opportunities, Analysis, Revenue, Companies, Insights, Pricing, Size, Drivers, Demand, Share, Forecast
- Canada Cloud CFD Market (2026-2032) | Size & Revenue, Industry, Growth, Competitive Landscape, Forecast, Segmentation, Value, Outlook, Trends, Share, Analysis, Companies
- Taiwan Food Delivery Platform Market (2026-2032) | Companies, Outlook, Analysis, Trends, Value, Revenue, Segmentation, Share, Forecast, Competitive Landscape, Growth, Size & Forecast
- United Kingdom (UK) Long-term Care Insurance Market (2026-2032) | Growth, Share, Consumer Insights, Drivers, Opportunities, Competition, Pricing Analysis, Segments, Restraints, Companies, Competitive, Value, Outlook, Size, Demand, Analysis, Challenges, Strategic Insights, Investment Trends, Revenue, Trends, Supply, Forecast
- United Kingdom (UK) Long Term Care Market (2026-2032) | Companies, Outlook, Analysis, Trends, Value, Revenue, Segmentation, Share, Forecast, Competitive Landscape, Growth, Size & Forecast
- Iraq Insulation and Waterproofing Market (2026-2032) | Outlook, Drivers, Growth, Size, Share, Industry, Revenue, Trends, Demand, Competitive, Strategic Insights, Opportunities, Segments, Companies, Challenges, Strategy, Consumer Insights, Analysis, Investment Trends, Value, Segmentation, Forecast, Restraints
- India Switchgear Market Outlook (2026-2032) | Size, Share, Trends, Growth, Revenue, Forecast, Analysis, Value, Outlook
Industry Events and Analyst Meet

India EV Show 2026

EV tech India Expo 2026

Auto Tech Asia 2026

Battery Tech India 2026

Smart Production Solutions Guangzhou 2026
Whitepaper
- Middle East & Africa Commercial Security Market Click here to view more.
- Middle East & Africa Fire Safety Systems & Equipment Market Click here to view more.
- GCC Drone Market Click here to view more.
- Middle East Lighting Fixture Market Click here to view more.
- GCC Physical & Perimeter Security Market Click here to view more.
6WResearch In News
- Doha a strategic location for EV manufacturing hub: IPA Qatar
- Demand for luxury TVs surging in the GCC, says Samsung
- Empowering Growth: The Thriving Journey of Bangladesh’s Cable Industry
- Demand for luxury TVs surging in the GCC, says Samsung
- Video call with a traditional healer? Once unthinkable, it’s now common in South Africa
- Intelligent Buildings To Smooth GCC’s Path To Net Zero