Malta Above Ground Swimming Pools Market (2026-2032) | Trends, Competition, Demand, Outlook, Supply, Segmentation, Segments, Challenges, Strategy, Investment Trends, Strategic Insights, Forecast, Pricing Analysis, Restraints, Drivers, Consumer Insights, Analysis, Companies, Share, Value, Growth, Revenue, Competitive, Industry, Opportunities, Size
Market Forecast By Pool Type (Inflatable Pools, Metal Frame Pools, Resin Frame Pools, Custom Designs), By Material (PVC/Polyester, Galvanized Steel, Composite Materials, Fiberglass/Plastic), By End User (Residential, Commercial (Hotels), Rental Services, Leisure & Resorts) And Competitive Landscape
| Product Code: ETC11701248 | Publication Date: Apr 2025 | Updated Date: Apr 2026 | Product Type: Market Research Report | |
| Publisher: 6Wresearch | Author: Bhawna Singh | No. of Pages: 65 | No. of Figures: 34 | No. of Tables: 19 |
Malta Above Ground Swimming Pools Market Size (2020-2030)
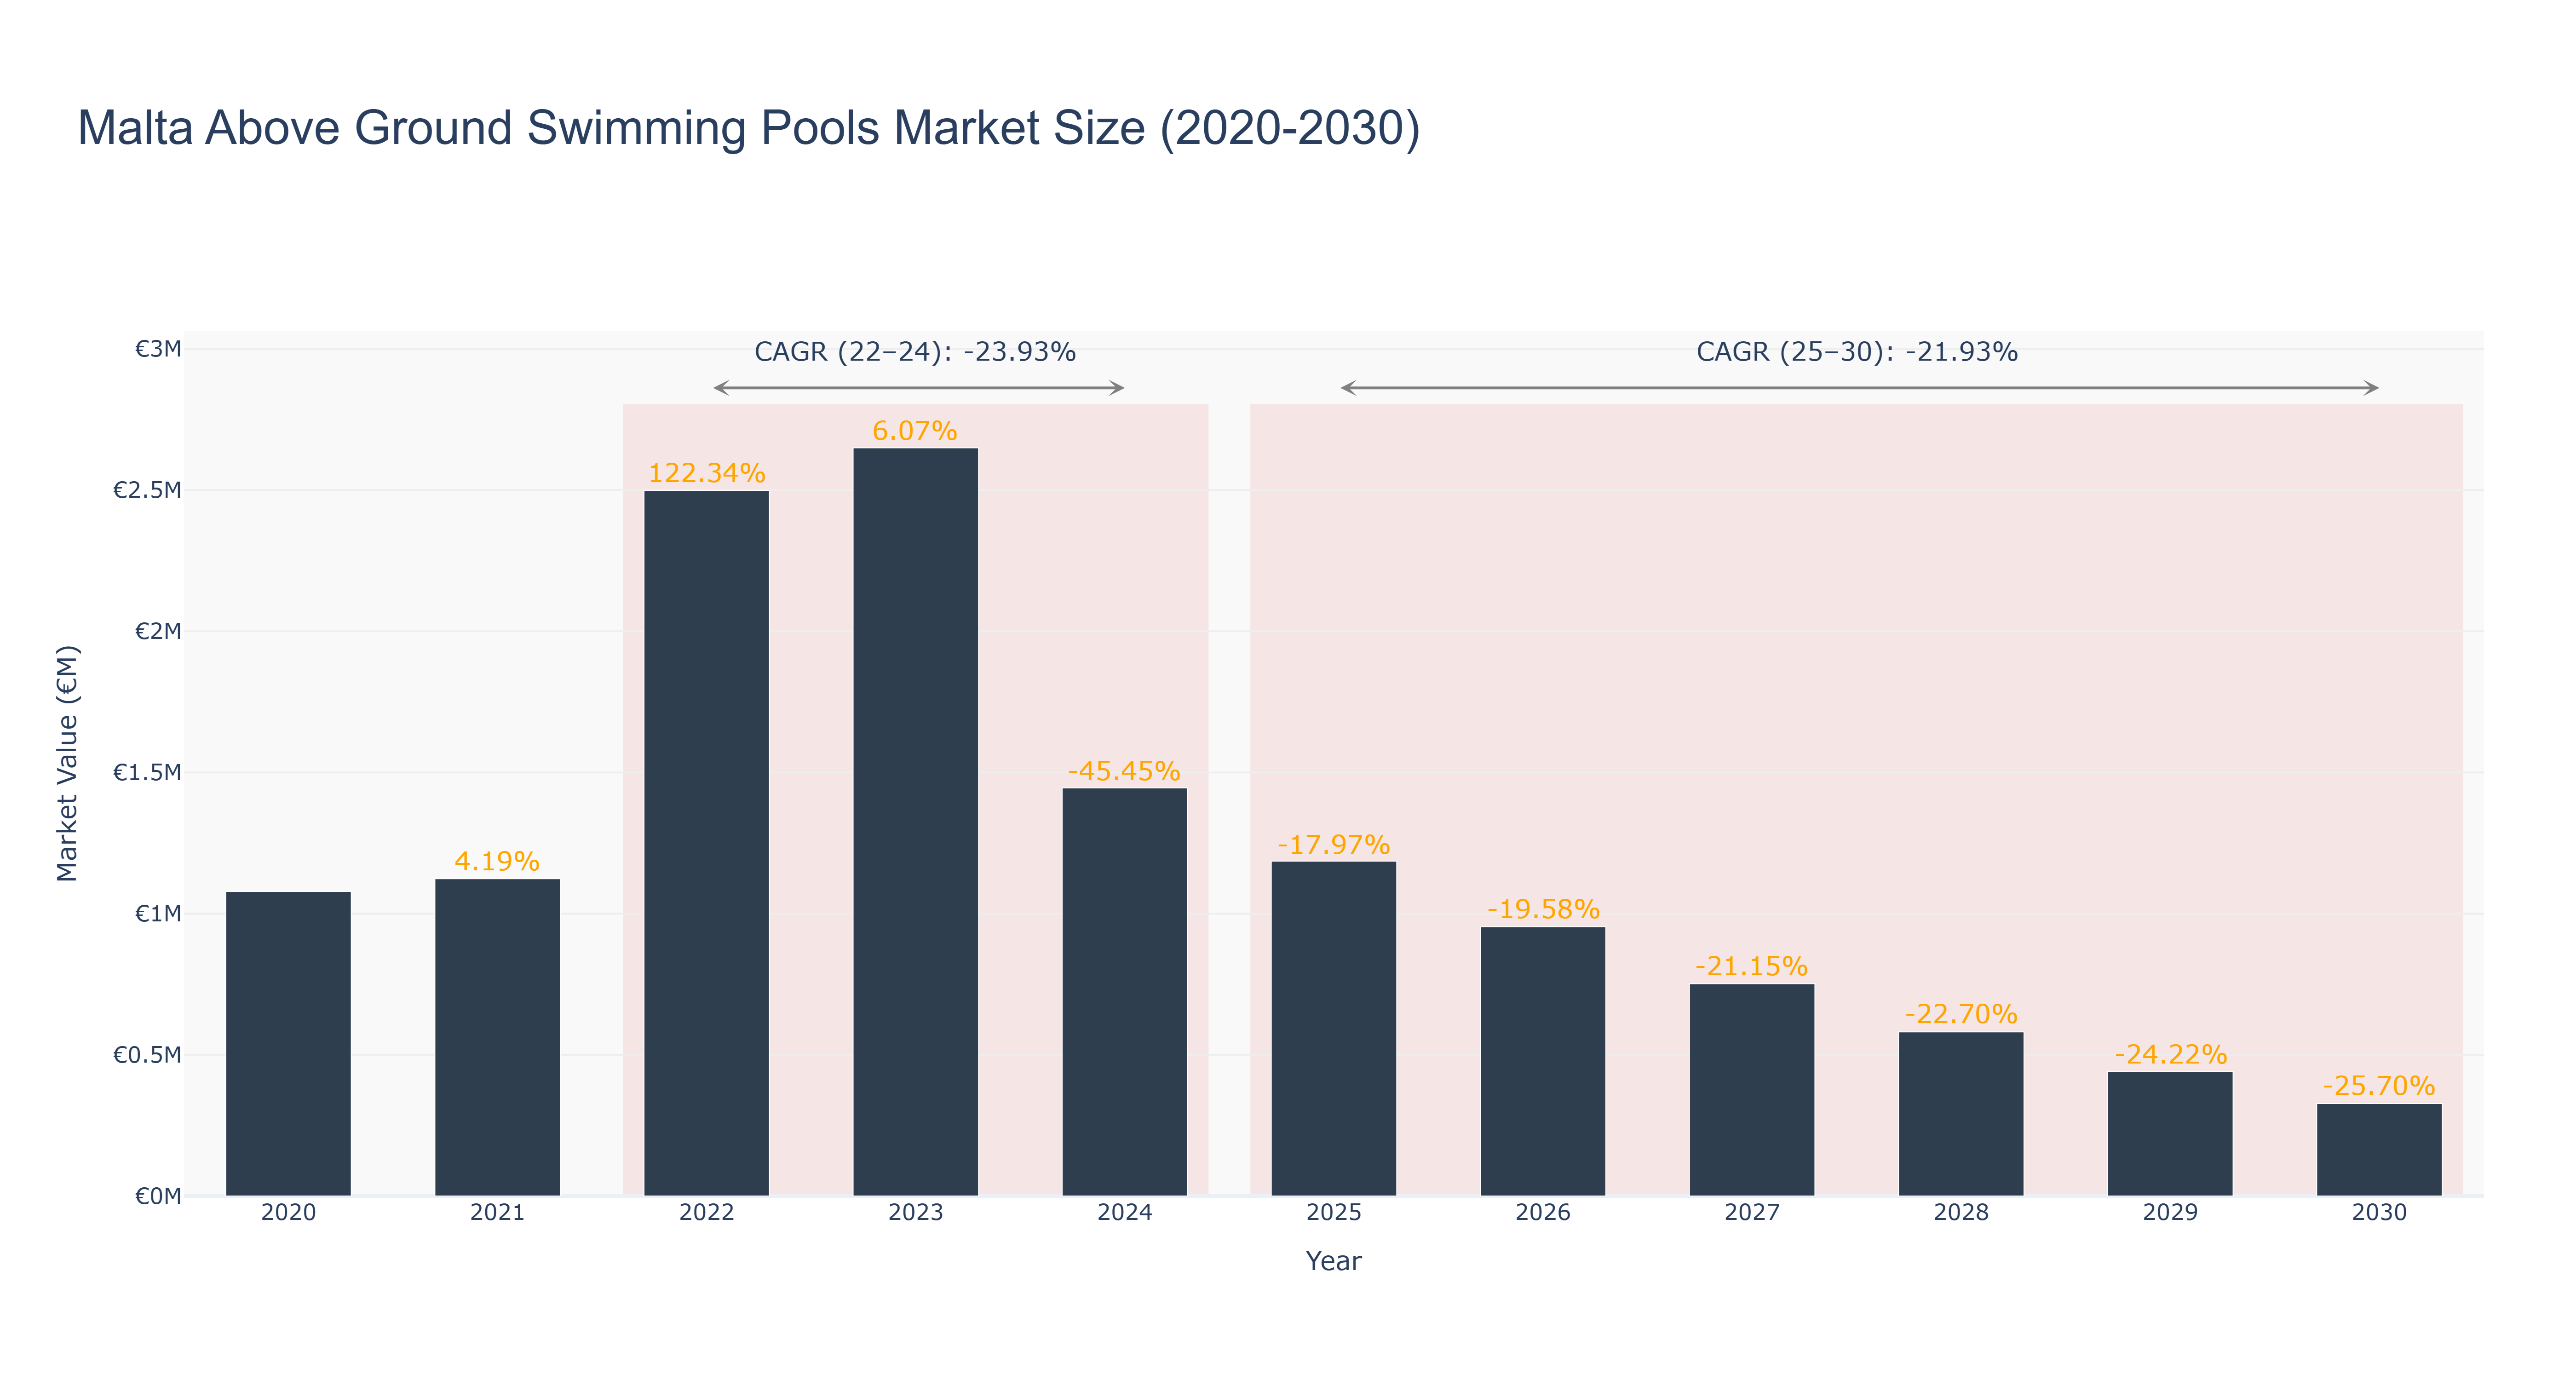
The Malta Above Ground Swimming Pools Market experienced significant fluctuations between 2020 and 2024, peaking in 2022 with a market size of €2.50 million, reflecting an extraordinary growth rate of 122.34%. However, this upward trend was short-lived, as subsequent actual data from 2023 showed a modest growth of 6.07% before plummeting to €1.45 million in 2024, resulting in a compounded annual growth rate (CAGR) of -23.93% for the period. Looking ahead, the forecasted values from 2025 to 2030 indicate a continued decline, with projected market sizes decreasing to €327.28 thousand by 2030 and a CAGR of -21.93%. This downturn may be attributed to factors such as market saturation, changing consumer preferences, and economic constraints. As the market adjusts, potential recovery may hinge on innovative product offerings and strategic marketing initiatives, though no specific upcoming projects have been identified that could catalyze growth in the near term.
Malta Above Ground Swimming Pools Market: Production & Trade Performance (2019-2025)
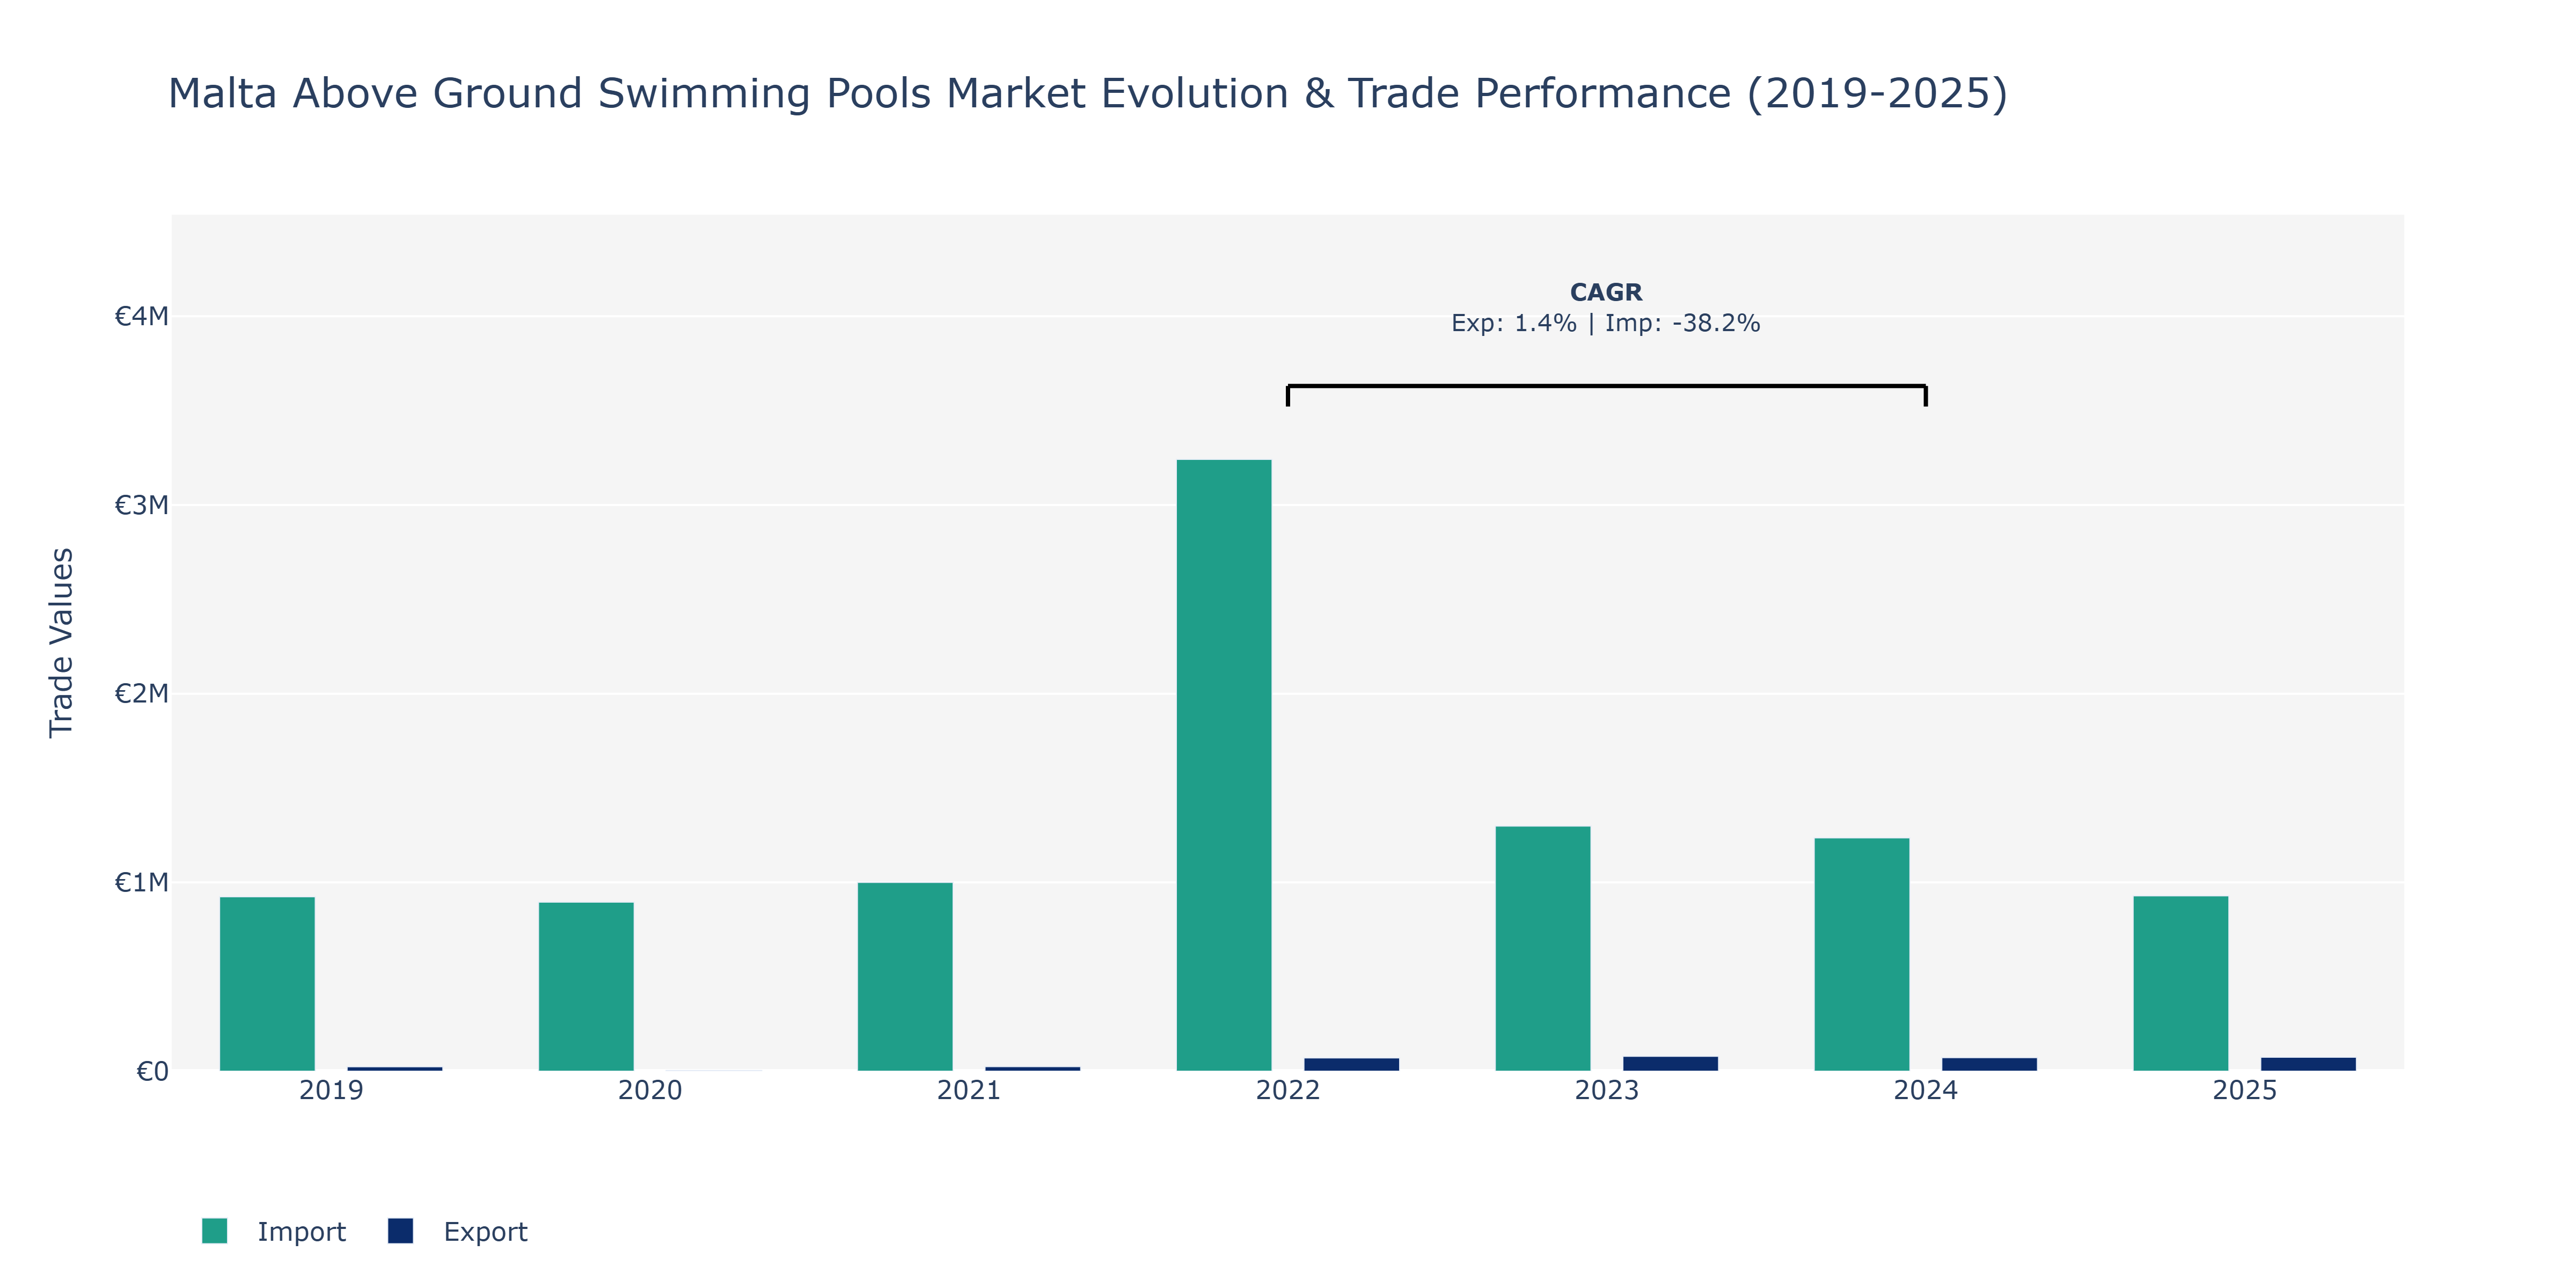
The Malta Above Ground Swimming Pools Market saw a notable fluctuation in exports and imports between 2019 and 2025. In 2019, imports stood at €924.16 thousand, significantly higher than exports at €23.17 thousand. However, in 2020, both exports and imports experienced a sharp decline, with exports at €3.86 thousand and imports at €895.66 thousand. The following years witnessed a recovery in trade, with both exports and imports showing an upward trend. In 2022, exports spiked to €70.07 thousand, while imports surged to €3.24 million. Interestingly, imports peaked in 2023 at €1.3 million, while exports slightly decreased. By 2025, exports rebounded to €74.03 thousand, whereas imports decreased to €929.37 thousand. The fluctuations can be attributed to global economic conditions, consumer demand shifts, and possibly domestic production capabilities impacting trade volumes in the Malta above ground swimming pools market. To support this analysis, industry reports suggest that changes in consumer preferences towards more sustainable and affordable pool options could have influenced trade patterns during this period.
Key Highlights of the Report:
- Malta Above Ground Swimming Pools Market Outlook
- Market Size of Malta Above Ground Swimming Pools Market, 2025
- Forecast of Malta Above Ground Swimming Pools Market, 2032
- Historical Data and Forecast of Malta Above Ground Swimming Pools Revenues & Volume for the Period 2022 - 2032F
- Malta Above Ground Swimming Pools Market Trend Evolution
- Malta Above Ground Swimming Pools Market Drivers and Challenges
- Malta Above Ground Swimming Pools Price Trends
- Malta Above Ground Swimming Pools Porter's Five Forces
- Malta Above Ground Swimming Pools Industry Life Cycle
- Historical Data and Forecast of Malta Above Ground Swimming Pools Market Revenues & Volume By Pool Type for the Period 2022 - 2032F
- Historical Data and Forecast of Malta Above Ground Swimming Pools Market Revenues & Volume By Inflatable Pools for the Period 2022 - 2032F
- Historical Data and Forecast of Malta Above Ground Swimming Pools Market Revenues & Volume By Metal Frame Pools for the Period 2022 - 2032F
- Historical Data and Forecast of Malta Above Ground Swimming Pools Market Revenues & Volume By Resin Frame Pools for the Period 2022 - 2032F
- Historical Data and Forecast of Malta Above Ground Swimming Pools Market Revenues & Volume By Custom Designs for the Period 2022 - 2032F
- Historical Data and Forecast of Malta Above Ground Swimming Pools Market Revenues & Volume By Material for the Period 2022 - 2032F
- Historical Data and Forecast of Malta Above Ground Swimming Pools Market Revenues & Volume By PVC/Polyester for the Period 2022 - 2032F
- Historical Data and Forecast of Malta Above Ground Swimming Pools Market Revenues & Volume By Galvanized Steel for the Period 2022 - 2032F
- Historical Data and Forecast of Malta Above Ground Swimming Pools Market Revenues & Volume By Composite Materials for the Period 2022 - 2032F
- Historical Data and Forecast of Malta Above Ground Swimming Pools Market Revenues & Volume By Fiberglass/Plastic for the Period 2022 - 2032F
- Historical Data and Forecast of Malta Above Ground Swimming Pools Market Revenues & Volume By End User for the Period 2022 - 2032F
- Historical Data and Forecast of Malta Above Ground Swimming Pools Market Revenues & Volume By Residential for the Period 2022 - 2032F
- Historical Data and Forecast of Malta Above Ground Swimming Pools Market Revenues & Volume By Commercial (Hotels) for the Period 2022 - 2032F
- Historical Data and Forecast of Malta Above Ground Swimming Pools Market Revenues & Volume By Rental Services for the Period 2022 - 2032F
- Historical Data and Forecast of Malta Above Ground Swimming Pools Market Revenues & Volume By Leisure & Resorts for the Period 2022 - 2032F
- Malta Above Ground Swimming Pools Import Export Trade Statistics
- Market Opportunity Assessment By Pool Type
- Market Opportunity Assessment By Material
- Market Opportunity Assessment By End User
- Malta Above Ground Swimming Pools Top Companies Market Share
- Malta Above Ground Swimming Pools Competitive Benchmarking By Technical and Operational Parameters
- Malta Above Ground Swimming Pools Company Profiles
- Malta Above Ground Swimming Pools Key Strategic Recommendations
Frequently Asked Questions About the Market Study (FAQs):
6Wresearch actively monitors the Malta Above Ground Swimming Pools Market and publishes its comprehensive annual report, highlighting emerging trends, growth drivers, revenue analysis, and forecast outlook. Our insights help businesses to make data-backed strategic decisions with ongoing market dynamics. Our analysts track relevent industries related to the Malta Above Ground Swimming Pools Market, allowing our clients with actionable intelligence and reliable forecasts tailored to emerging regional needs.
Yes, we provide customisation as per your requirements. To learn more, feel free to contact us on sales@6wresearch.com
1 Executive Summary |
2 Introduction |
2.1 Key Highlights of the Report |
2.2 Report Description |
2.3 Market Scope & Segmentation |
2.4 Research Methodology |
2.5 Assumptions |
3 Malta Above Ground Swimming Pools Market Overview |
3.1 Malta Country Macro Economic Indicators |
3.2 Malta Above Ground Swimming Pools Market Revenues & Volume, 2022 & 2032F |
3.3 Malta Above Ground Swimming Pools Market - Industry Life Cycle |
3.4 Malta Above Ground Swimming Pools Market - Porter's Five Forces |
3.5 Malta Above Ground Swimming Pools Market Revenues & Volume Share, By Pool Type, 2022 & 2032F |
3.6 Malta Above Ground Swimming Pools Market Revenues & Volume Share, By Material, 2022 & 2032F |
3.7 Malta Above Ground Swimming Pools Market Revenues & Volume Share, By End User, 2022 & 2032F |
4 Malta Above Ground Swimming Pools Market Dynamics |
4.1 Impact Analysis |
4.2 Market Drivers |
4.3 Market Restraints |
5 Malta Above Ground Swimming Pools Market Trends |
6 Malta Above Ground Swimming Pools Market, By Types |
6.1 Malta Above Ground Swimming Pools Market, By Pool Type |
6.1.1 Overview and Analysis |
6.1.2 Malta Above Ground Swimming Pools Market Revenues & Volume, By Pool Type, 2022 - 2032F |
6.1.3 Malta Above Ground Swimming Pools Market Revenues & Volume, By Inflatable Pools, 2022 - 2032F |
6.1.4 Malta Above Ground Swimming Pools Market Revenues & Volume, By Metal Frame Pools, 2022 - 2032F |
6.1.5 Malta Above Ground Swimming Pools Market Revenues & Volume, By Resin Frame Pools, 2022 - 2032F |
6.1.6 Malta Above Ground Swimming Pools Market Revenues & Volume, By Custom Designs, 2022 - 2032F |
6.2 Malta Above Ground Swimming Pools Market, By Material |
6.2.1 Overview and Analysis |
6.2.2 Malta Above Ground Swimming Pools Market Revenues & Volume, By PVC/Polyester, 2022 - 2032F |
6.2.3 Malta Above Ground Swimming Pools Market Revenues & Volume, By Galvanized Steel, 2022 - 2032F |
6.2.4 Malta Above Ground Swimming Pools Market Revenues & Volume, By Composite Materials, 2022 - 2032F |
6.2.5 Malta Above Ground Swimming Pools Market Revenues & Volume, By Fiberglass/Plastic, 2022 - 2032F |
6.3 Malta Above Ground Swimming Pools Market, By End User |
6.3.1 Overview and Analysis |
6.3.2 Malta Above Ground Swimming Pools Market Revenues & Volume, By Residential, 2022 - 2032F |
6.3.3 Malta Above Ground Swimming Pools Market Revenues & Volume, By Commercial (Hotels), 2022 - 2032F |
6.3.4 Malta Above Ground Swimming Pools Market Revenues & Volume, By Rental Services, 2022 - 2032F |
6.3.5 Malta Above Ground Swimming Pools Market Revenues & Volume, By Leisure & Resorts, 2022 - 2032F |
7 Malta Above Ground Swimming Pools Market Import-Export Trade Statistics |
7.1 Malta Above Ground Swimming Pools Market Export to Major Countries |
7.2 Malta Above Ground Swimming Pools Market Imports from Major Countries |
8 Malta Above Ground Swimming Pools Market Key Performance Indicators |
9 Malta Above Ground Swimming Pools Market - Opportunity Assessment |
9.1 Malta Above Ground Swimming Pools Market Opportunity Assessment, By Pool Type, 2022 & 2032F |
9.2 Malta Above Ground Swimming Pools Market Opportunity Assessment, By Material, 2022 & 2032F |
9.3 Malta Above Ground Swimming Pools Market Opportunity Assessment, By End User, 2022 & 2032F |
10 Malta Above Ground Swimming Pools Market - Competitive Landscape |
10.1 Malta Above Ground Swimming Pools Market Revenue Share, By Companies, 2025 |
10.2 Malta Above Ground Swimming Pools Market Competitive Benchmarking, By Operating and Technical Parameters |
11 Company Profiles |
12 Recommendations |
13 Disclaimer |
Export potential assessment - trade Analytics for 2030
Export potential enables firms to identify high-growth global markets with greater confidence by combining advanced trade intelligence with a structured quantitative methodology. The framework analyzes emerging demand trends and country-level import patterns while integrating macroeconomic and trade datasets such as GDP and population forecasts, bilateral import–export flows, tariff structures, elasticity differentials between developed and developing economies, geographic distance, and import demand projections. Using weighted trade values from 2020–2024 as the base period to project country-to-country export potential for 2030, these inputs are operationalized through calculated drivers such as gravity model parameters, tariff impact factors, and projected GDP per-capita growth. Through an analysis of hidden potentials, demand hotspots, and market conditions that are most favorable to success, this method enables firms to focus on target countries, maximize returns, and global expansion with data, backed by accuracy.
By factoring in the projected importer demand gap that is currently unmet and could be potential opportunity, it identifies the potential for the Exporter (Country) among 190 countries, against the general trade analysis, which identifies the biggest importer or exporter.
To discover high-growth global markets and optimize your business strategy:
Click Here
Pricing
- Single User License$ 1,995
- Department License$ 2,400
- Site License$ 3,120
- Global License$ 3,795

Search
Thought Leadership and Analyst Meet


Our Clients
Latest Reports
- United Kingdom (UK) Outdoor Cooking Equipment Market (2026-2032) | Investment Opportunities, Outlook, Growth, Competition, Trends, Pricing, Demand, Insights, Challenges, Drivers, Size, Restraints, segmentation, Value, Share, Forecast, Companies, Analysis, Revenue, Strategy
- United Arab Emirates (UAE) Outdoor Cooking Equipment Market (2026-2032) | Challenges, Value, Restraints, Growth, Competition, Revenue, Trends, Outlook, Analysis, Drivers, Share, Investment Opportunities, Strategy, Demand, Companies, Forecast, Pricing, segmentation, Size, Insights
- Vietnam Outdoor Cooking Equipment Market (2026-2032) | Demand, Investment Opportunities, Growth, Pricing, Trends, Restraints, Competition, Outlook, Drivers, Strategy, Challenges, Revenue, Analysis, segmentation, Value, Size, Share, Insights, Companies, Forecast
- Venezuela Outdoor Cooking Equipment Market (2026-2032) | Challenges, Revenue, Demand, Value, Pricing, Strategy, Competition, Analysis, Companies, Insights, Growth, Outlook, Forecast, Size, Restraints, segmentation, Drivers, Trends, Investment Opportunities, Share
- Uganda Outdoor Cooking Equipment Market (2026-2032) | Drivers, Pricing, Challenges, Value, Growth, Companies, segmentation, Strategy, Analysis, Demand, Outlook, Size, Competition, Restraints, Revenue, Forecast, Investment Opportunities, Insights, Trends, Share
- Turkey Outdoor Cooking Equipment Market (2026-2032) | Size, Competition, Outlook, Strategy, Forecast, Drivers, Trends, Companies, Revenue, Growth, Analysis, segmentation, Insights, Pricing, Restraints, Demand, Investment Opportunities, Value, Share, Challenges
- Tunisia Outdoor Cooking Equipment Market (2026-2032) | Analysis, Share, Pricing, Trends, Size, Outlook, Revenue, segmentation, Demand, Insights, Investment Opportunities, Restraints, Growth, Forecast, Competition, Drivers, Challenges, Companies, Strategy, Value
- Thailand Outdoor Cooking Equipment Market (2026-2032) | Growth, Revenue, Insights, Companies, Drivers, Strategy, Forecast, Size, Analysis, segmentation, Trends, Challenges, Competition, Share, Investment Opportunities, Demand, Pricing, Value, Restraints, Outlook
- Tanzania Outdoor Cooking Equipment Market (2026-2032) | Share, Drivers, Forecast, Revenue, Growth, Outlook, Analysis, Investment Opportunities, Restraints, segmentation, Demand, Pricing, Size, Insights, Challenges, Competition, Companies, Value, Trends, Strategy
- Tajikistan Outdoor Cooking Equipment Market (2026-2032) | Value, Pricing, Companies, Share, Strategy, Revenue, Investment Opportunities, Demand, Forecast, Size, Competition, Challenges, Growth, Insights, Restraints, segmentation, Analysis, Trends, Drivers, Outlook
Industry Events and Analyst Meet

HIMTEX 2026

India Refining Summit 2026

India EV Show 2026

EV tech India Expo 2026

Auto Tech Asia 2026
Whitepaper
- Middle East & Africa Commercial Security Market Click here to view more.
- Middle East & Africa Fire Safety Systems & Equipment Market Click here to view more.
- GCC Drone Market Click here to view more.
- Middle East Lighting Fixture Market Click here to view more.
- GCC Physical & Perimeter Security Market Click here to view more.
6WResearch In News
- Doha a strategic location for EV manufacturing hub: IPA Qatar
- Demand for luxury TVs surging in the GCC, says Samsung
- Empowering Growth: The Thriving Journey of Bangladesh’s Cable Industry
- Demand for luxury TVs surging in the GCC, says Samsung
- Video call with a traditional healer? Once unthinkable, it’s now common in South Africa
- Intelligent Buildings To Smooth GCC’s Path To Net Zero