Malta Alkylated Naphthalene Market (2025-2031) | Size & Revenue, Companies, Competitive Landscape, Trends, Value, Analysis, Industry, Forecast, Segmentation, Share, Outlook, Growth
Market Forecast By Grade (Standard, Food), By Viscosity Index (22-65 SUS, 65-90 SUS, 90-115 SUS, Above 115 SUS), By Application (Automotive Engine & Gear Oils, Hydraulic Fluids, Heat Transfer Oils, Compressor Oils, Paper Machine Oils, Industrial Lubes & Greases, Others (including Turbine Oils, Wind Mill Oils, and Vacuum Oils)) And Competitive Landscape
| Product Code: ETC8185418 | Publication Date: Sep 2024 | Updated Date: Apr 2026 | Product Type: Market Research Report | |
| Publisher: 6Wresearch | Author: Sumit Sagar | No. of Pages: 75 | No. of Figures: 35 | No. of Tables: 20 |
Malta Alkylated Naphthalene Market Size (2020-2030)
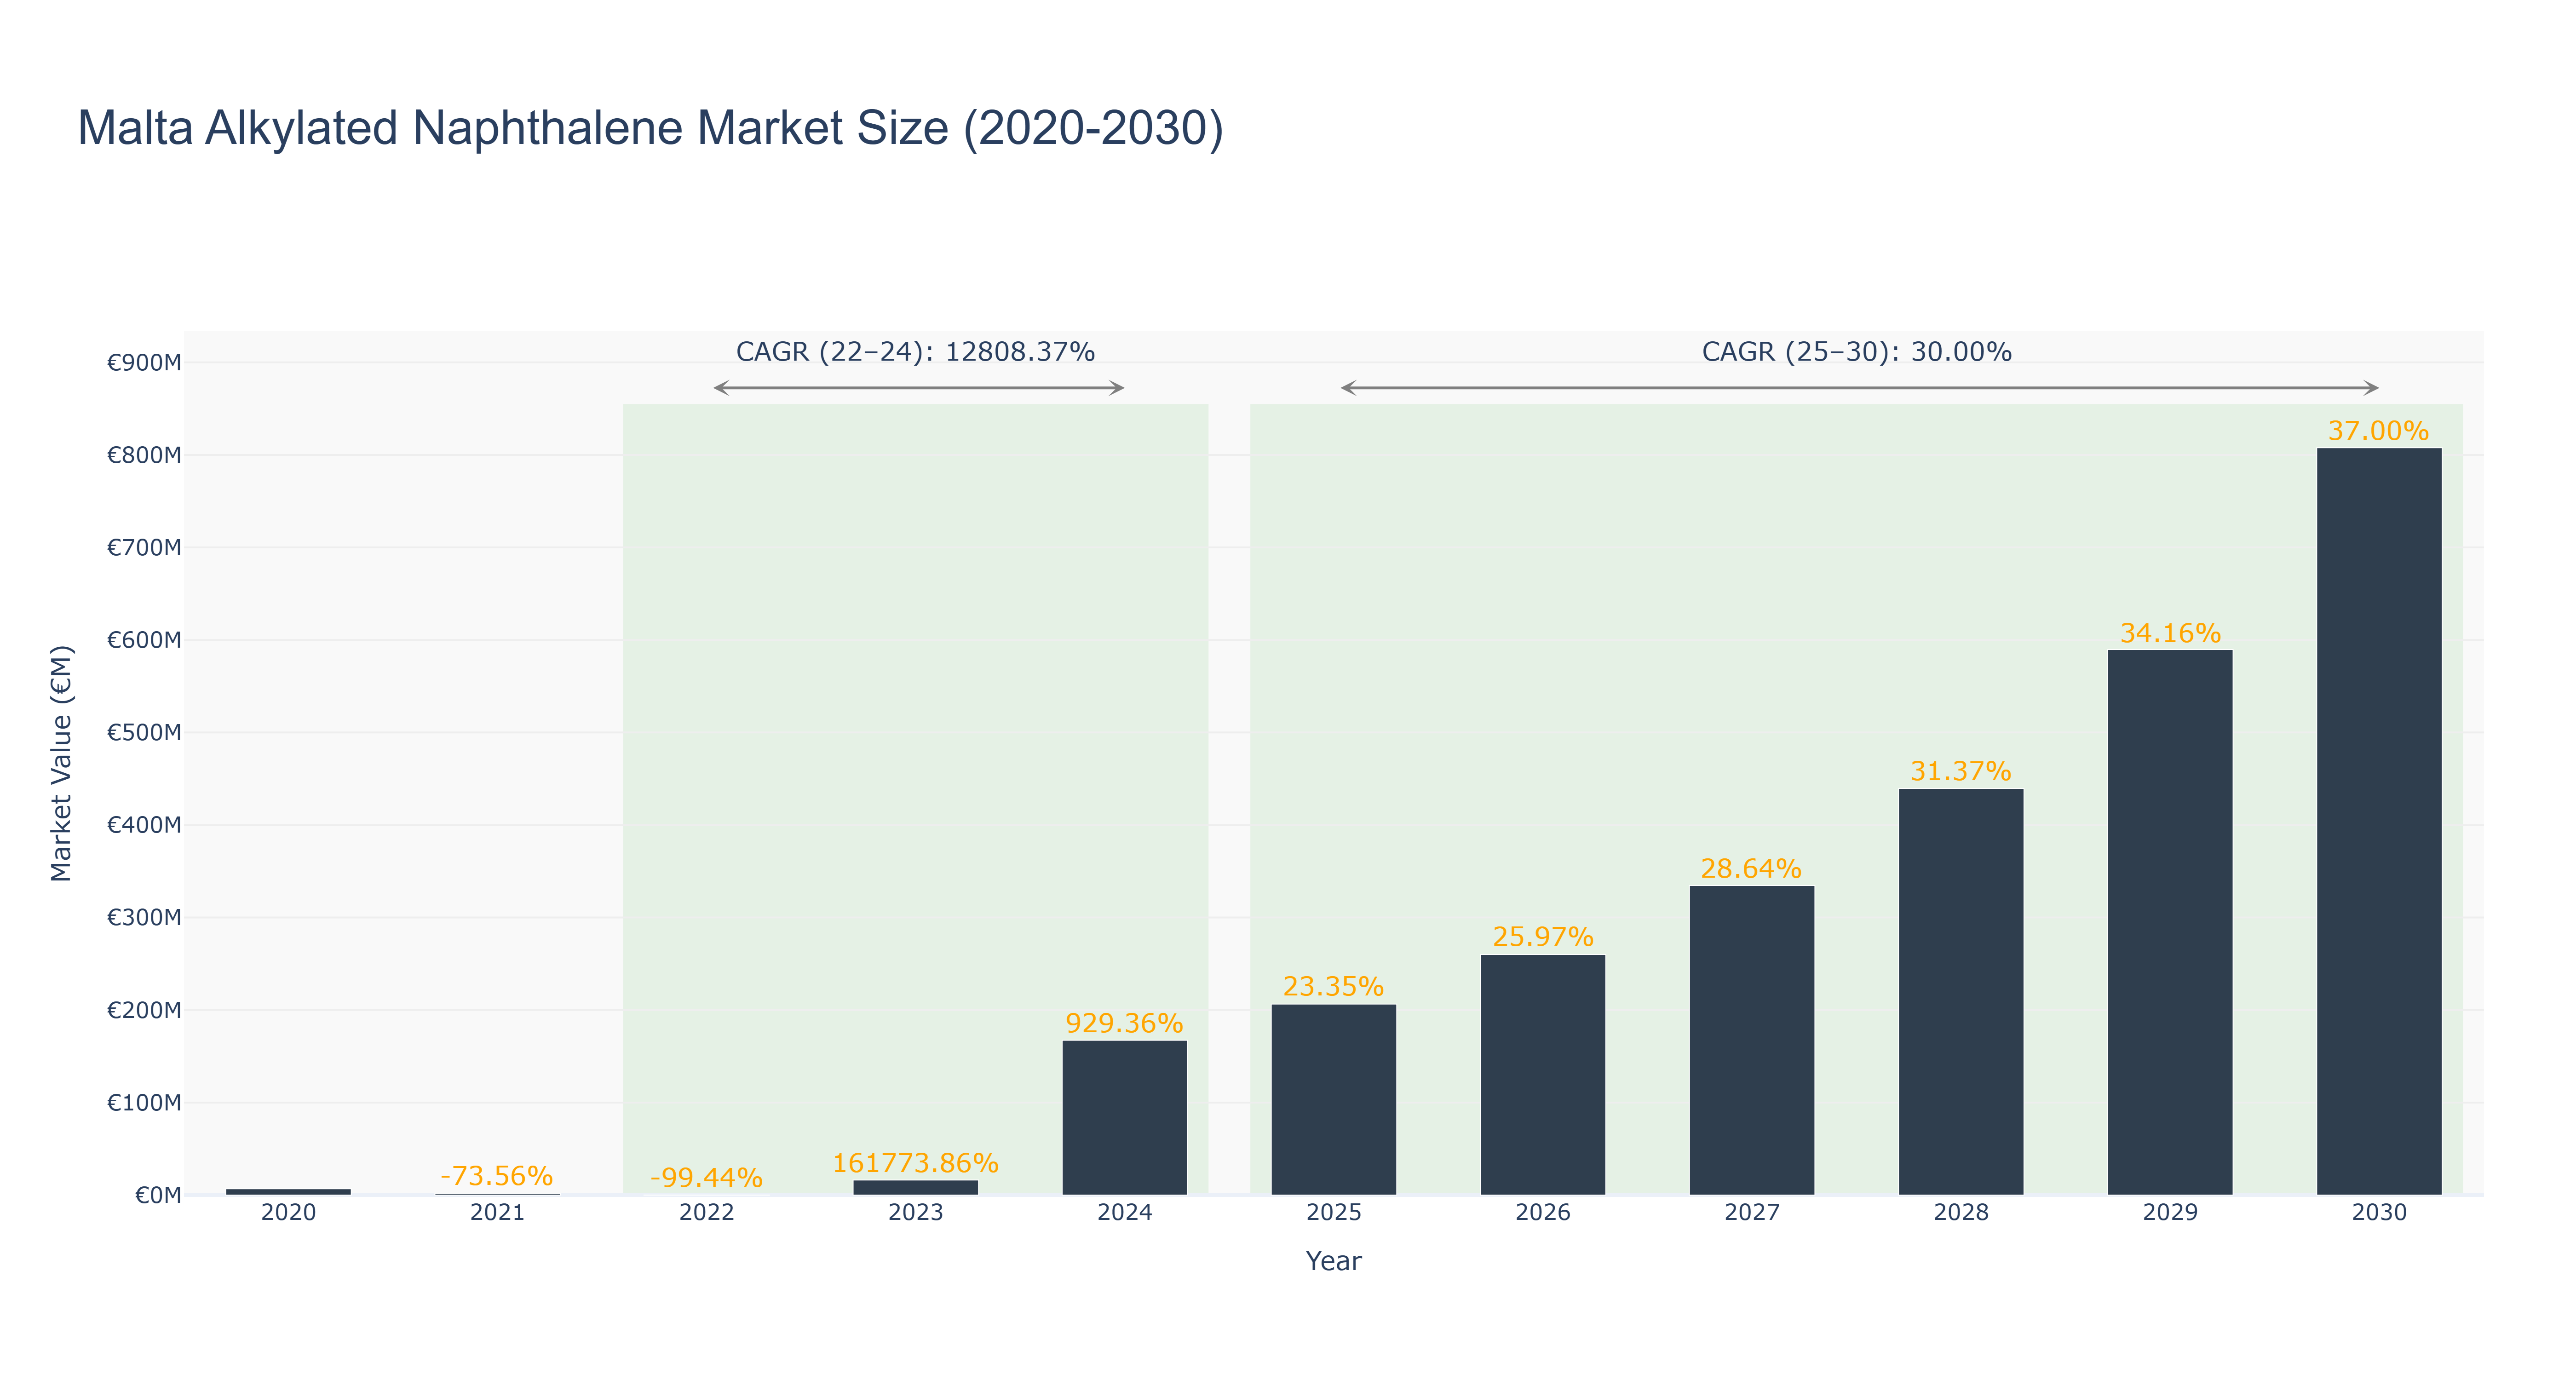
The Malta Alkylated Naphthalene Market has experienced extreme fluctuations over the past few years, peaking at €167.36 million in 2024 after a challenging period marked by a significant decline from €6.83 million in 2020 to just €10.04 thousand in 2022. The actual CAGR from 2022 to 2024 stands at an extraordinary 12,808.37%, driven by a resurgence in demand and strategic investments in production capabilities. Looking ahead, the forecast for 2025 to 2030 indicates a more stable growth trajectory, with projected market sizes reaching €807.81 million by 2030 and a CAGR of 30.00%. This growth is expected to be fueled by increasing applications in various industries, including paints, coatings, and lubricants, coupled with enhancements in manufacturing processes. The market's resilience and potential for expansion underscore its importance in Malta's industrial landscape, positioning it for sustained growth in the coming years.
Malta Alkylated Naphthalene Market: Production & Trade Performance (2019-2025)
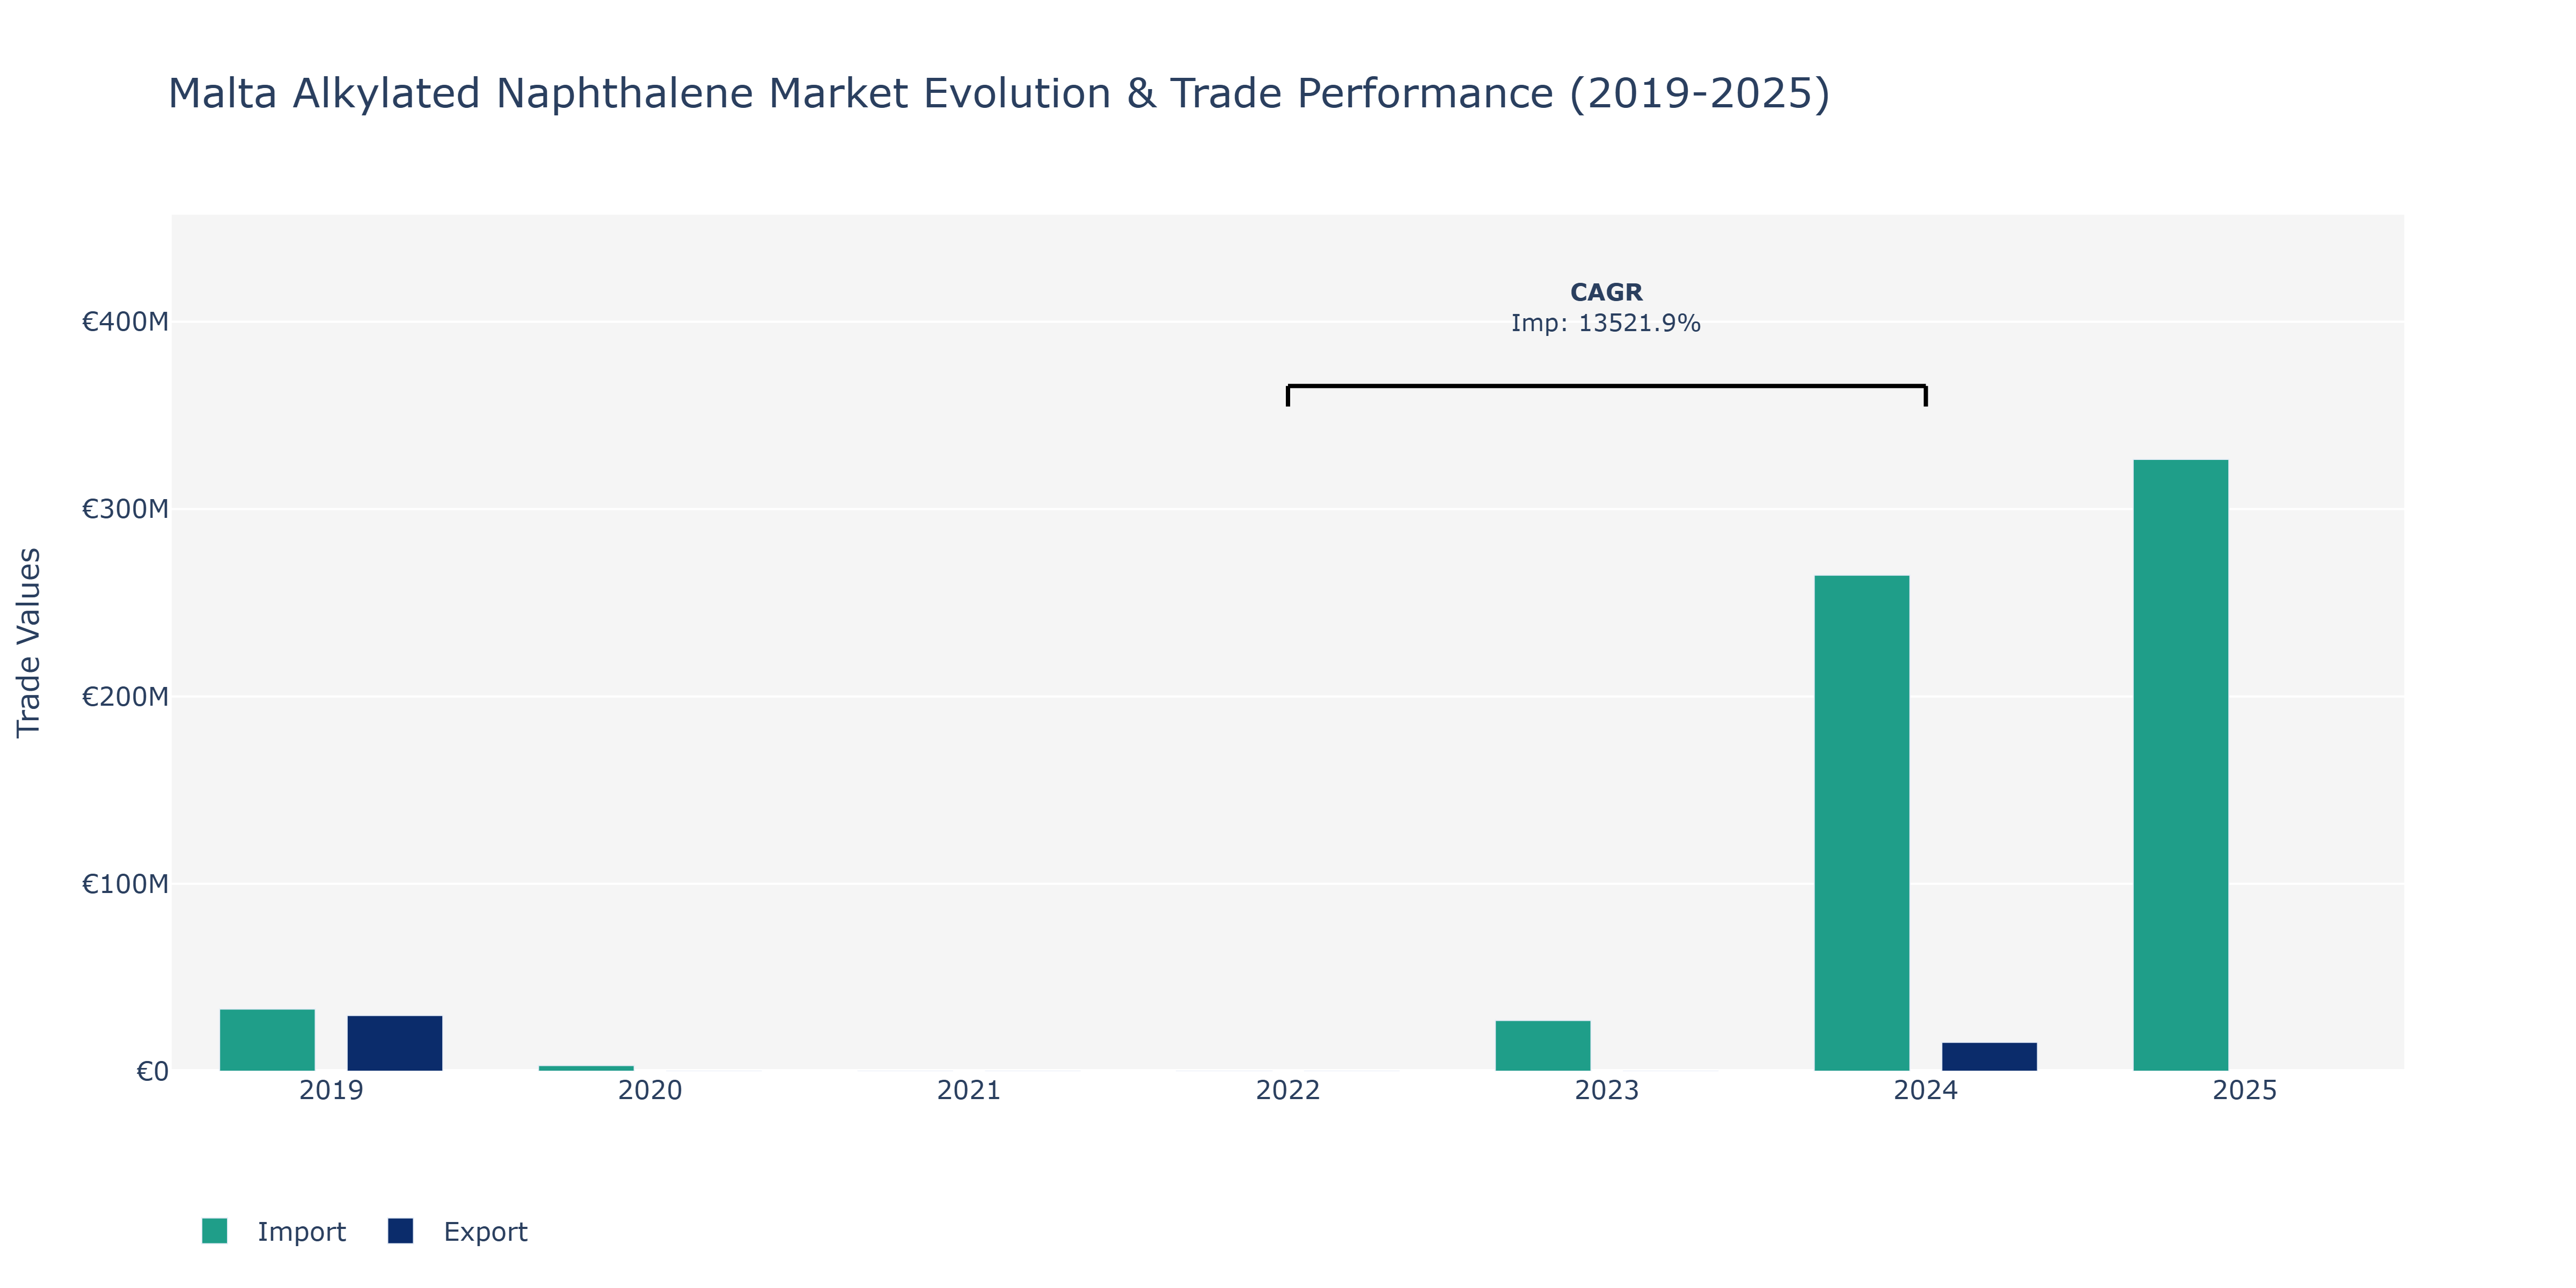
In the Malta Alkylated Naphthalene Market, the exports recorded €29.69 million in 2019, with a noticeable decline to €15.42 million in 2024. This drop could be attributed to various factors such as fluctuations in demand, changes in global market dynamics, or shifts in production capacities. On the import side, a contrasting trend is observed with imports showcasing a substantial increase from €33.12 million in 2019 to €264.7 million in 2024. The peak point for imports occurred in 2025, soaring to €326.52 million, showcasing a remarkable spike driven by a surge in demand, potential supply chain disruptions affecting local production, or strategic sourcing decisions by key players. The significant fluctuations in imports could be influenced by evolving trade agreements, regulatory changes impacting import volumes, or shifts in consumer preferences towards alkylated naphthalene products. These movements underscore the market's sensitivity to external factors and the need for stakeholders to adapt swiftly to dynamic market conditions to maintain competitiveness.
Key Highlights of the Report:
- Malta Alkylated Naphthalene Market Outlook
- Market Size of Malta Alkylated Naphthalene Market, 2024
- Forecast of Malta Alkylated Naphthalene Market, 2031
- Historical Data and Forecast of Malta Alkylated Naphthalene Revenues & Volume for the Period 2021- 2031
- Malta Alkylated Naphthalene Market Trend Evolution
- Malta Alkylated Naphthalene Market Drivers and Challenges
- Malta Alkylated Naphthalene Price Trends
- Malta Alkylated Naphthalene Porter's Five Forces
- Malta Alkylated Naphthalene Industry Life Cycle
- Historical Data and Forecast of Malta Alkylated Naphthalene Market Revenues & Volume By Grade for the Period 2021- 2031
- Historical Data and Forecast of Malta Alkylated Naphthalene Market Revenues & Volume By Standard for the Period 2021- 2031
- Historical Data and Forecast of Malta Alkylated Naphthalene Market Revenues & Volume By Food for the Period 2021- 2031
- Historical Data and Forecast of Malta Alkylated Naphthalene Market Revenues & Volume By Viscosity Index for the Period 2021- 2031
- Historical Data and Forecast of Malta Alkylated Naphthalene Market Revenues & Volume By 22-65 SUS for the Period 2021- 2031
- Historical Data and Forecast of Malta Alkylated Naphthalene Market Revenues & Volume By 65-90 SUS for the Period 2021- 2031
- Historical Data and Forecast of Malta Alkylated Naphthalene Market Revenues & Volume By 90-115 SUS for the Period 2021- 2031
- Historical Data and Forecast of Malta Alkylated Naphthalene Market Revenues & Volume By Above 115 SUS for the Period 2021- 2031
- Historical Data and Forecast of Malta Alkylated Naphthalene Market Revenues & Volume By Application for the Period 2021- 2031
- Historical Data and Forecast of Malta Alkylated Naphthalene Market Revenues & Volume By Automotive Engine & Gear Oils for the Period 2021- 2031
- Historical Data and Forecast of Malta Alkylated Naphthalene Market Revenues & Volume By Hydraulic Fluids for the Period 2021- 2031
- Historical Data and Forecast of Malta Alkylated Naphthalene Market Revenues & Volume By Heat Transfer Oils for the Period 2021- 2031
- Historical Data and Forecast of Malta Alkylated Naphthalene Market Revenues & Volume By Compressor Oils for the Period 2021- 2031
- Historical Data and Forecast of Malta Alkylated Naphthalene Market Revenues & Volume By Paper Machine Oils for the Period 2021- 2031
- Historical Data and Forecast of Malta Alkylated Naphthalene Market Revenues & Volume By Industrial Lubes & Greases for the Period 2021- 2031
- Historical Data and Forecast of Malta Alkylated Naphthalene Market Revenues & Volume By Others (including Turbine Oils, Wind Mill Oils, and Vacuum Oils) for the Period 2021- 2031
- Malta Alkylated Naphthalene Import Export Trade Statistics
- Market Opportunity Assessment By Grade
- Market Opportunity Assessment By Viscosity Index
- Market Opportunity Assessment By Application
- Malta Alkylated Naphthalene Top Companies Market Share
- Malta Alkylated Naphthalene Competitive Benchmarking By Technical and Operational Parameters
- Malta Alkylated Naphthalene Company Profiles
- Malta Alkylated Naphthalene Key Strategic Recommendations
Frequently Asked Questions About the Market Study (FAQs):
6Wresearch actively monitors the Malta Alkylated Naphthalene Market and publishes its comprehensive annual report, highlighting emerging trends, growth drivers, revenue analysis, and forecast outlook. Our insights help businesses to make data-backed strategic decisions with ongoing market dynamics. Our analysts track relevent industries related to the Malta Alkylated Naphthalene Market, allowing our clients with actionable intelligence and reliable forecasts tailored to emerging regional needs.
Yes, we provide customisation as per your requirements. To learn more, feel free to contact us on sales@6wresearch.com
1 Executive Summary |
2 Introduction |
2.1 Key Highlights of the Report |
2.2 Report Description |
2.3 Market Scope & Segmentation |
2.4 Research Methodology |
2.5 Assumptions |
3 Malta Alkylated Naphthalene Market Overview |
3.1 Malta Country Macro Economic Indicators |
3.2 Malta Alkylated Naphthalene Market Revenues & Volume, 2021 & 2031F |
3.3 Malta Alkylated Naphthalene Market - Industry Life Cycle |
3.4 Malta Alkylated Naphthalene Market - Porter's Five Forces |
3.5 Malta Alkylated Naphthalene Market Revenues & Volume Share, By Grade, 2021 & 2031F |
3.6 Malta Alkylated Naphthalene Market Revenues & Volume Share, By Viscosity Index, 2021 & 2031F |
3.7 Malta Alkylated Naphthalene Market Revenues & Volume Share, By Application, 2021 & 2031F |
4 Malta Alkylated Naphthalene Market Dynamics |
4.1 Impact Analysis |
4.2 Market Drivers |
4.3 Market Restraints |
5 Malta Alkylated Naphthalene Market Trends |
6 Malta Alkylated Naphthalene Market, By Types |
6.1 Malta Alkylated Naphthalene Market, By Grade |
6.1.1 Overview and Analysis |
6.1.2 Malta Alkylated Naphthalene Market Revenues & Volume, By Grade, 2021- 2031F |
6.1.3 Malta Alkylated Naphthalene Market Revenues & Volume, By Standard, 2021- 2031F |
6.1.4 Malta Alkylated Naphthalene Market Revenues & Volume, By Food, 2021- 2031F |
6.2 Malta Alkylated Naphthalene Market, By Viscosity Index |
6.2.1 Overview and Analysis |
6.2.2 Malta Alkylated Naphthalene Market Revenues & Volume, By 22-65 SUS, 2021- 2031F |
6.2.3 Malta Alkylated Naphthalene Market Revenues & Volume, By 65-90 SUS, 2021- 2031F |
6.2.4 Malta Alkylated Naphthalene Market Revenues & Volume, By 90-115 SUS, 2021- 2031F |
6.2.5 Malta Alkylated Naphthalene Market Revenues & Volume, By Above 115 SUS, 2021- 2031F |
6.3 Malta Alkylated Naphthalene Market, By Application |
6.3.1 Overview and Analysis |
6.3.2 Malta Alkylated Naphthalene Market Revenues & Volume, By Automotive Engine & Gear Oils, 2021- 2031F |
6.3.3 Malta Alkylated Naphthalene Market Revenues & Volume, By Hydraulic Fluids, 2021- 2031F |
6.3.4 Malta Alkylated Naphthalene Market Revenues & Volume, By Heat Transfer Oils, 2021- 2031F |
6.3.5 Malta Alkylated Naphthalene Market Revenues & Volume, By Compressor Oils, 2021- 2031F |
6.3.6 Malta Alkylated Naphthalene Market Revenues & Volume, By Paper Machine Oils, 2021- 2031F |
6.3.7 Malta Alkylated Naphthalene Market Revenues & Volume, By Industrial Lubes & Greases, 2021- 2031F |
7 Malta Alkylated Naphthalene Market Import-Export Trade Statistics |
7.1 Malta Alkylated Naphthalene Market Export to Major Countries |
7.2 Malta Alkylated Naphthalene Market Imports from Major Countries |
8 Malta Alkylated Naphthalene Market Key Performance Indicators |
9 Malta Alkylated Naphthalene Market - Opportunity Assessment |
9.1 Malta Alkylated Naphthalene Market Opportunity Assessment, By Grade, 2021 & 2031F |
9.2 Malta Alkylated Naphthalene Market Opportunity Assessment, By Viscosity Index, 2021 & 2031F |
9.3 Malta Alkylated Naphthalene Market Opportunity Assessment, By Application, 2021 & 2031F |
10 Malta Alkylated Naphthalene Market - Competitive Landscape |
10.1 Malta Alkylated Naphthalene Market Revenue Share, By Companies, 2024 |
10.2 Malta Alkylated Naphthalene Market Competitive Benchmarking, By Operating and Technical Parameters |
11 Company Profiles |
12 Recommendations |
13 Disclaimer |
Global Go To Market Strategy - 2030
Export potential enables firms to identify high-growth global markets with greater confidence by combining advanced trade intelligence with a structured quantitative methodology. The framework analyzes emerging demand trends and country-level import patterns while integrating macroeconomic and trade datasets such as GDP and population forecasts, bilateral import–export flows, tariff structures, elasticity differentials between developed and developing economies, geographic distance, and import demand projections. Using weighted trade values from 2020–2024 as the base period to project country-to-country export potential for 2030, these inputs are operationalized through calculated drivers such as gravity model parameters, tariff impact factors, and projected GDP per-capita growth. Through an analysis of hidden potentials, demand hotspots, and market conditions that are most favorable to success, this method enables firms to focus on target countries, maximize returns, and global expansion with data, backed by accuracy.
By factoring in the projected importer demand gap that is currently unmet and could be potential opportunity, it identifies the potential for the Exporter (Country) among 190 countries, against the general trade analysis, which identifies the biggest importer or exporter.
To discover high-growth global markets and optimize your business strategy:
Click Here
Pricing
- Single User License$ 1,995
- Department License$ 2,400
- Site License$ 3,120
- Global License$ 3,795

Leadership Perspectives from Industry Events
Search
Thought Leadership and Analyst Meet


Our Clients
6WResearch In News
- India Export Attractiveness Tracker 2026
- India Air Conditioner Market Set for Strong Rebound in 2026 After Weather-Led Correction and GST-Driven Recovery: 6Wresearch
- ADAS in India: How Automatic Emergency Braking, Blind Spot Detection & Driver Monitoring are Transforming Road Safety
- Doha a strategic location for EV manufacturing hub: IPA Qatar
- Demand for luxury TVs surging in the GCC, says Samsung
- Empowering Growth: The Thriving Journey of Bangladesh’s Cable Industry
Latest Reports
- Nicaragua RPG Gaming Market (2026-2032)
- New Zealand RPG Gaming Market (2026-2032)
- Netherlands RPG Gaming Market (2026-2032)
- Nauru RPG Gaming Market (2026-2032)
- Namibia RPG Gaming Market (2026-2032)
- Mozambique RPG Gaming Market (2026-2032)
- Montenegro RPG Gaming Market (2026-2032)
- Mongolia RPG Gaming Market (2026-2032)
- Monaco RPG Gaming Market (2026-2032)
- Micronesia RPG Gaming Market (2026-2032)
Industry Events and Analyst Meet

EV India Expo 2026

HIMTEX 2026

India Refining Summit 2026

India EV Show 2026

EV tech India Expo 2026
Whitepaper
- Middle East & Africa Commercial Security Market Click here to view more.
- Middle East & Africa Fire Safety Systems & Equipment Market Click here to view more.
- GCC Drone Market Click here to view more.
- Middle East Lighting Fixture Market Click here to view more.
- GCC Physical & Perimeter Security Market Click here to view more.