Malta Chlorothalonil Market (2026-2032) | Industry, Growth, Share, Companies, Forecast, Competitive Landscape, Trends, Analysis, Value, Outlook, Size & Revenue, Segmentation
Market Forecast By Type (98% Chlorothalonil, 96% Chlorothalonil, 90% Chlorothalonil), By Product (Wettable Powder, Suspended Agents, Others (Granular & Dilute)), By Crop Type (Vegetables & Fruits, Oilseeds & Pulses, Turfs & Ornamentals, Cereals & Grains) And Competitive Landscape
| Product Code: ETC8188695 | Publication Date: Sep 2024 | Updated Date: Apr 2026 | Product Type: Market Research Report | |
| Publisher: 6Wresearch | Author: Summon Dutta | No. of Pages: 75 | No. of Figures: 35 | No. of Tables: 20 |
Malta Chlorothalonil Market Size (2020-2030)
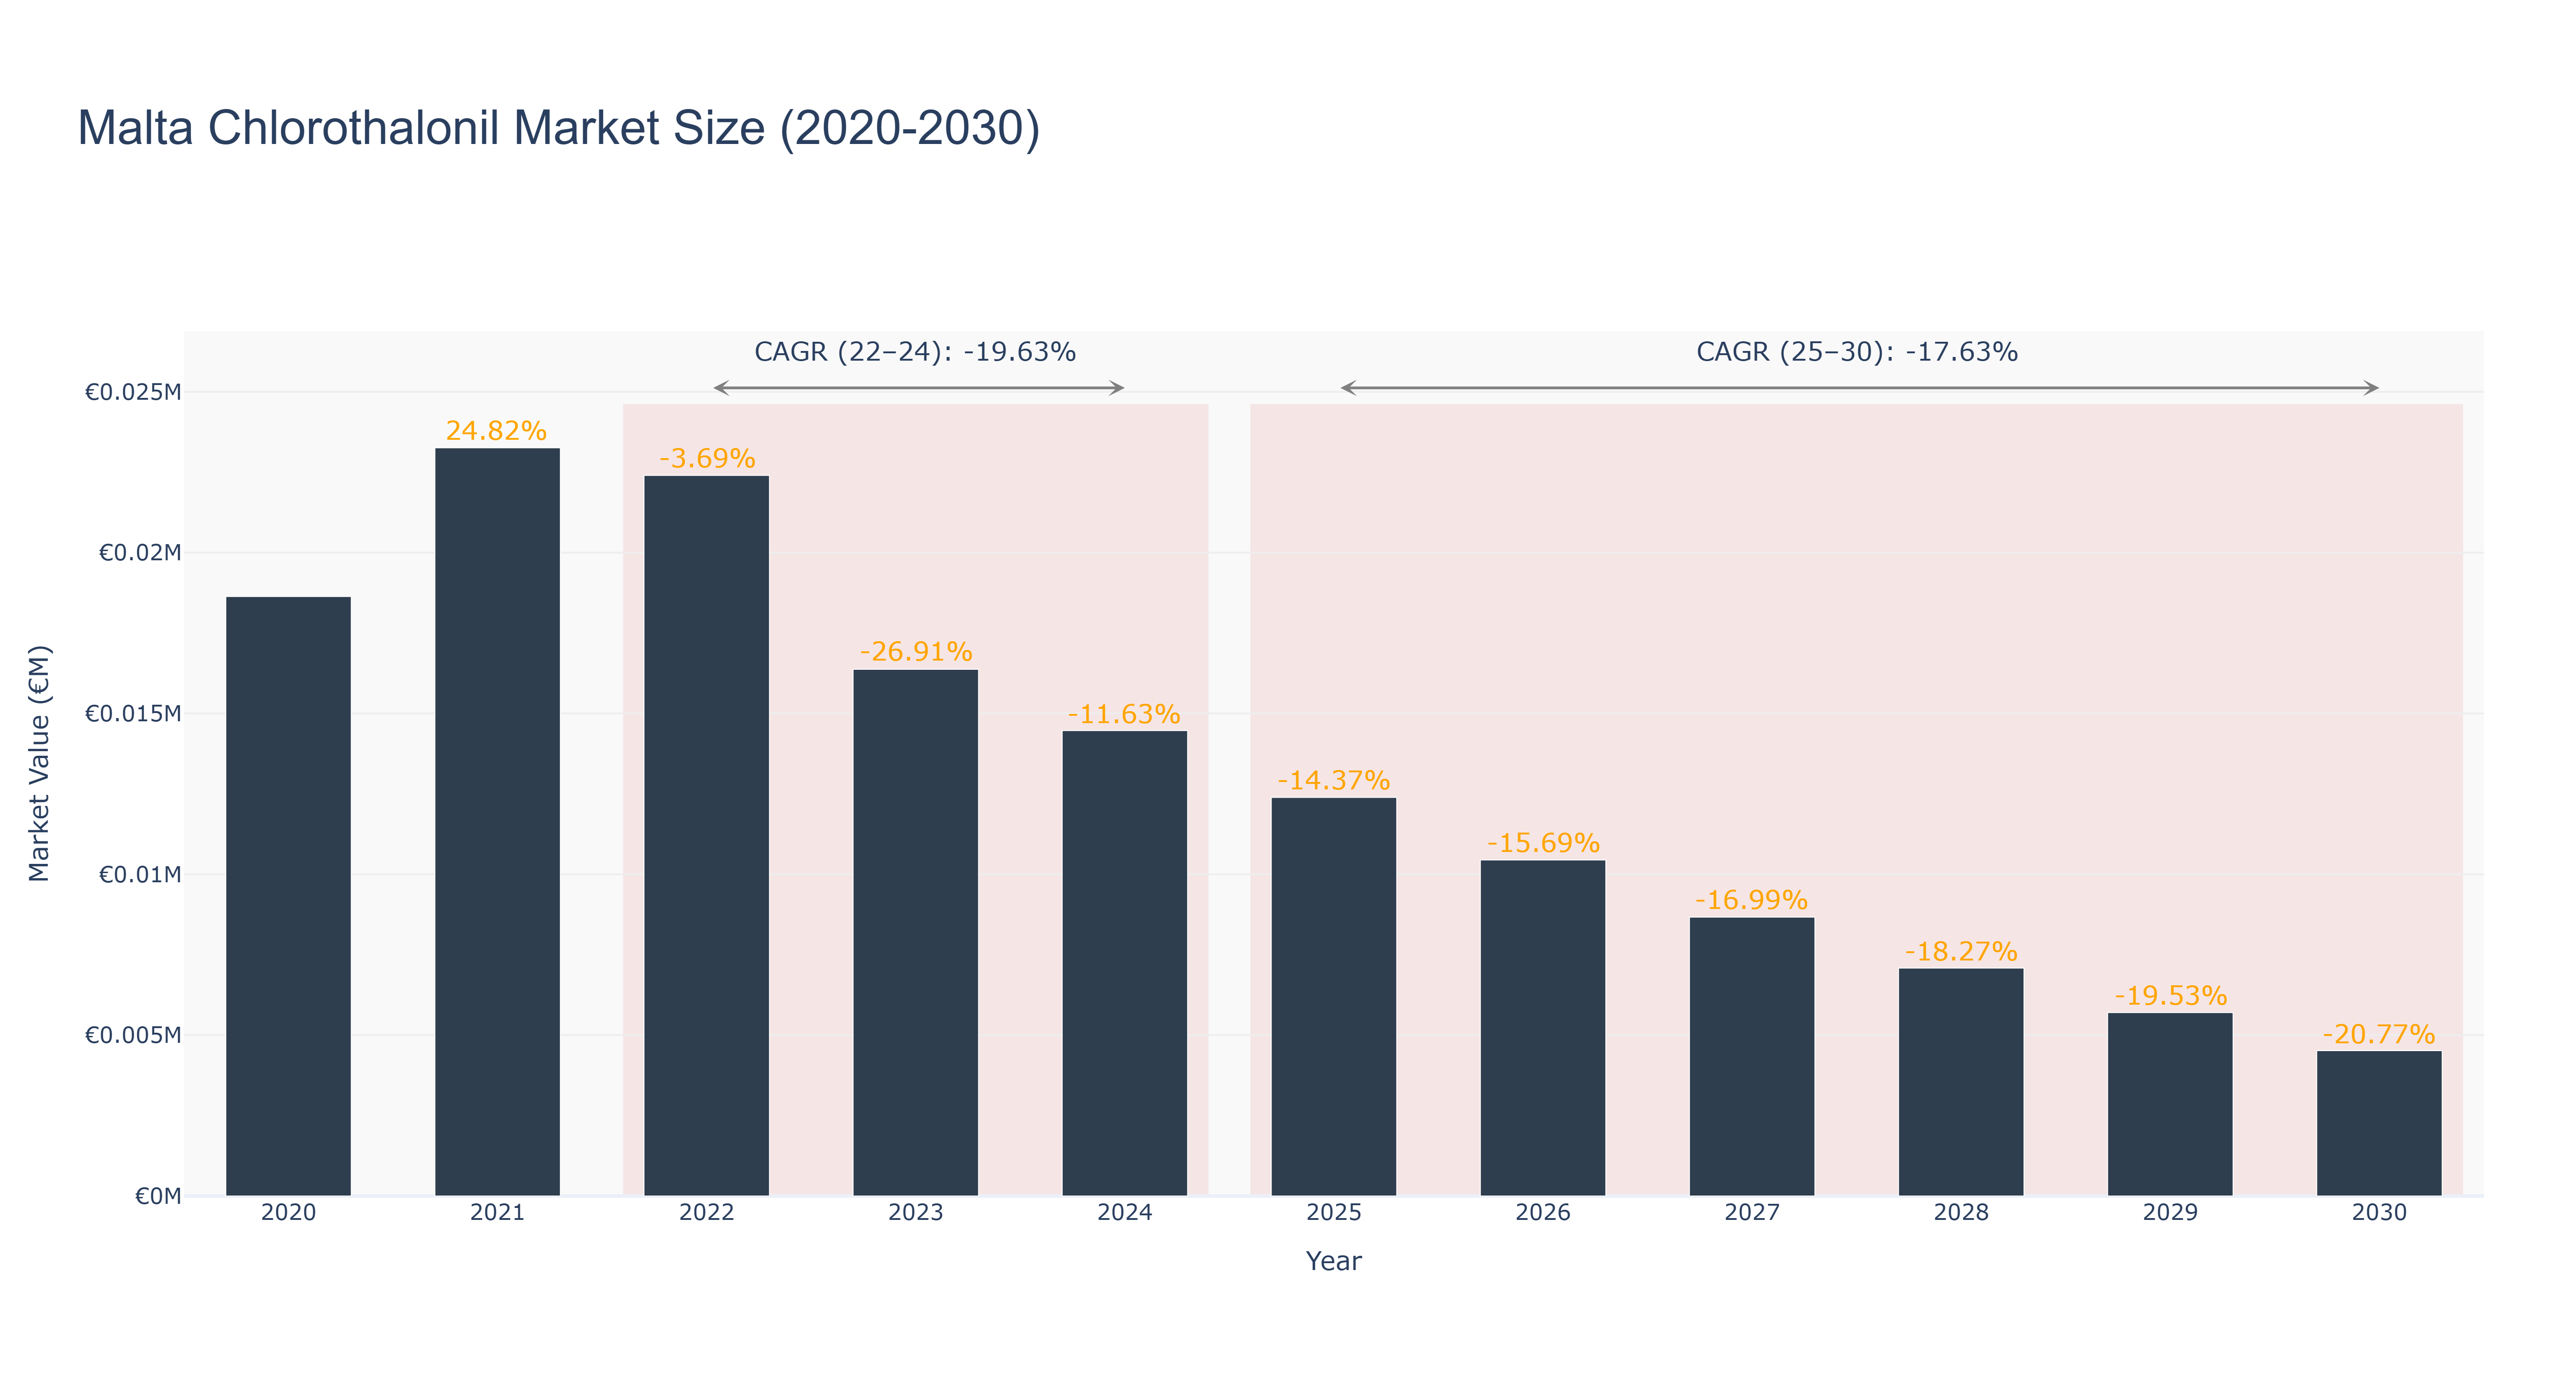
The Malta Chlorothalonil Market is experiencing a significant downward trajectory, marked by notable fluctuations in market size. The peak market size was recorded in 2021 at €23.26 thousand, but subsequent years have seen a decline, with 2022 at €22.40 thousand and 2023 dropping sharply to €16.37 thousand. The actual CAGR from 2022 to 2024 stands at -19.63%, reflecting challenges such as regulatory pressures and reduced agricultural demand. Looking ahead, the forecasted period from 2025 to 2030 predicts a continued contraction, with market sizes projected to decrease from €12.39 thousand in 2025 to €4.52 thousand by 2030, resulting in a CAGR of -17.63%. This decline may be driven by increasing environmental regulations and a shift towards alternative pest management solutions. Without significant industry innovations or regulatory changes, the market is likely to face further contraction in the coming years.
Malta Chlorothalonil Market: Production & Trade Performance (2019-2025)
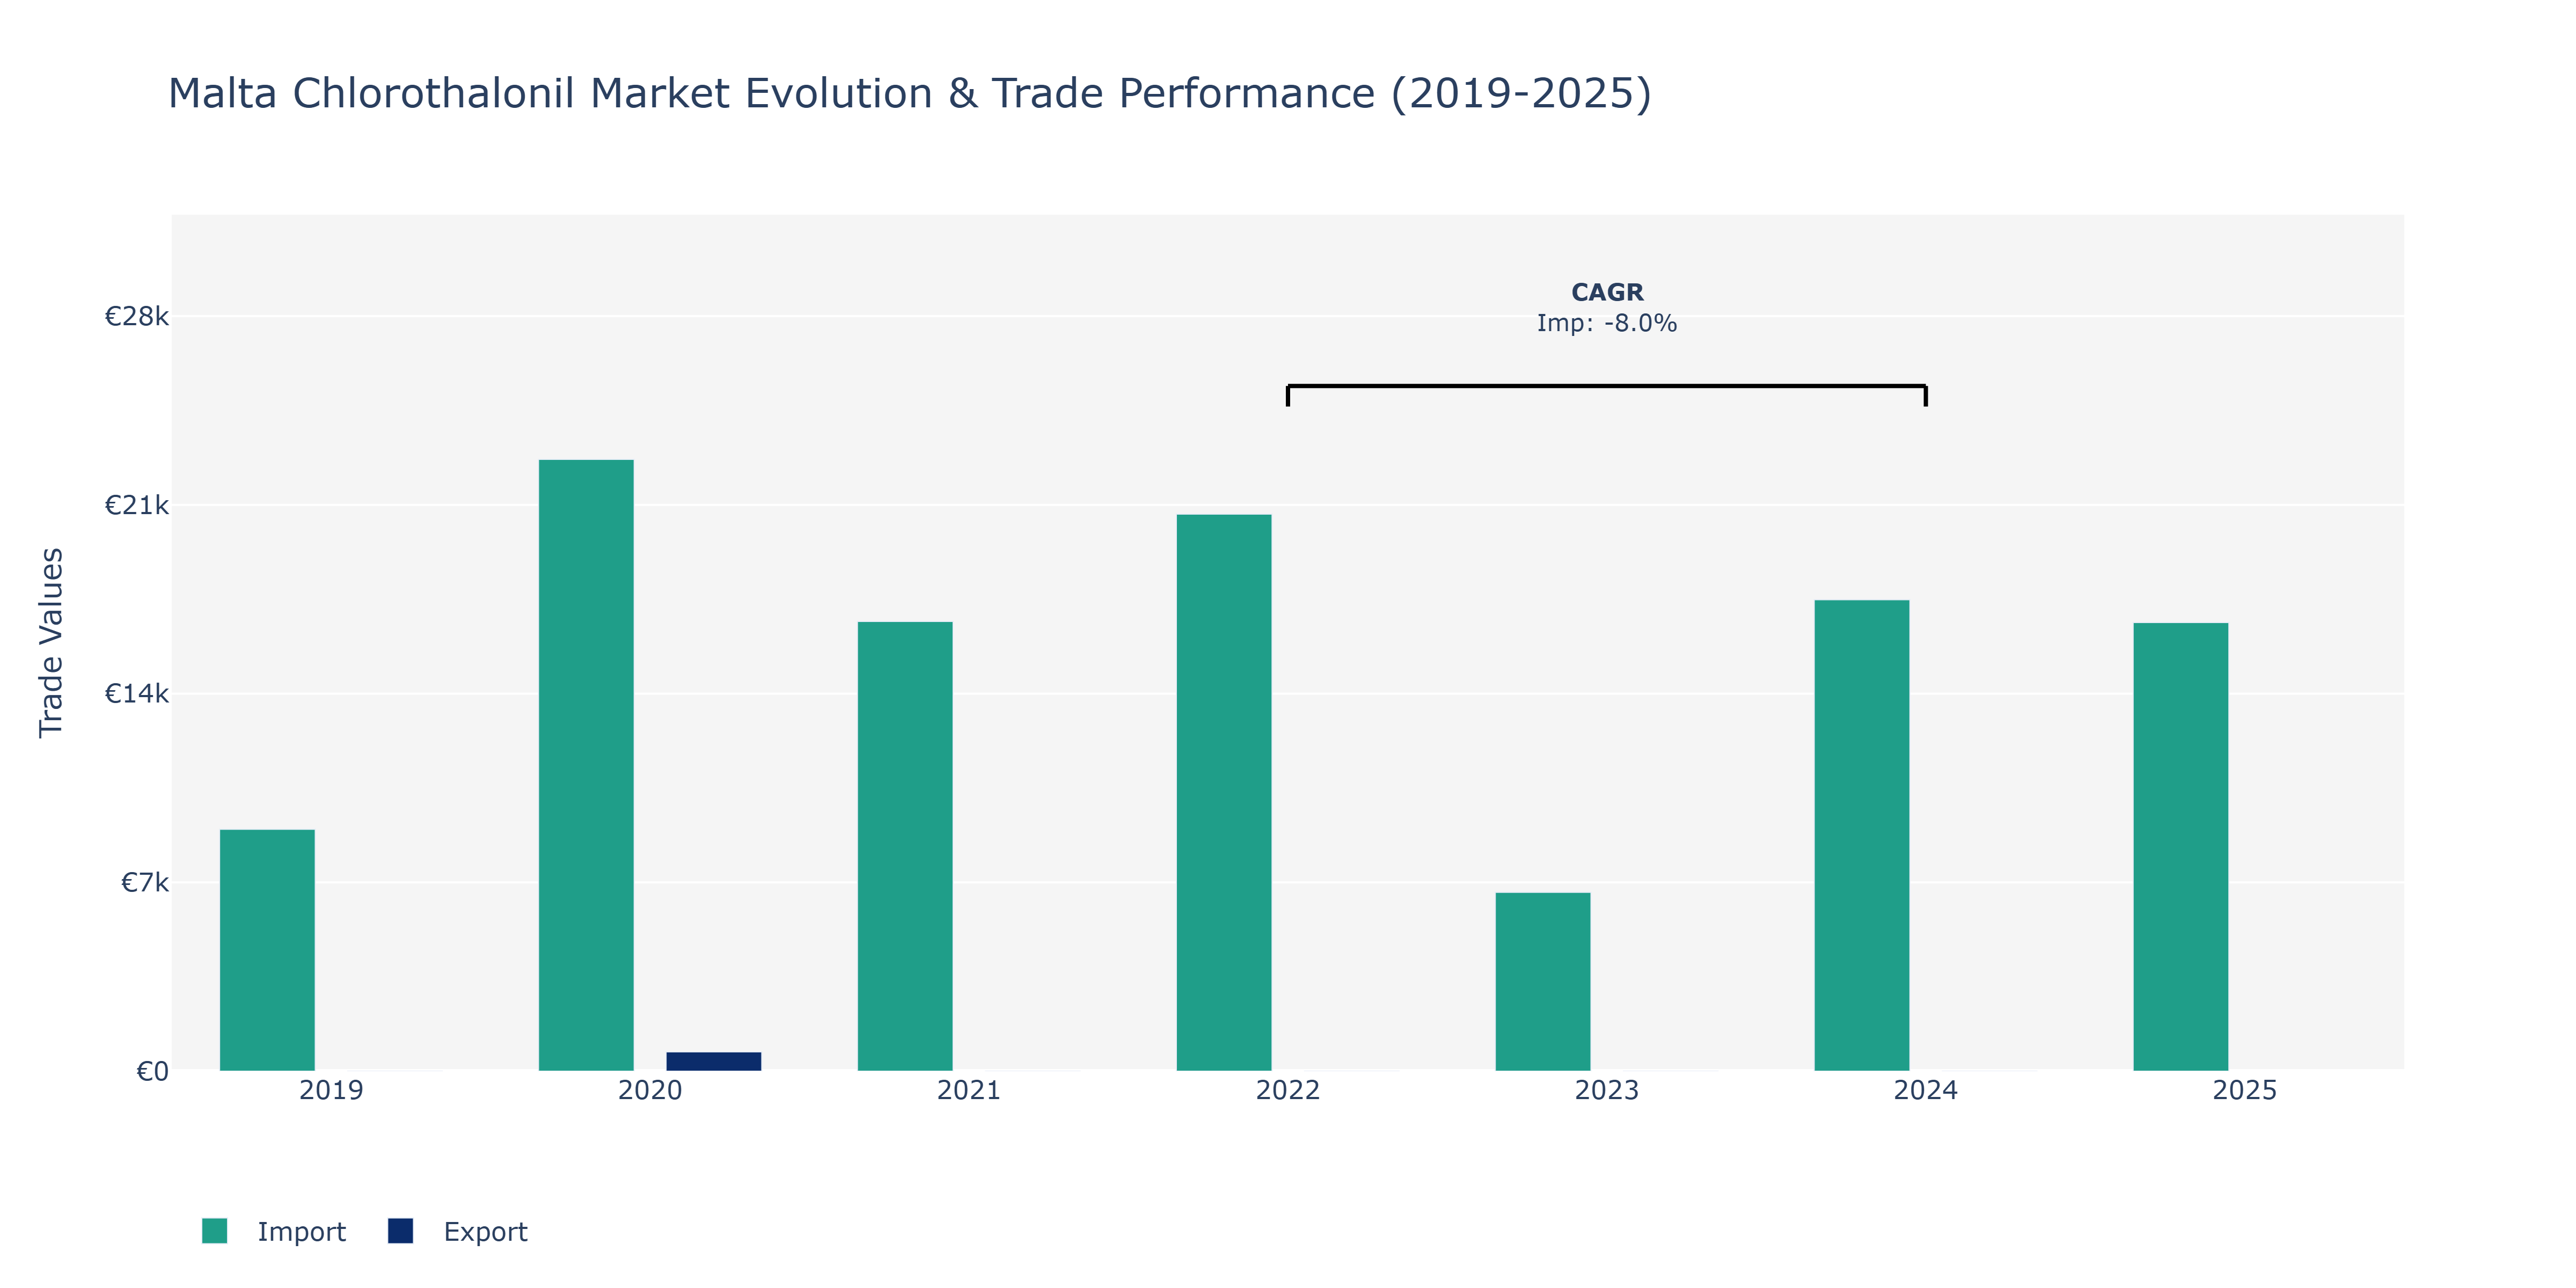
The Malta Chlorothalonil Market witnessed notable fluctuations in Import value over the years, with a peak import value observed in 2022 at €20.66 thousand, followed by a significant decline in 2023 to €6.63 thousand. Despite a partial recovery in 2024 to €17.48 thousand, import levels in 2025 remained relatively stable at €16.64 thousand. On the export front, the market recorded an export value of €719 thousand in 2020, with no Export value available for other years. The fluctuations in imports can be attributed to various factors such as changes in demand from the agricultural sector, regulatory developments impacting pesticide imports, and global market dynamics influencing trade patterns. As Malta aims to strengthen its environmental regulations, shifts towards more sustainable agricultural practices could potentially impact the future import trends of chlorothalonil in the market, prompting stakeholders to adapt their strategies accordingly.
Key Highlights of the Report:
- Malta Chlorothalonil Market Outlook
- Market Size of Malta Chlorothalonil Market, 2025
- Forecast of Malta Chlorothalonil Market, 2032
- Historical Data and Forecast of Malta Chlorothalonil Revenues & Volume for the Period 2022 - 2032
- Malta Chlorothalonil Market Trend Evolution
- Malta Chlorothalonil Market Drivers and Challenges
- Malta Chlorothalonil Price Trends
- Malta Chlorothalonil Porter's Five Forces
- Malta Chlorothalonil Industry Life Cycle
- Historical Data and Forecast of Malta Chlorothalonil Market Revenues & Volume By Type for the Period 2022 - 2032
- Historical Data and Forecast of Malta Chlorothalonil Market Revenues & Volume By 98% Chlorothalonil for the Period 2022 - 2032
- Historical Data and Forecast of Malta Chlorothalonil Market Revenues & Volume By 96% Chlorothalonil for the Period 2022 - 2032
- Historical Data and Forecast of Malta Chlorothalonil Market Revenues & Volume By 90% Chlorothalonil for the Period 2022 - 2032
- Historical Data and Forecast of Malta Chlorothalonil Market Revenues & Volume By Product for the Period 2022 - 2032
- Historical Data and Forecast of Malta Chlorothalonil Market Revenues & Volume By Wettable Powder for the Period 2022 - 2032
- Historical Data and Forecast of Malta Chlorothalonil Market Revenues & Volume By Suspended Agents for the Period 2022 - 2032
- Historical Data and Forecast of Malta Chlorothalonil Market Revenues & Volume By Others (Granular & Dilute) for the Period 2022 - 2032
- Historical Data and Forecast of Malta Chlorothalonil Market Revenues & Volume By Crop Type for the Period 2022 - 2032
- Historical Data and Forecast of Malta Chlorothalonil Market Revenues & Volume By Vegetables & Fruits for the Period 2022 - 2032
- Historical Data and Forecast of Malta Chlorothalonil Market Revenues & Volume By Oilseeds & Pulses for the Period 2022 - 2032
- Historical Data and Forecast of Malta Chlorothalonil Market Revenues & Volume By Turfs & Ornamentals for the Period 2022 - 2032
- Historical Data and Forecast of Malta Chlorothalonil Market Revenues & Volume By Cereals & Grains for the Period 2022 - 2032
- Malta Chlorothalonil Import Export Trade Statistics
- Market Opportunity Assessment By Type
- Market Opportunity Assessment By Product
- Market Opportunity Assessment By Crop Type
- Malta Chlorothalonil Top Companies Market Share
- Malta Chlorothalonil Competitive Benchmarking By Technical and Operational Parameters
- Malta Chlorothalonil Company Profiles
- Malta Chlorothalonil Key Strategic Recommendations
Frequently Asked Questions About the Market Study (FAQs):
6Wresearch actively monitors the Malta Chlorothalonil Market and publishes its comprehensive annual report, highlighting emerging trends, growth drivers, revenue analysis, and forecast outlook. Our insights help businesses to make data-backed strategic decisions with ongoing market dynamics. Our analysts track relevent industries related to the Malta Chlorothalonil Market, allowing our clients with actionable intelligence and reliable forecasts tailored to emerging regional needs.
Yes, we provide customisation as per your requirements. To learn more, feel free to contact us on sales@6wresearch.com
1 Executive Summary |
2 Introduction |
2.1 Key Highlights of the Report |
2.2 Report Description |
2.3 Market Scope & Segmentation |
2.4 Research Methodology |
2.5 Assumptions |
3 Malta Chlorothalonil Market Overview |
3.1 Malta Country Macro Economic Indicators |
3.2 Malta Chlorothalonil Market Revenues & Volume, 2022 & 2032F |
3.3 Malta Chlorothalonil Market - Industry Life Cycle |
3.4 Malta Chlorothalonil Market - Porter's Five Forces |
3.5 Malta Chlorothalonil Market Revenues & Volume Share, By Type, 2022 & 2032F |
3.6 Malta Chlorothalonil Market Revenues & Volume Share, By Product, 2022 & 2032F |
3.7 Malta Chlorothalonil Market Revenues & Volume Share, By Crop Type, 2022 & 2032F |
4 Malta Chlorothalonil Market Dynamics |
4.1 Impact Analysis |
4.2 Market Drivers |
4.3 Market Restraints |
5 Malta Chlorothalonil Market Trends |
6 Malta Chlorothalonil Market, By Types |
6.1 Malta Chlorothalonil Market, By Type |
6.1.1 Overview and Analysis |
6.1.2 Malta Chlorothalonil Market Revenues & Volume, By Type, 2022 - 2032F |
6.1.3 Malta Chlorothalonil Market Revenues & Volume, By 98% Chlorothalonil, 2022 - 2032F |
6.1.4 Malta Chlorothalonil Market Revenues & Volume, By 96% Chlorothalonil, 2022 - 2032F |
6.1.5 Malta Chlorothalonil Market Revenues & Volume, By 90% Chlorothalonil, 2022 - 2032F |
6.2 Malta Chlorothalonil Market, By Product |
6.2.1 Overview and Analysis |
6.2.2 Malta Chlorothalonil Market Revenues & Volume, By Wettable Powder, 2022 - 2032F |
6.2.3 Malta Chlorothalonil Market Revenues & Volume, By Suspended Agents, 2022 - 2032F |
6.2.4 Malta Chlorothalonil Market Revenues & Volume, By Others (Granular & Dilute), 2022 - 2032F |
6.3 Malta Chlorothalonil Market, By Crop Type |
6.3.1 Overview and Analysis |
6.3.2 Malta Chlorothalonil Market Revenues & Volume, By Vegetables & Fruits, 2022 - 2032F |
6.3.3 Malta Chlorothalonil Market Revenues & Volume, By Oilseeds & Pulses, 2022 - 2032F |
6.3.4 Malta Chlorothalonil Market Revenues & Volume, By Turfs & Ornamentals, 2022 - 2032F |
6.3.5 Malta Chlorothalonil Market Revenues & Volume, By Cereals & Grains, 2022 - 2032F |
7 Malta Chlorothalonil Market Import-Export Trade Statistics |
7.1 Malta Chlorothalonil Market Export to Major Countries |
7.2 Malta Chlorothalonil Market Imports from Major Countries |
8 Malta Chlorothalonil Market Key Performance Indicators |
9 Malta Chlorothalonil Market - Opportunity Assessment |
9.1 Malta Chlorothalonil Market Opportunity Assessment, By Type, 2022 & 2032F |
9.2 Malta Chlorothalonil Market Opportunity Assessment, By Product, 2022 & 2032F |
9.3 Malta Chlorothalonil Market Opportunity Assessment, By Crop Type, 2022 & 2032F |
10 Malta Chlorothalonil Market - Competitive Landscape |
10.1 Malta Chlorothalonil Market Revenue Share, By Companies, 2025 |
10.2 Malta Chlorothalonil Market Competitive Benchmarking, By Operating and Technical Parameters |
11 Company Profiles |
12 Recommendations |
13 Disclaimer |
Global Go To Market Strategy - 2030
Export potential enables firms to identify high-growth global markets with greater confidence by combining advanced trade intelligence with a structured quantitative methodology. The framework analyzes emerging demand trends and country-level import patterns while integrating macroeconomic and trade datasets such as GDP and population forecasts, bilateral import–export flows, tariff structures, elasticity differentials between developed and developing economies, geographic distance, and import demand projections. Using weighted trade values from 2020–2024 as the base period to project country-to-country export potential for 2030, these inputs are operationalized through calculated drivers such as gravity model parameters, tariff impact factors, and projected GDP per-capita growth. Through an analysis of hidden potentials, demand hotspots, and market conditions that are most favorable to success, this method enables firms to focus on target countries, maximize returns, and global expansion with data, backed by accuracy.
By factoring in the projected importer demand gap that is currently unmet and could be potential opportunity, it identifies the potential for the Exporter (Country) among 190 countries, against the general trade analysis, which identifies the biggest importer or exporter.
To discover high-growth global markets and optimize your business strategy:
Click Here
Pricing
- Single User License$ 1,995
- Department License$ 2,400
- Site License$ 3,120
- Global License$ 3,795

Leadership Perspectives from Industry Events
Search
Thought Leadership and Analyst Meet


Our Clients
6WResearch In News
- India Export Attractiveness Tracker 2026
- India Air Conditioner Market Set for Strong Rebound in 2026 After Weather-Led Correction and GST-Driven Recovery: 6Wresearch
- ADAS in India: How Automatic Emergency Braking, Blind Spot Detection & Driver Monitoring are Transforming Road Safety
- Doha a strategic location for EV manufacturing hub: IPA Qatar
- Demand for luxury TVs surging in the GCC, says Samsung
- Empowering Growth: The Thriving Journey of Bangladesh’s Cable Industry
Latest Reports
- Nicaragua RPG Gaming Market (2026-2032)
- New Zealand RPG Gaming Market (2026-2032)
- Netherlands RPG Gaming Market (2026-2032)
- Nauru RPG Gaming Market (2026-2032)
- Namibia RPG Gaming Market (2026-2032)
- Mozambique RPG Gaming Market (2026-2032)
- Montenegro RPG Gaming Market (2026-2032)
- Mongolia RPG Gaming Market (2026-2032)
- Monaco RPG Gaming Market (2026-2032)
- Micronesia RPG Gaming Market (2026-2032)
Industry Events and Analyst Meet

EV India Expo 2026

HIMTEX 2026

India Refining Summit 2026

India EV Show 2026

EV tech India Expo 2026
Whitepaper
- Middle East & Africa Commercial Security Market Click here to view more.
- Middle East & Africa Fire Safety Systems & Equipment Market Click here to view more.
- GCC Drone Market Click here to view more.
- Middle East Lighting Fixture Market Click here to view more.
- GCC Physical & Perimeter Security Market Click here to view more.