Malta Photographic Paper Market (2026-2032) | Analysis, Growth, Companies, Trends, Revenue, Size, Industry, Outlook, Share, Forecast, Value & Segmentation
Market Forecast By Material Type (Paper, Fiber - Based Papers (FB), Resin - Coated Papers (RC), Plastic, Baryta Layer), By Thickness (Less than 80 GSM, 80 GSM to 150 GSM, 150 GSM to 250 GSM, 250 GSM & Above), By Distribution Channel (Hypermarket / Supermarket, Retail Stores, Convenience Stores, E-Commerce), By End-use (Household, Commercial, Others) And Competitive Landscape
| Product Code: ETC4756544 | Publication Date: Nov 2023 | Updated Date: Apr 2026 | Product Type: Market Research Report | |
| Publisher: 6Wresearch | Author: Shubham Padhi | No. of Pages: 60 | No. of Figures: 30 | No. of Tables: 5 |
Malta Photographic Paper Market Size (2020-2030)
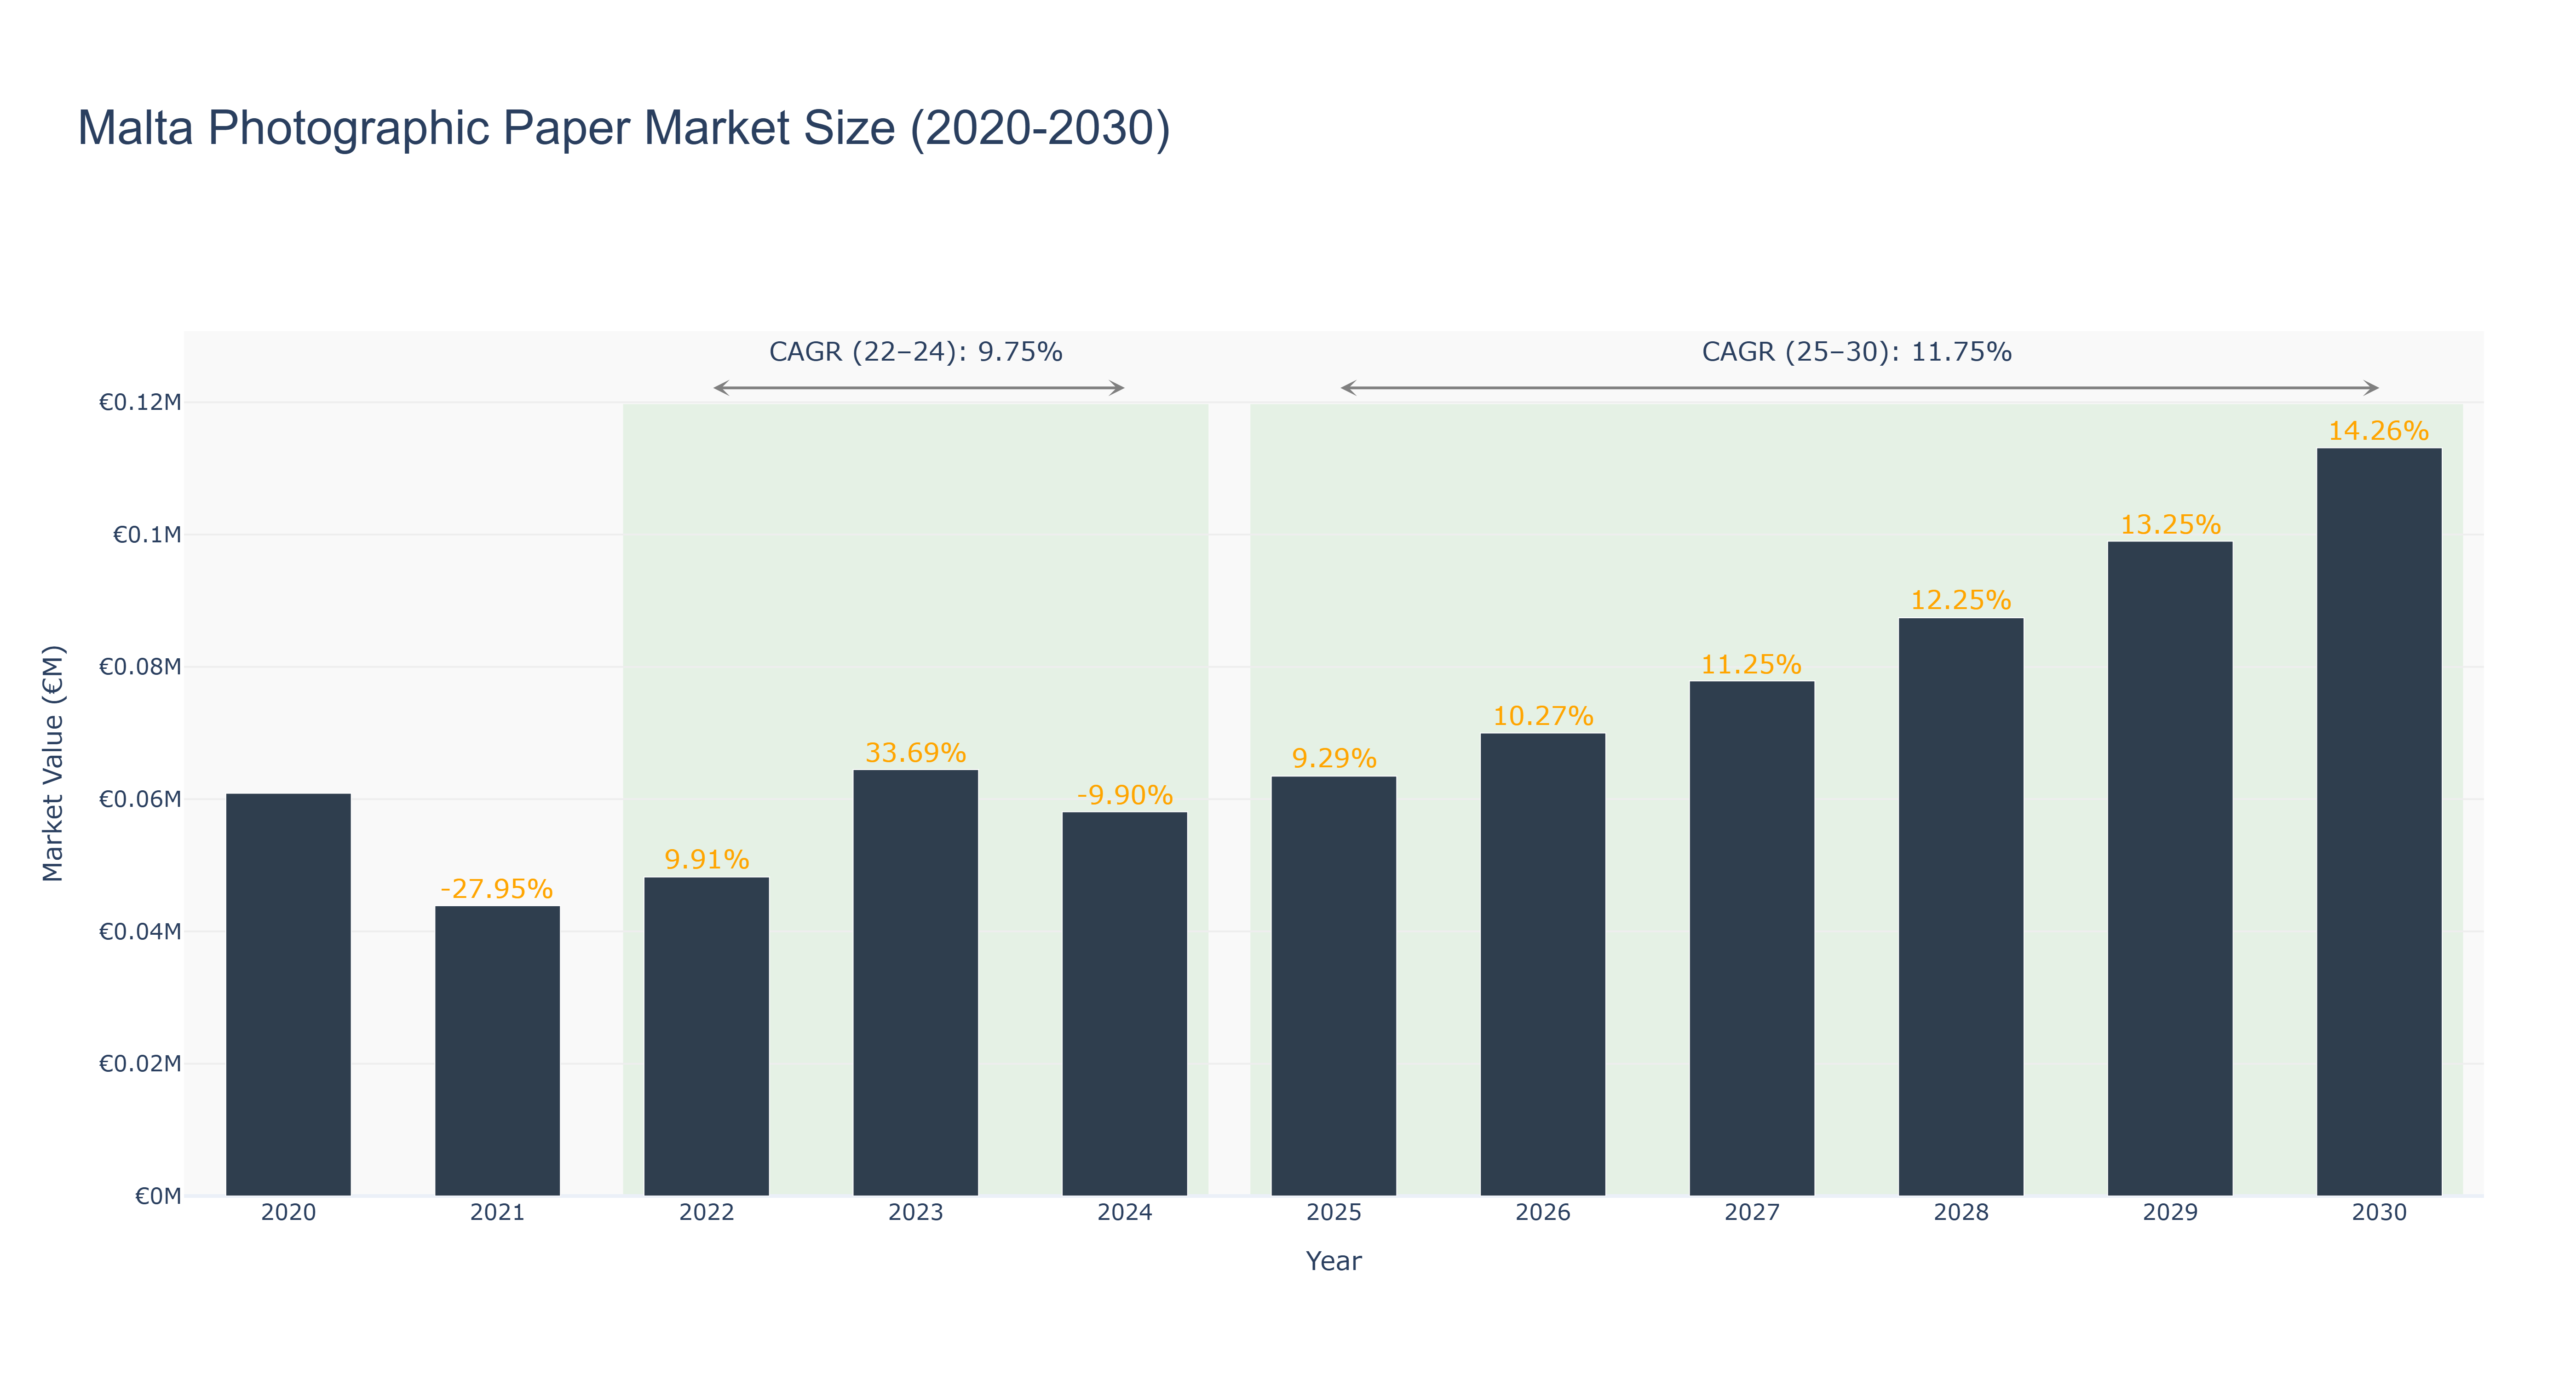
The Malta Photographic Paper Market experienced considerable fluctuations from 2020 to 2024, peaking in 2020 at €60.89 thousand before declining to €43.87 thousand in 2021, reflecting a significant contraction of -27.95%. Following this, the market rebounded, reaching €64.47 thousand in 2023 with a remarkable growth rate of 33.69%. However, a downturn occurred in 2024, with the market size dropping to €58.08 thousand, marking a -9.90% decline. The actual CAGR for this period (2022-2024) stands at 9.75%. Looking ahead, the forecasted period (2025-2030) indicates a more stable growth trajectory, with an anticipated CAGR of 11.75%. The market is projected to reach €113.11 thousand by 2030, driven by increasing digital photography trends, advancements in printing technologies, and a resurgence in consumer interest in physical photo products. These macro drivers will likely support ongoing market expansion despite past volatility.
Malta Photographic Paper Market: Production & Trade Performance (2019-2025)
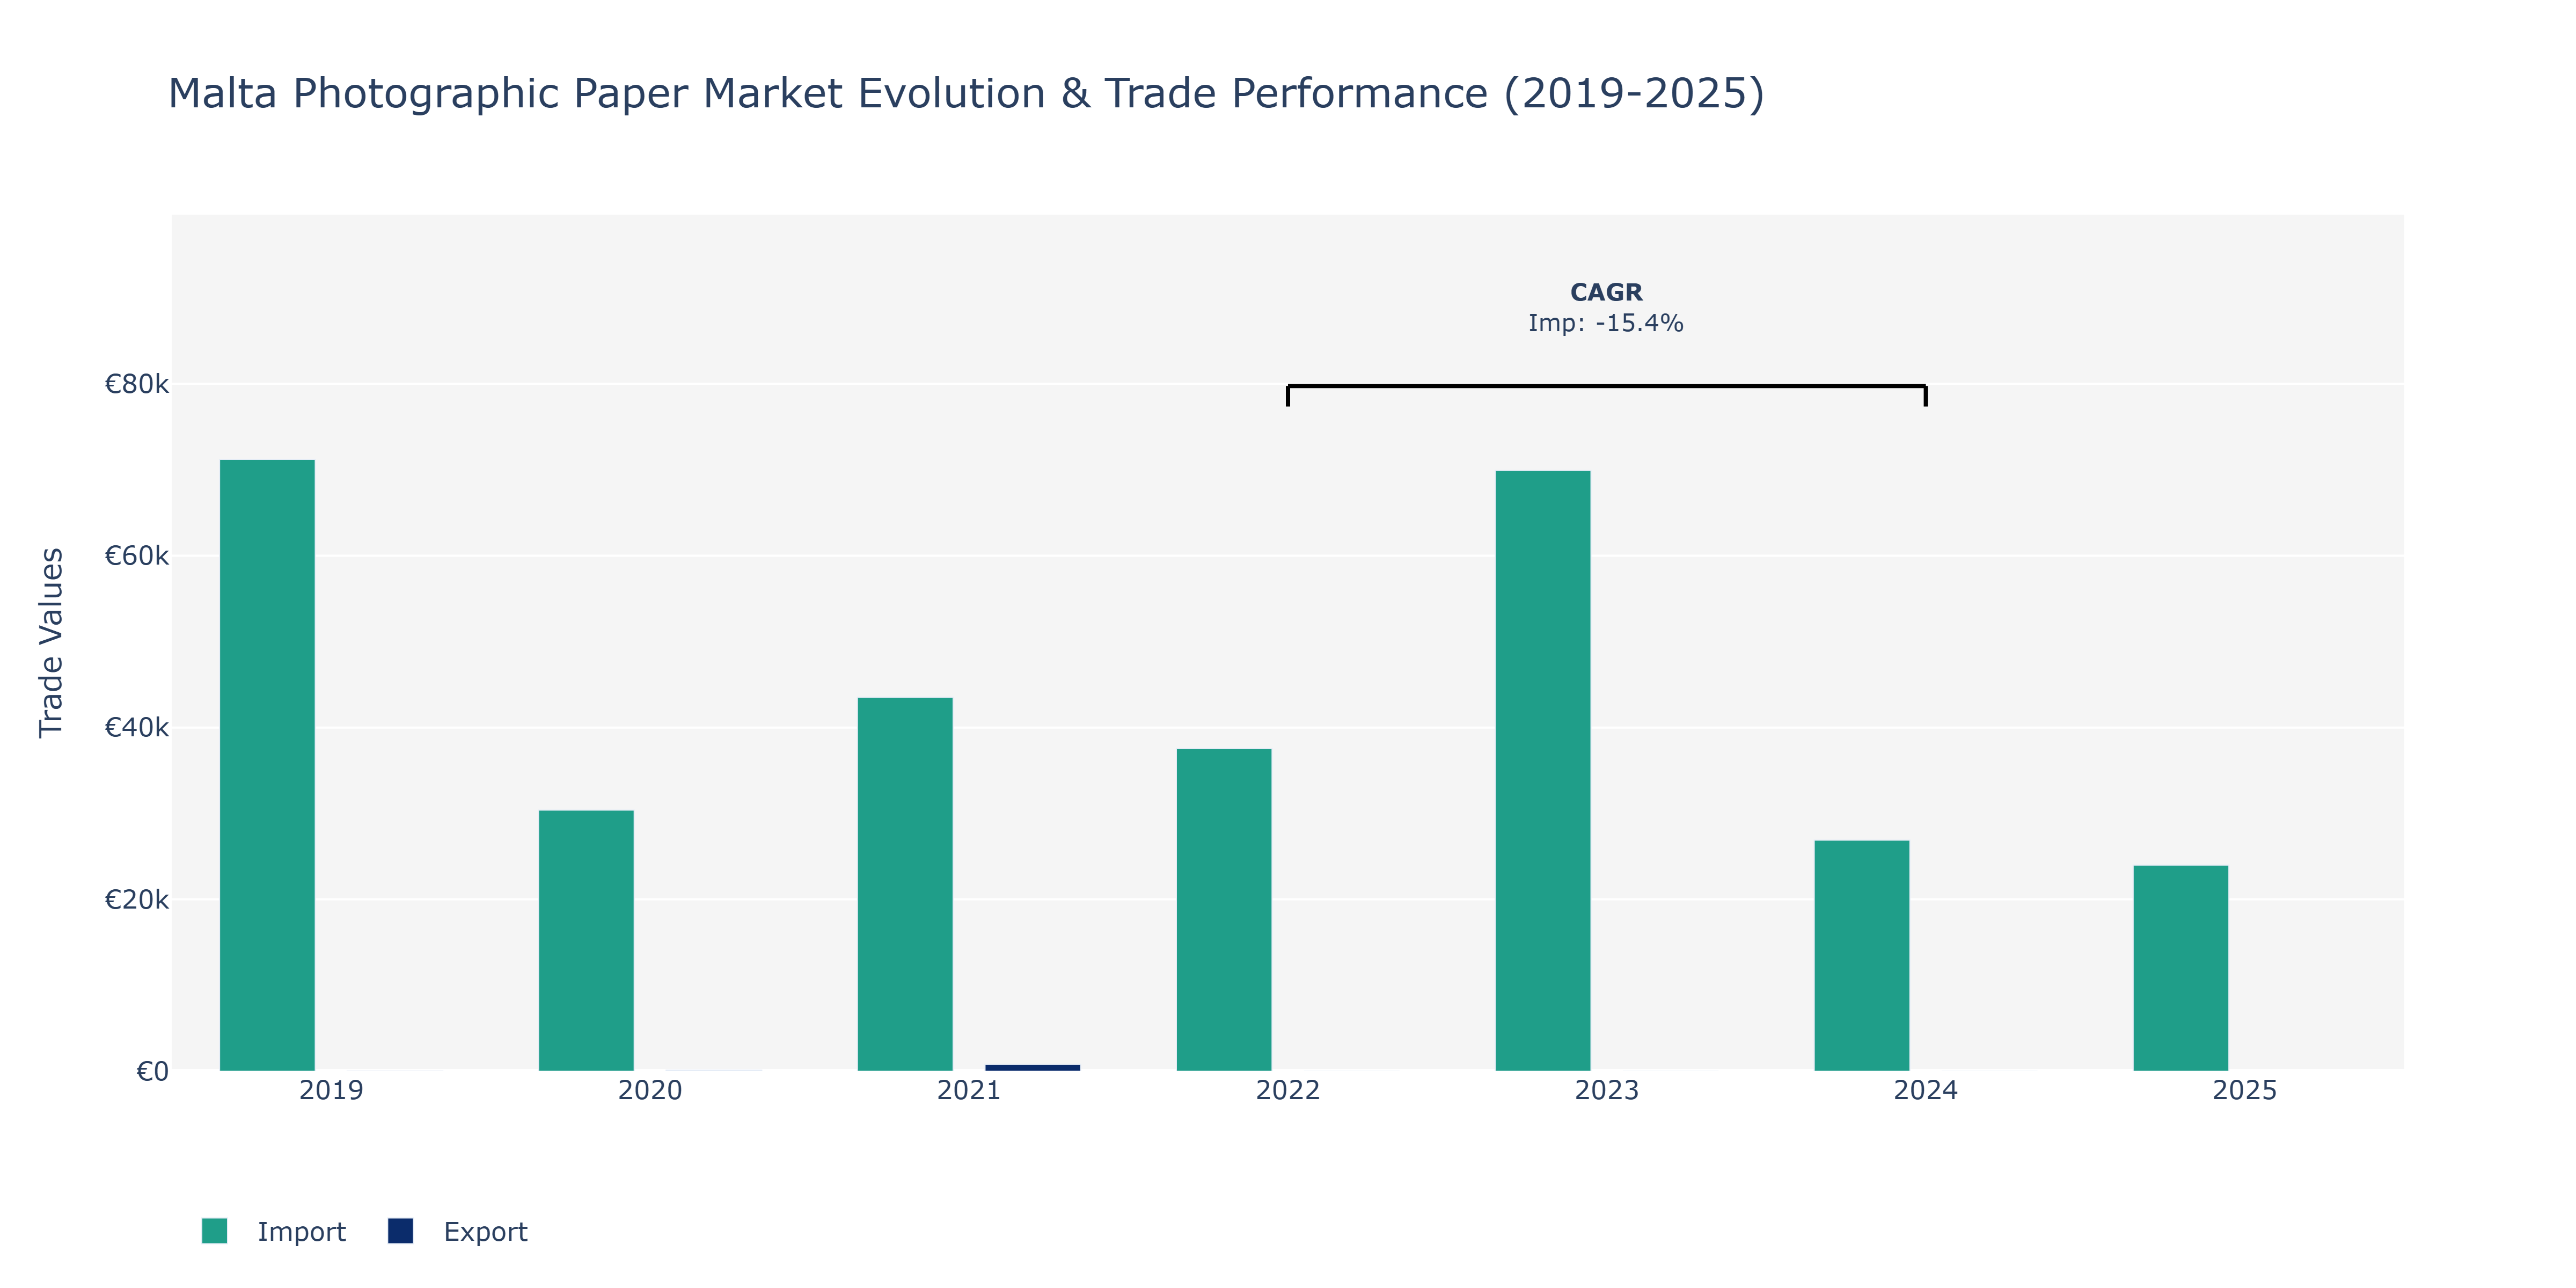
The Malta Photographic Paper Market witnessed notable variations in both exports and imports over the years. In 2019, exports were at €20, surging to €120 in 2020, and experiencing a substantial increase to €809 in 2021. On the other hand, imports followed a different trajectory, amounting to €71.21 thousand in 2019, which then decreased to €30.39 thousand in 2020, and further fluctuated in the following years, with values of €43.51 thousand in 2021, €37.53 thousand in 2022, €69.91 thousand in 2023, €26.9 thousand in 2024, and €23.98 thousand in 2025. The decline in import values from 2022 to 2024 with a CAGR of -15.35% can be attributed to changes in the international photographic paper market, possibly influenced by shifts in global supply chains, trade agreements, or technological advancements impacting demand levels for photographic paper products.
Key Highlights of the Report:
- Malta Photographic Paper Market Outlook
- Market Size of Malta Photographic Paper Market, 2025
- Forecast of Malta Photographic Paper Market, 2032
- Historical Data and Forecast of Malta Photographic Paper Revenues & Volume for the Period 2022 - 2032F
- Malta Photographic Paper Market Trend Evolution
- Malta Photographic Paper Market Drivers and Challenges
- Malta Photographic Paper Price Trends
- Malta Photographic Paper Porter`s Five Forces
- Malta Photographic Paper Industry Life Cycle
- Historical Data and Forecast of Malta Photographic Paper Market Revenues & Volume By Material Type for the Period 2022 - 2032F
- Historical Data and Forecast of Malta Photographic Paper Market Revenues & Volume By Paper for the Period 2022 - 2032F
- Historical Data and Forecast of Malta Photographic Paper Market Revenues & Volume By Fiber - Based Papers (FB) for the Period 2022 - 2032F
- Historical Data and Forecast of Malta Photographic Paper Market Revenues & Volume By Resin - Coated Papers (RC) for the Period 2022 - 2032F
- Historical Data and Forecast of Malta Photographic Paper Market Revenues & Volume By Plastic for the Period 2022 - 2032F
- Historical Data and Forecast of Malta Photographic Paper Market Revenues & Volume By Baryta Layer for the Period 2022 - 2032F
- Historical Data and Forecast of Malta Photographic Paper Market Revenues & Volume By Thickness for the Period 2022 - 2032F
- Historical Data and Forecast of Malta Photographic Paper Market Revenues & Volume By Less than 80 GSM for the Period 2022 - 2032F
- Historical Data and Forecast of Malta Photographic Paper Market Revenues & Volume By 80 GSM to 150 GSM for the Period 2022 - 2032F
- Historical Data and Forecast of Malta Photographic Paper Market Revenues & Volume By 150 GSM to 250 GSM for the Period 2022 - 2032F
- Historical Data and Forecast of Malta Photographic Paper Market Revenues & Volume By 250 GSM & Above for the Period 2022 - 2032F
- Historical Data and Forecast of Malta Photographic Paper Market Revenues & Volume By Distribution Channel for the Period 2022 - 2032F
- Historical Data and Forecast of Malta Photographic Paper Market Revenues & Volume By Hypermarket / Supermarket for the Period 2022 - 2032F
- Historical Data and Forecast of Malta Photographic Paper Market Revenues & Volume By Retail Stores for the Period 2022 - 2032F
- Historical Data and Forecast of Malta Photographic Paper Market Revenues & Volume By Convenience Stores for the Period 2022 - 2032F
- Historical Data and Forecast of Malta Photographic Paper Market Revenues & Volume By E-Commerce for the Period 2022 - 2032F
- Historical Data and Forecast of Malta Photographic Paper Market Revenues & Volume By End-use for the Period 2022 - 2032F
- Historical Data and Forecast of Malta Photographic Paper Market Revenues & Volume By Household for the Period 2022 - 2032F
- Historical Data and Forecast of Malta Photographic Paper Market Revenues & Volume By Commercial for the Period 2022 - 2032F
- Historical Data and Forecast of Malta Photographic Paper Market Revenues & Volume By Others for the Period 2022 - 2032F
- Malta Photographic Paper Import Export Trade Statistics
- Market Opportunity Assessment By Material Type
- Market Opportunity Assessment By Thickness
- Market Opportunity Assessment By Distribution Channel
- Market Opportunity Assessment By End-use
- Malta Photographic Paper Top Companies Market Share
- Malta Photographic Paper Competitive Benchmarking By Technical and Operational Parameters
- Malta Photographic Paper Company Profiles
- Malta Photographic Paper Key Strategic Recommendations
Frequently Asked Questions About the Market Study (FAQs):
6Wresearch actively monitors the Malta Photographic Paper Market and publishes its comprehensive annual report, highlighting emerging trends, growth drivers, revenue analysis, and forecast outlook. Our insights help businesses to make data-backed strategic decisions with ongoing market dynamics. Our analysts track relevent industries related to the Malta Photographic Paper Market, allowing our clients with actionable intelligence and reliable forecasts tailored to emerging regional needs.
Yes, we provide customisation as per your requirements. To learn more, feel free to contact us on sales@6wresearch.com
1 Executive Summary |
2 Introduction |
2.1 Key Highlights of the Report |
2.2 Report Description |
2.3 Market Scope & Segmentation |
2.4 Research Methodology |
2.5 Assumptions |
3 Malta Photographic Paper Market Overview |
3.1 Malta Country Macro Economic Indicators |
3.2 Malta Photographic Paper Market Revenues & Volume, 2022 & 2032F |
3.3 Malta Photographic Paper Market - Industry Life Cycle |
3.4 Malta Photographic Paper Market - Porter's Five Forces |
3.5 Malta Photographic Paper Market Revenues & Volume Share, By Material Type, 2022 & 2032F |
3.6 Malta Photographic Paper Market Revenues & Volume Share, By Thickness, 2022 & 2032F |
3.7 Malta Photographic Paper Market Revenues & Volume Share, By Distribution Channel, 2022 & 2032F |
3.8 Malta Photographic Paper Market Revenues & Volume Share, By End-use, 2022 & 2032F |
4 Malta Photographic Paper Market Dynamics |
4.1 Impact Analysis |
4.2 Market Drivers |
4.3 Market Restraints |
5 Malta Photographic Paper Market Trends |
6 Malta Photographic Paper Market Segmentations |
6.1 Malta Photographic Paper Market, By Material Type |
6.1.1 Overview and Analysis |
6.1.2 Malta Photographic Paper Market Revenues & Volume, By Paper, 2022 - 2032F |
6.1.3 Malta Photographic Paper Market Revenues & Volume, By Fiber - Based Papers (FB), 2022 - 2032F |
6.1.4 Malta Photographic Paper Market Revenues & Volume, By Resin - Coated Papers (RC), 2022 - 2032F |
6.1.5 Malta Photographic Paper Market Revenues & Volume, By Plastic, 2022 - 2032F |
6.1.6 Malta Photographic Paper Market Revenues & Volume, By Baryta Layer, 2022 - 2032F |
6.2 Malta Photographic Paper Market, By Thickness |
6.2.1 Overview and Analysis |
6.2.2 Malta Photographic Paper Market Revenues & Volume, By Less than 80 GSM, 2022 - 2032F |
6.2.3 Malta Photographic Paper Market Revenues & Volume, By 80 GSM to 150 GSM, 2022 - 2032F |
6.2.4 Malta Photographic Paper Market Revenues & Volume, By 150 GSM to 250 GSM, 2022 - 2032F |
6.2.5 Malta Photographic Paper Market Revenues & Volume, By 250 GSM & Above, 2022 - 2032F |
6.3 Malta Photographic Paper Market, By Distribution Channel |
6.3.1 Overview and Analysis |
6.3.2 Malta Photographic Paper Market Revenues & Volume, By Hypermarket / Supermarket, 2022 - 2032F |
6.3.3 Malta Photographic Paper Market Revenues & Volume, By Retail Stores, 2022 - 2032F |
6.3.4 Malta Photographic Paper Market Revenues & Volume, By Convenience Stores, 2022 - 2032F |
6.3.5 Malta Photographic Paper Market Revenues & Volume, By E-Commerce, 2022 - 2032F |
6.4 Malta Photographic Paper Market, By End-use |
6.4.1 Overview and Analysis |
6.4.2 Malta Photographic Paper Market Revenues & Volume, By Household, 2022 - 2032F |
6.4.3 Malta Photographic Paper Market Revenues & Volume, By Commercial, 2022 - 2032F |
6.4.4 Malta Photographic Paper Market Revenues & Volume, By Others, 2022 - 2032F |
7 Malta Photographic Paper Market Import-Export Trade Statistics |
7.1 Malta Photographic Paper Market Export to Major Countries |
7.2 Malta Photographic Paper Market Imports from Major Countries |
8 Malta Photographic Paper Market Key Performance Indicators |
9 Malta Photographic Paper Market - Opportunity Assessment |
9.1 Malta Photographic Paper Market Opportunity Assessment, By Material Type, 2022 & 2032F |
9.2 Malta Photographic Paper Market Opportunity Assessment, By Thickness, 2022 & 2032F |
9.3 Malta Photographic Paper Market Opportunity Assessment, By Distribution Channel, 2022 & 2032F |
9.4 Malta Photographic Paper Market Opportunity Assessment, By End-use, 2022 & 2032F |
10 Malta Photographic Paper Market - Competitive Landscape |
10.1 Malta Photographic Paper Market Revenue Share, By Companies, 2025 |
10.2 Malta Photographic Paper Market Competitive Benchmarking, By Operating and Technical Parameters |
11 Company Profiles |
12 Recommendations | 13 Disclaimer |
Global Go To Market Strategy - 2030
Export potential enables firms to identify high-growth global markets with greater confidence by combining advanced trade intelligence with a structured quantitative methodology. The framework analyzes emerging demand trends and country-level import patterns while integrating macroeconomic and trade datasets such as GDP and population forecasts, bilateral import–export flows, tariff structures, elasticity differentials between developed and developing economies, geographic distance, and import demand projections. Using weighted trade values from 2020–2024 as the base period to project country-to-country export potential for 2030, these inputs are operationalized through calculated drivers such as gravity model parameters, tariff impact factors, and projected GDP per-capita growth. Through an analysis of hidden potentials, demand hotspots, and market conditions that are most favorable to success, this method enables firms to focus on target countries, maximize returns, and global expansion with data, backed by accuracy.
By factoring in the projected importer demand gap that is currently unmet and could be potential opportunity, it identifies the potential for the Exporter (Country) among 190 countries, against the general trade analysis, which identifies the biggest importer or exporter.
To discover high-growth global markets and optimize your business strategy:
Click Here
Pricing
- Single User License$ 1,995
- Department License$ 2,400
- Site License$ 3,120
- Global License$ 3,795

Leadership Perspectives from Industry Events
Search
Thought Leadership and Analyst Meet


Our Clients
6WResearch In News
- India Export Attractiveness Tracker 2026
- India Air Conditioner Market Set for Strong Rebound in 2026 After Weather-Led Correction and GST-Driven Recovery: 6Wresearch
- ADAS in India: How Automatic Emergency Braking, Blind Spot Detection & Driver Monitoring are Transforming Road Safety
- Doha a strategic location for EV manufacturing hub: IPA Qatar
- Demand for luxury TVs surging in the GCC, says Samsung
- Empowering Growth: The Thriving Journey of Bangladesh’s Cable Industry
Latest Reports
- Nicaragua RPG Gaming Market (2026-2032)
- New Zealand RPG Gaming Market (2026-2032)
- Netherlands RPG Gaming Market (2026-2032)
- Nauru RPG Gaming Market (2026-2032)
- Namibia RPG Gaming Market (2026-2032)
- Mozambique RPG Gaming Market (2026-2032)
- Montenegro RPG Gaming Market (2026-2032)
- Mongolia RPG Gaming Market (2026-2032)
- Monaco RPG Gaming Market (2026-2032)
- Micronesia RPG Gaming Market (2026-2032)
Industry Events and Analyst Meet

EV India Expo 2026

HIMTEX 2026

India Refining Summit 2026

India EV Show 2026

EV tech India Expo 2026
Whitepaper
- Middle East & Africa Commercial Security Market Click here to view more.
- Middle East & Africa Fire Safety Systems & Equipment Market Click here to view more.
- GCC Drone Market Click here to view more.
- Middle East Lighting Fixture Market Click here to view more.
- GCC Physical & Perimeter Security Market Click here to view more.