Malta Photolithography Equipment Market (2026-2032) | Forecast, Segmentation, Industry, Trends, Companies, Revenue, Growth, Value, Analysis, Share, Outlook & Size
Market Forecast By Type (EUV, DUV, I-Line, ArF, ArFi, KrF), By Wavelength (370 nm‚œ270 nm, 270 nm‚œ170 nm, 70 nm‚œ1 nm), By End User (IDMs, Foundries) And Competitive Landscape
| Product Code: ETC5563569 | Publication Date: Nov 2023 | Updated Date: Apr 2026 | Product Type: Market Research Report | |
| Publisher: 6Wresearch | Author: Ravi Bhandari | No. of Pages: 60 | No. of Figures: 30 | No. of Tables: 5 |
Malta Photolithography Equipment Market Size (2020-2030)
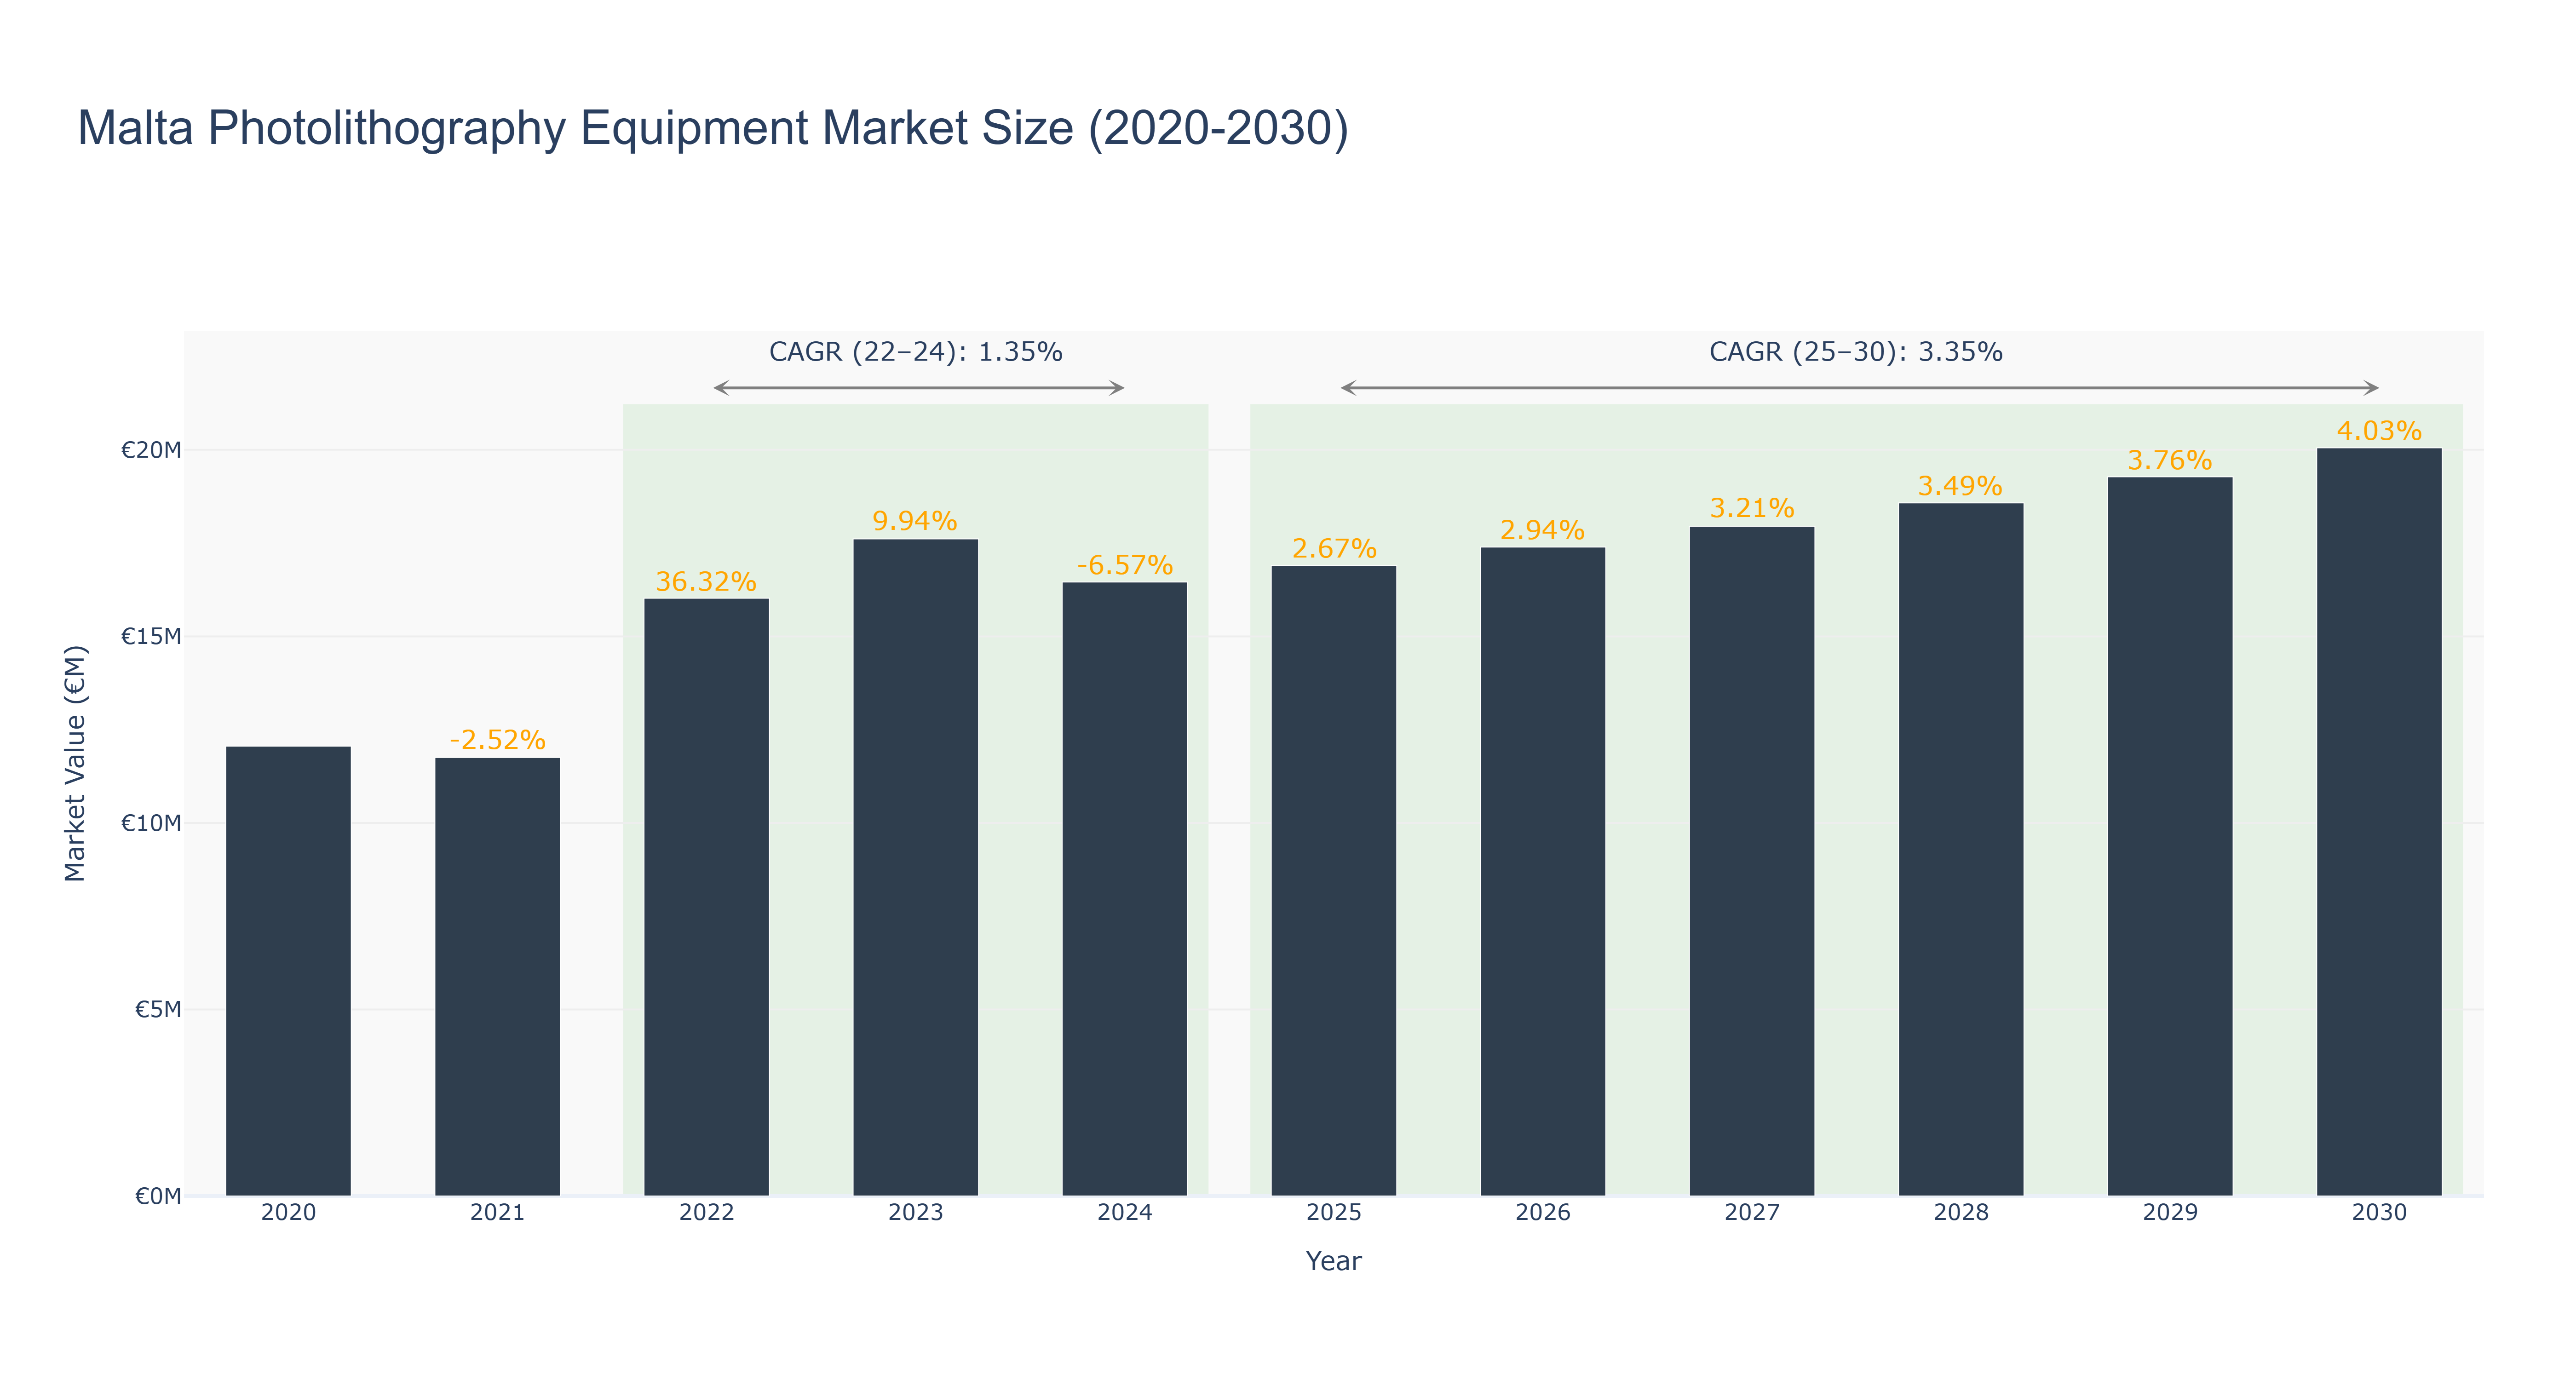
The Malta Photolithography Equipment Market displayed significant volatility from 2020 to 2024, peaking at €17.61 million in 2023, following a dramatic growth of 36.32% in 2022. However, the market experienced a downturn with a decline of 6.57% in 2024, resulting in a market size of €16.46 million. The compound annual growth rate (CAGR) for the actual period from 2022 to 2024 stands at 1.35%, reflecting the market's recovery post-pandemic and subsequent stabilization. Looking ahead to the forecasted period from 2025 to 2030, the market is projected to grow at a CAGR of 3.35%, reaching €20.05 million by 2030. This growth is expected to be driven by advancements in semiconductor manufacturing and increasing investments in technology infrastructure. Additionally, anticipated projects aimed at enhancing Malta's position within the European technology landscape could further bolster market dynamics.
Malta Photolithography Equipment Market: Production & Trade Performance (2019-2025)
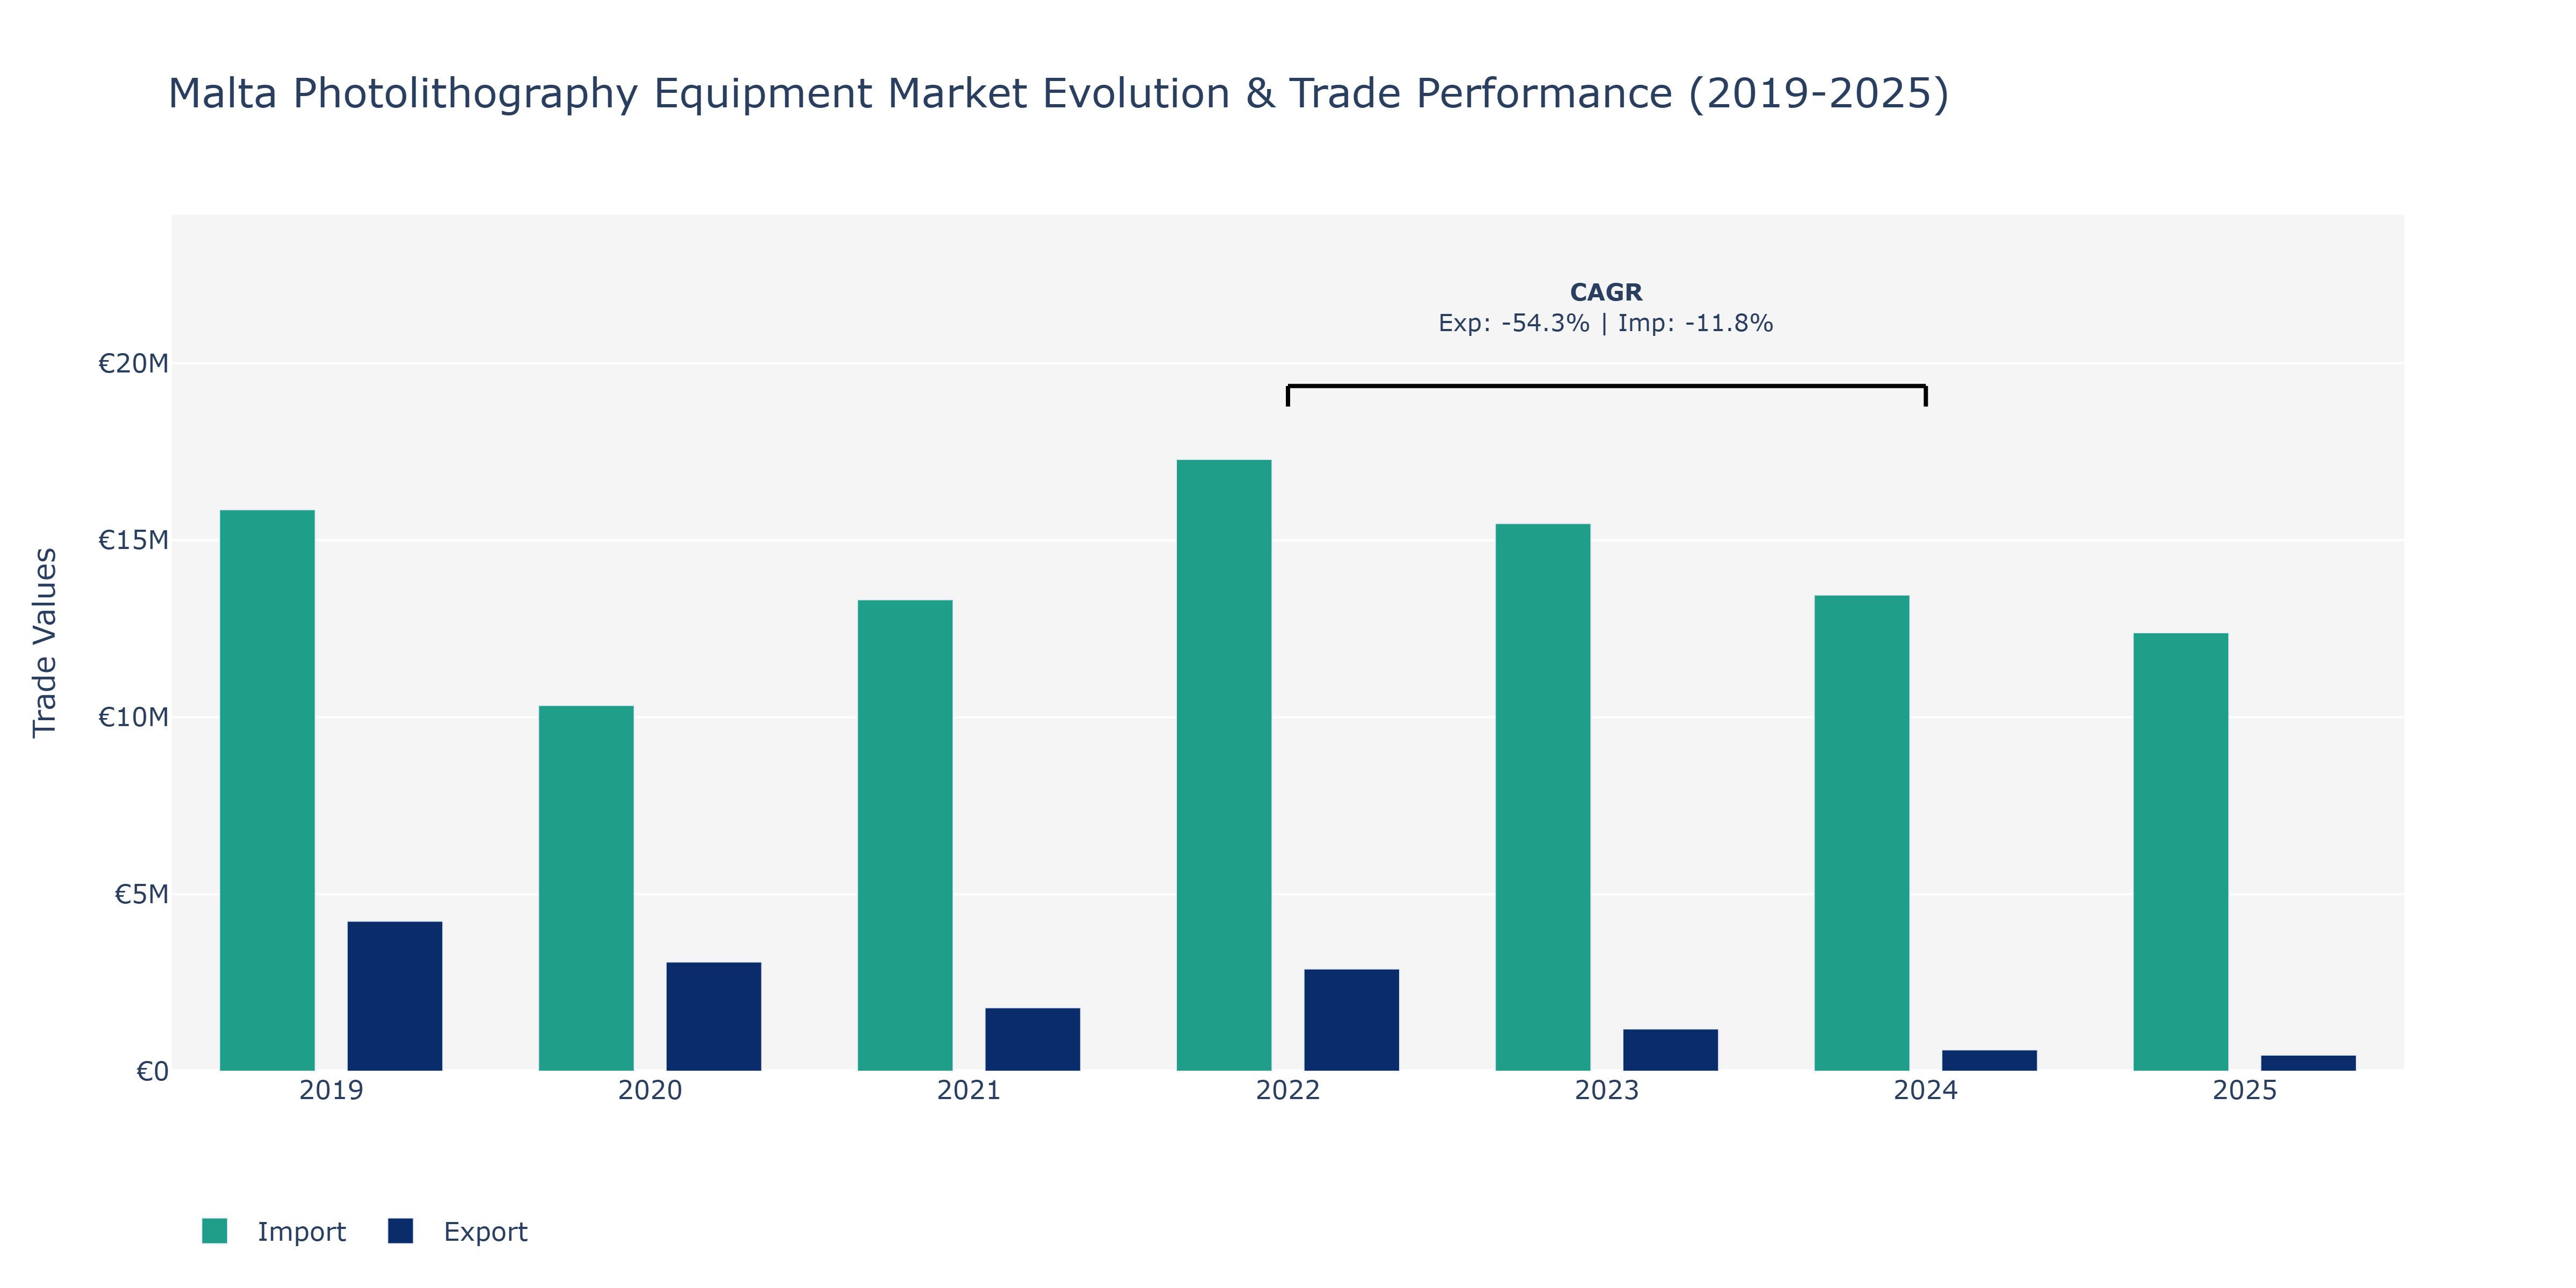
From 2019 to 2025, the Malta Photolithography Equipment Market saw fluctuations in both exports and imports. In 2019, exports were €4.24 million, dropping to €1.79 million in 2021 before rebounding to €454.18 thousand in 2025. Conversely, imports started at €15.86 million in 2019, decreased to €10.33 million in 2020, and then increased steadily to €12.39 million in 2025. The peak export value was in 2019, while the peak import value was in 2022. The significant drop in exports from 2019 to 2021 could be attributed to global economic uncertainties affecting demand. In contrast, the steady increase in imports may indicate growing domestic demand for advanced photolithography equipment in Malta's semiconductor industry. The market's recovery in exports by 2025 might be linked to technological advancements and increased global competitiveness of Maltese manufacturers.
Key Highlights of the Report:
- Malta Photolithography Equipment Market Outlook
- Market Size of Malta Photolithography Equipment Market, 2025
- Forecast of Malta Photolithography Equipment Market, 2032
- Historical Data and Forecast of Malta Photolithography Equipment Revenues & Volume for the Period 2022 - 2032F
- Malta Photolithography Equipment Market Trend Evolution
- Malta Photolithography Equipment Market Drivers and Challenges
- Malta Photolithography Equipment Price Trends
- Malta Photolithography Equipment Porter`s Five Forces
- Malta Photolithography Equipment Industry Life Cycle
- Historical Data and Forecast of Malta Photolithography Equipment Market Revenues & Volume By Type for the Period 2022 - 2032F
- Historical Data and Forecast of Malta Photolithography Equipment Market Revenues & Volume By EUV for the Period 2022 - 2032F
- Historical Data and Forecast of Malta Photolithography Equipment Market Revenues & Volume By DUV for the Period 2022 - 2032F
- Historical Data and Forecast of Malta Photolithography Equipment Market Revenues & Volume By I-Line for the Period 2022 - 2032F
- Historical Data and Forecast of Malta Photolithography Equipment Market Revenues & Volume By ArF for the Period 2022 - 2032F
- Historical Data and Forecast of Malta Photolithography Equipment Market Revenues & Volume By ArFi for the Period 2022 - 2032F
- Historical Data and Forecast of Malta Photolithography Equipment Market Revenues & Volume By KrF for the Period 2022 - 2032F
- Historical Data and Forecast of Malta Photolithography Equipment Market Revenues & Volume By Wavelength for the Period 2022 - 2032F
- Historical Data and Forecast of Malta Photolithography Equipment Market Revenues & Volume By 370 nm???270 nm for the Period 2022 - 2032F
- Historical Data and Forecast of Malta Photolithography Equipment Market Revenues & Volume By 270 nm???170 nm for the Period 2022 - 2032F
- Historical Data and Forecast of Malta Photolithography Equipment Market Revenues & Volume By 70 nm???1 nm for the Period 2022 - 2032F
- Historical Data and Forecast of Malta Photolithography Equipment Market Revenues & Volume By End User for the Period 2022 - 2032F
- Historical Data and Forecast of Malta Photolithography Equipment Market Revenues & Volume By IDMs for the Period 2022 - 2032F
- Historical Data and Forecast of Malta Photolithography Equipment Market Revenues & Volume By Foundries for the Period 2022 - 2032F
- Malta Photolithography Equipment Import Export Trade Statistics
- Market Opportunity Assessment By Type
- Market Opportunity Assessment By Wavelength
- Market Opportunity Assessment By End User
- Malta Photolithography Equipment Top Companies Market Share
- Malta Photolithography Equipment Competitive Benchmarking By Technical and Operational Parameters
- Malta Photolithography Equipment Company Profiles
- Malta Photolithography Equipment Key Strategic Recommendations
Frequently Asked Questions About the Market Study (FAQs):
6Wresearch actively monitors the Malta Photolithography Equipment Market and publishes its comprehensive annual report, highlighting emerging trends, growth drivers, revenue analysis, and forecast outlook. Our insights help businesses to make data-backed strategic decisions with ongoing market dynamics. Our analysts track relevent industries related to the Malta Photolithography Equipment Market, allowing our clients with actionable intelligence and reliable forecasts tailored to emerging regional needs.
Yes, we provide customisation as per your requirements. To learn more, feel free to contact us on sales@6wresearch.com
1 Executive Summary |
2 Introduction |
2.1 Key Highlights of the Report |
2.2 Report Description |
2.3 Market Scope & Segmentation |
2.4 Research Methodology |
2.5 Assumptions |
3 Malta Photolithography Equipment Market Overview |
3.1 Malta Country Macro Economic Indicators |
3.2 Malta Photolithography Equipment Market Revenues & Volume, 2022 & 2032F |
3.3 Malta Photolithography Equipment Market - Industry Life Cycle |
3.4 Malta Photolithography Equipment Market - Porter's Five Forces |
3.5 Malta Photolithography Equipment Market Revenues & Volume Share, By Type , 2022 & 2032F |
3.6 Malta Photolithography Equipment Market Revenues & Volume Share, By Wavelength, 2022 & 2032F |
3.7 Malta Photolithography Equipment Market Revenues & Volume Share, By End User, 2022 & 2032F |
4 Malta Photolithography Equipment Market Dynamics |
4.1 Impact Analysis |
4.2 Market Drivers |
4.2.1 Increasing demand for advanced semiconductor devices |
4.2.2 Technological advancements in photolithography equipment |
4.2.3 Growing adoption of IoT, AI, and 5G technologies in Malta |
4.3 Market Restraints |
4.3.1 High initial investment and maintenance costs of photolithography equipment |
4.3.2 Shortage of skilled workforce in the semiconductor industry in Malta |
5 Malta Photolithography Equipment Market Trends |
6 Malta Photolithography Equipment Market Segmentations |
6.1 Malta Photolithography Equipment Market, By Type |
6.1.1 Overview and Analysis |
6.1.2 Malta Photolithography Equipment Market Revenues & Volume, By EUV, 2022 - 2032F |
6.1.3 Malta Photolithography Equipment Market Revenues & Volume, By DUV, 2022 - 2032F |
6.1.4 Malta Photolithography Equipment Market Revenues & Volume, By I-Line, 2022 - 2032F |
6.1.5 Malta Photolithography Equipment Market Revenues & Volume, By ArF, 2022 - 2032F |
6.1.6 Malta Photolithography Equipment Market Revenues & Volume, By ArFi, 2022 - 2032F |
6.1.7 Malta Photolithography Equipment Market Revenues & Volume, By KrF, 2022 - 2032F |
6.2 Malta Photolithography Equipment Market, By Wavelength |
6.2.1 Overview and Analysis |
6.2.2 Malta Photolithography Equipment Market Revenues & Volume, By 370 nm? ??270 nm, 2022 - 2032F |
6.2.3 Malta Photolithography Equipment Market Revenues & Volume, By 270 nm? ??170 nm, 2022 - 2032F |
6.2.4 Malta Photolithography Equipment Market Revenues & Volume, By 70 nm? ??1 nm, 2022 - 2032F |
6.3 Malta Photolithography Equipment Market, By End User |
6.3.1 Overview and Analysis |
6.3.2 Malta Photolithography Equipment Market Revenues & Volume, By IDMs, 2022 - 2032F |
6.3.3 Malta Photolithography Equipment Market Revenues & Volume, By Foundries, 2022 - 2032F |
7 Malta Photolithography Equipment Market Import-Export Trade Statistics |
7.1 Malta Photolithography Equipment Market Export to Major Countries |
7.2 Malta Photolithography Equipment Market Imports from Major Countries |
8 Malta Photolithography Equipment Market Key Performance Indicators |
8.1 Average equipment utilization rate |
8.2 Average equipment downtime |
8.3 Percentage of equipment upgrades completed on time |
9 Malta Photolithography Equipment Market - Opportunity Assessment |
9.1 Malta Photolithography Equipment Market Opportunity Assessment, By Type , 2022 & 2032F |
9.2 Malta Photolithography Equipment Market Opportunity Assessment, By Wavelength, 2022 & 2032F |
9.3 Malta Photolithography Equipment Market Opportunity Assessment, By End User, 2022 & 2032F |
10 Malta Photolithography Equipment Market - Competitive Landscape |
10.1 Malta Photolithography Equipment Market Revenue Share, By Companies, 2025 |
10.2 Malta Photolithography Equipment Market Competitive Benchmarking, By Operating and Technical Parameters |
11 Company Profiles |
12 Recommendations | 13 Disclaimer |
Global Go To Market Strategy - 2030
Export potential enables firms to identify high-growth global markets with greater confidence by combining advanced trade intelligence with a structured quantitative methodology. The framework analyzes emerging demand trends and country-level import patterns while integrating macroeconomic and trade datasets such as GDP and population forecasts, bilateral import–export flows, tariff structures, elasticity differentials between developed and developing economies, geographic distance, and import demand projections. Using weighted trade values from 2020–2024 as the base period to project country-to-country export potential for 2030, these inputs are operationalized through calculated drivers such as gravity model parameters, tariff impact factors, and projected GDP per-capita growth. Through an analysis of hidden potentials, demand hotspots, and market conditions that are most favorable to success, this method enables firms to focus on target countries, maximize returns, and global expansion with data, backed by accuracy.
By factoring in the projected importer demand gap that is currently unmet and could be potential opportunity, it identifies the potential for the Exporter (Country) among 190 countries, against the general trade analysis, which identifies the biggest importer or exporter.
To discover high-growth global markets and optimize your business strategy:
Click Here
Pricing
- Single User License$ 1,995
- Department License$ 2,400
- Site License$ 3,120
- Global License$ 3,795

Leadership Perspectives from Industry Events
Search
Thought Leadership and Analyst Meet


Our Clients
6WResearch In News
- India Export Attractiveness Tracker 2026
- India Air Conditioner Market Set for Strong Rebound in 2026 After Weather-Led Correction and GST-Driven Recovery: 6Wresearch
- ADAS in India: How Automatic Emergency Braking, Blind Spot Detection & Driver Monitoring are Transforming Road Safety
- Doha a strategic location for EV manufacturing hub: IPA Qatar
- Demand for luxury TVs surging in the GCC, says Samsung
- Empowering Growth: The Thriving Journey of Bangladesh’s Cable Industry
Latest Reports
- Nicaragua RPG Gaming Market (2026-2032)
- New Zealand RPG Gaming Market (2026-2032)
- Netherlands RPG Gaming Market (2026-2032)
- Nauru RPG Gaming Market (2026-2032)
- Namibia RPG Gaming Market (2026-2032)
- Mozambique RPG Gaming Market (2026-2032)
- Montenegro RPG Gaming Market (2026-2032)
- Mongolia RPG Gaming Market (2026-2032)
- Monaco RPG Gaming Market (2026-2032)
- Micronesia RPG Gaming Market (2026-2032)
Industry Events and Analyst Meet

EV India Expo 2026

HIMTEX 2026

India Refining Summit 2026

India EV Show 2026

EV tech India Expo 2026
Whitepaper
- Middle East & Africa Commercial Security Market Click here to view more.
- Middle East & Africa Fire Safety Systems & Equipment Market Click here to view more.
- GCC Drone Market Click here to view more.
- Middle East Lighting Fixture Market Click here to view more.
- GCC Physical & Perimeter Security Market Click here to view more.