Malta Power Transmission Tower Market (2026-2032) | Size & Revenue, Analysis, Segmentation, Industry, Growth, Forecast, Outlook, Share, Value, Competitive Landscape, Companies, Trends
Market Forecast By Structure Type (Waist Type Tower, Guyed-V-Tower, Tubular Steel Pole, Guyed Cross-Rope Suspension Tower, Crossings), By Number of Circuits (Double-Circuit, 3-Circuit, 4-Circuit), By Angle of Deviation (A-Type, B-Type, C-type, D-type) And Competitive Landscape
| Product Code: ETC8200662 | Publication Date: Sep 2024 | Updated Date: Apr 2026 | Product Type: Market Research Report | |
| Publisher: 6Wresearch | Author: Shubham Padhi | No. of Pages: 75 | No. of Figures: 35 | No. of Tables: 20 |
Malta Power Transmission Tower Market Size (2020-2030)
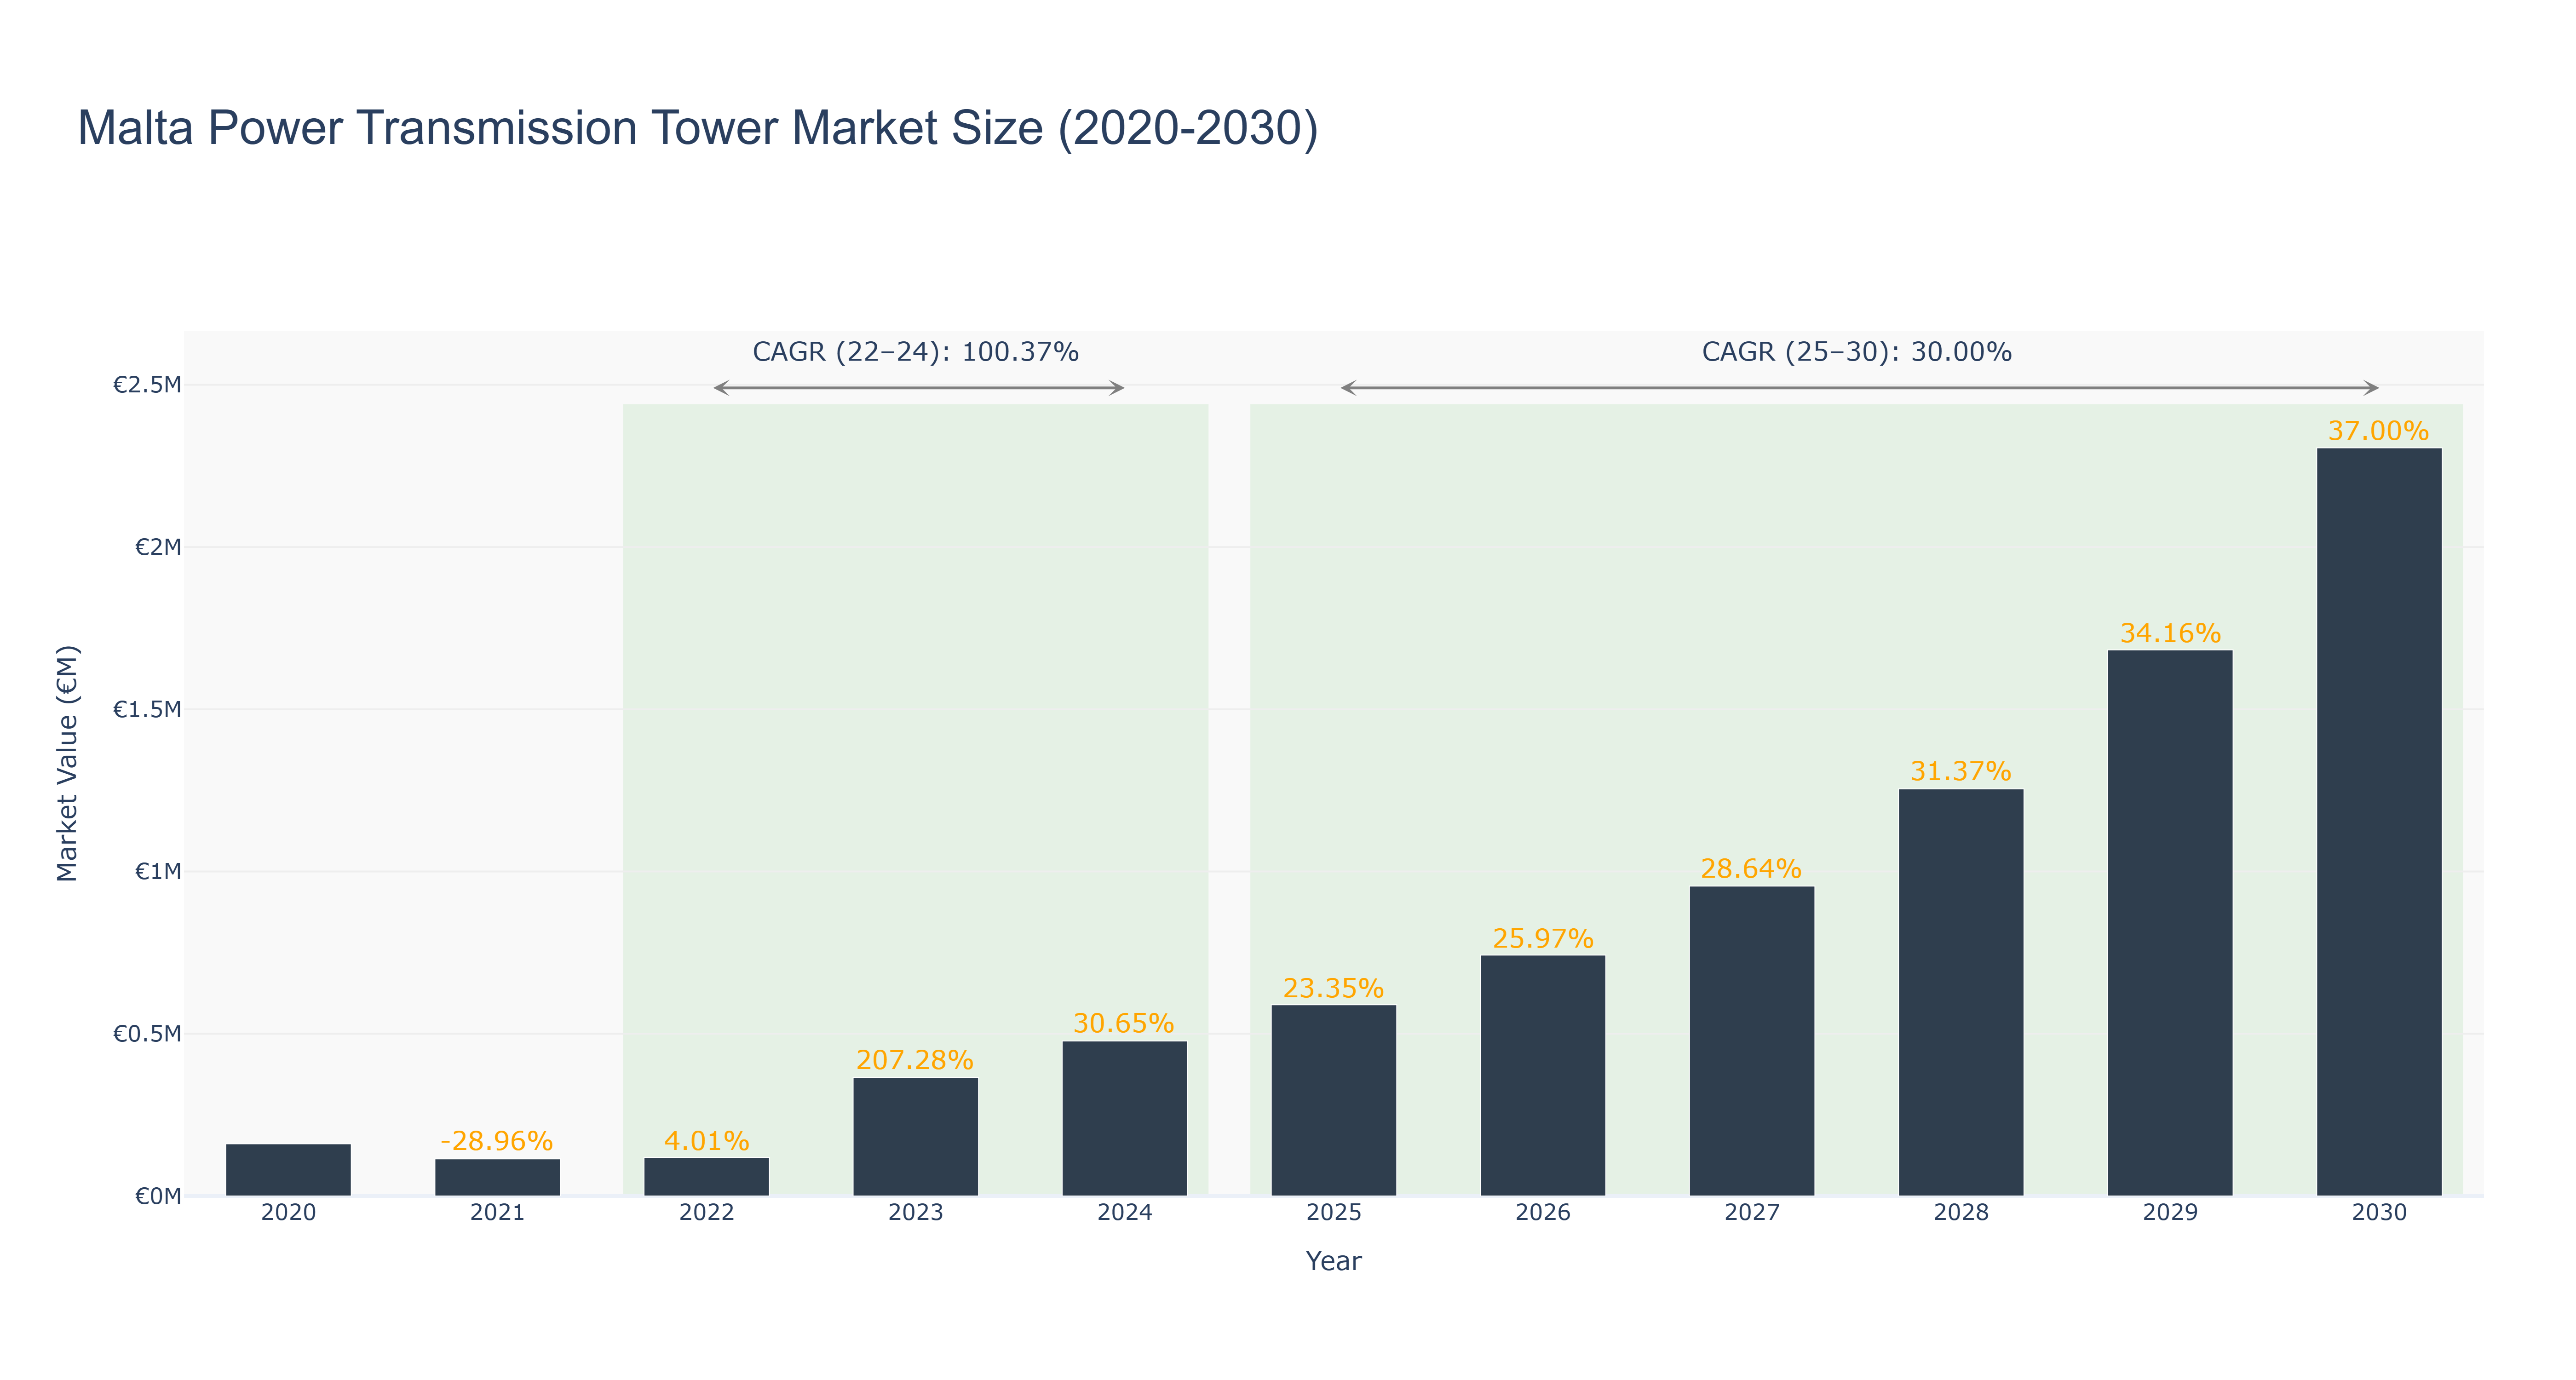
The Malta Power Transmission Tower Market has experienced significant fluctuations in recent years. After reaching a market size of €161.04 thousand in 2020, the sector faced a considerable decline in 2021, dropping to €114.41 thousand, a decrease of 28.96%. However, the market rebounded in 2022, growing modestly to €119.00 thousand and surging to €365.64 thousand in 2023, reflecting a remarkable growth rate of 207.28%. By 2024, the market is projected to reach €477.73 thousand, with a growth of 30.65%, showcasing a compound annual growth rate (CAGR) of 100.37% from 2022 to 2024. Looking ahead, the forecasted period (2025-2030) anticipates continued robust growth, with market sizes projected to reach €2.31 million by 2030, driven by investments in renewable energy infrastructure and modernization of power transmission networks, resulting in a CAGR of 30.00%. Such developments are likely to be propelled by Malta's commitment to enhancing energy efficiency and sustainability.
Malta Power Transmission Tower Market: Production & Trade Performance (2019-2025)
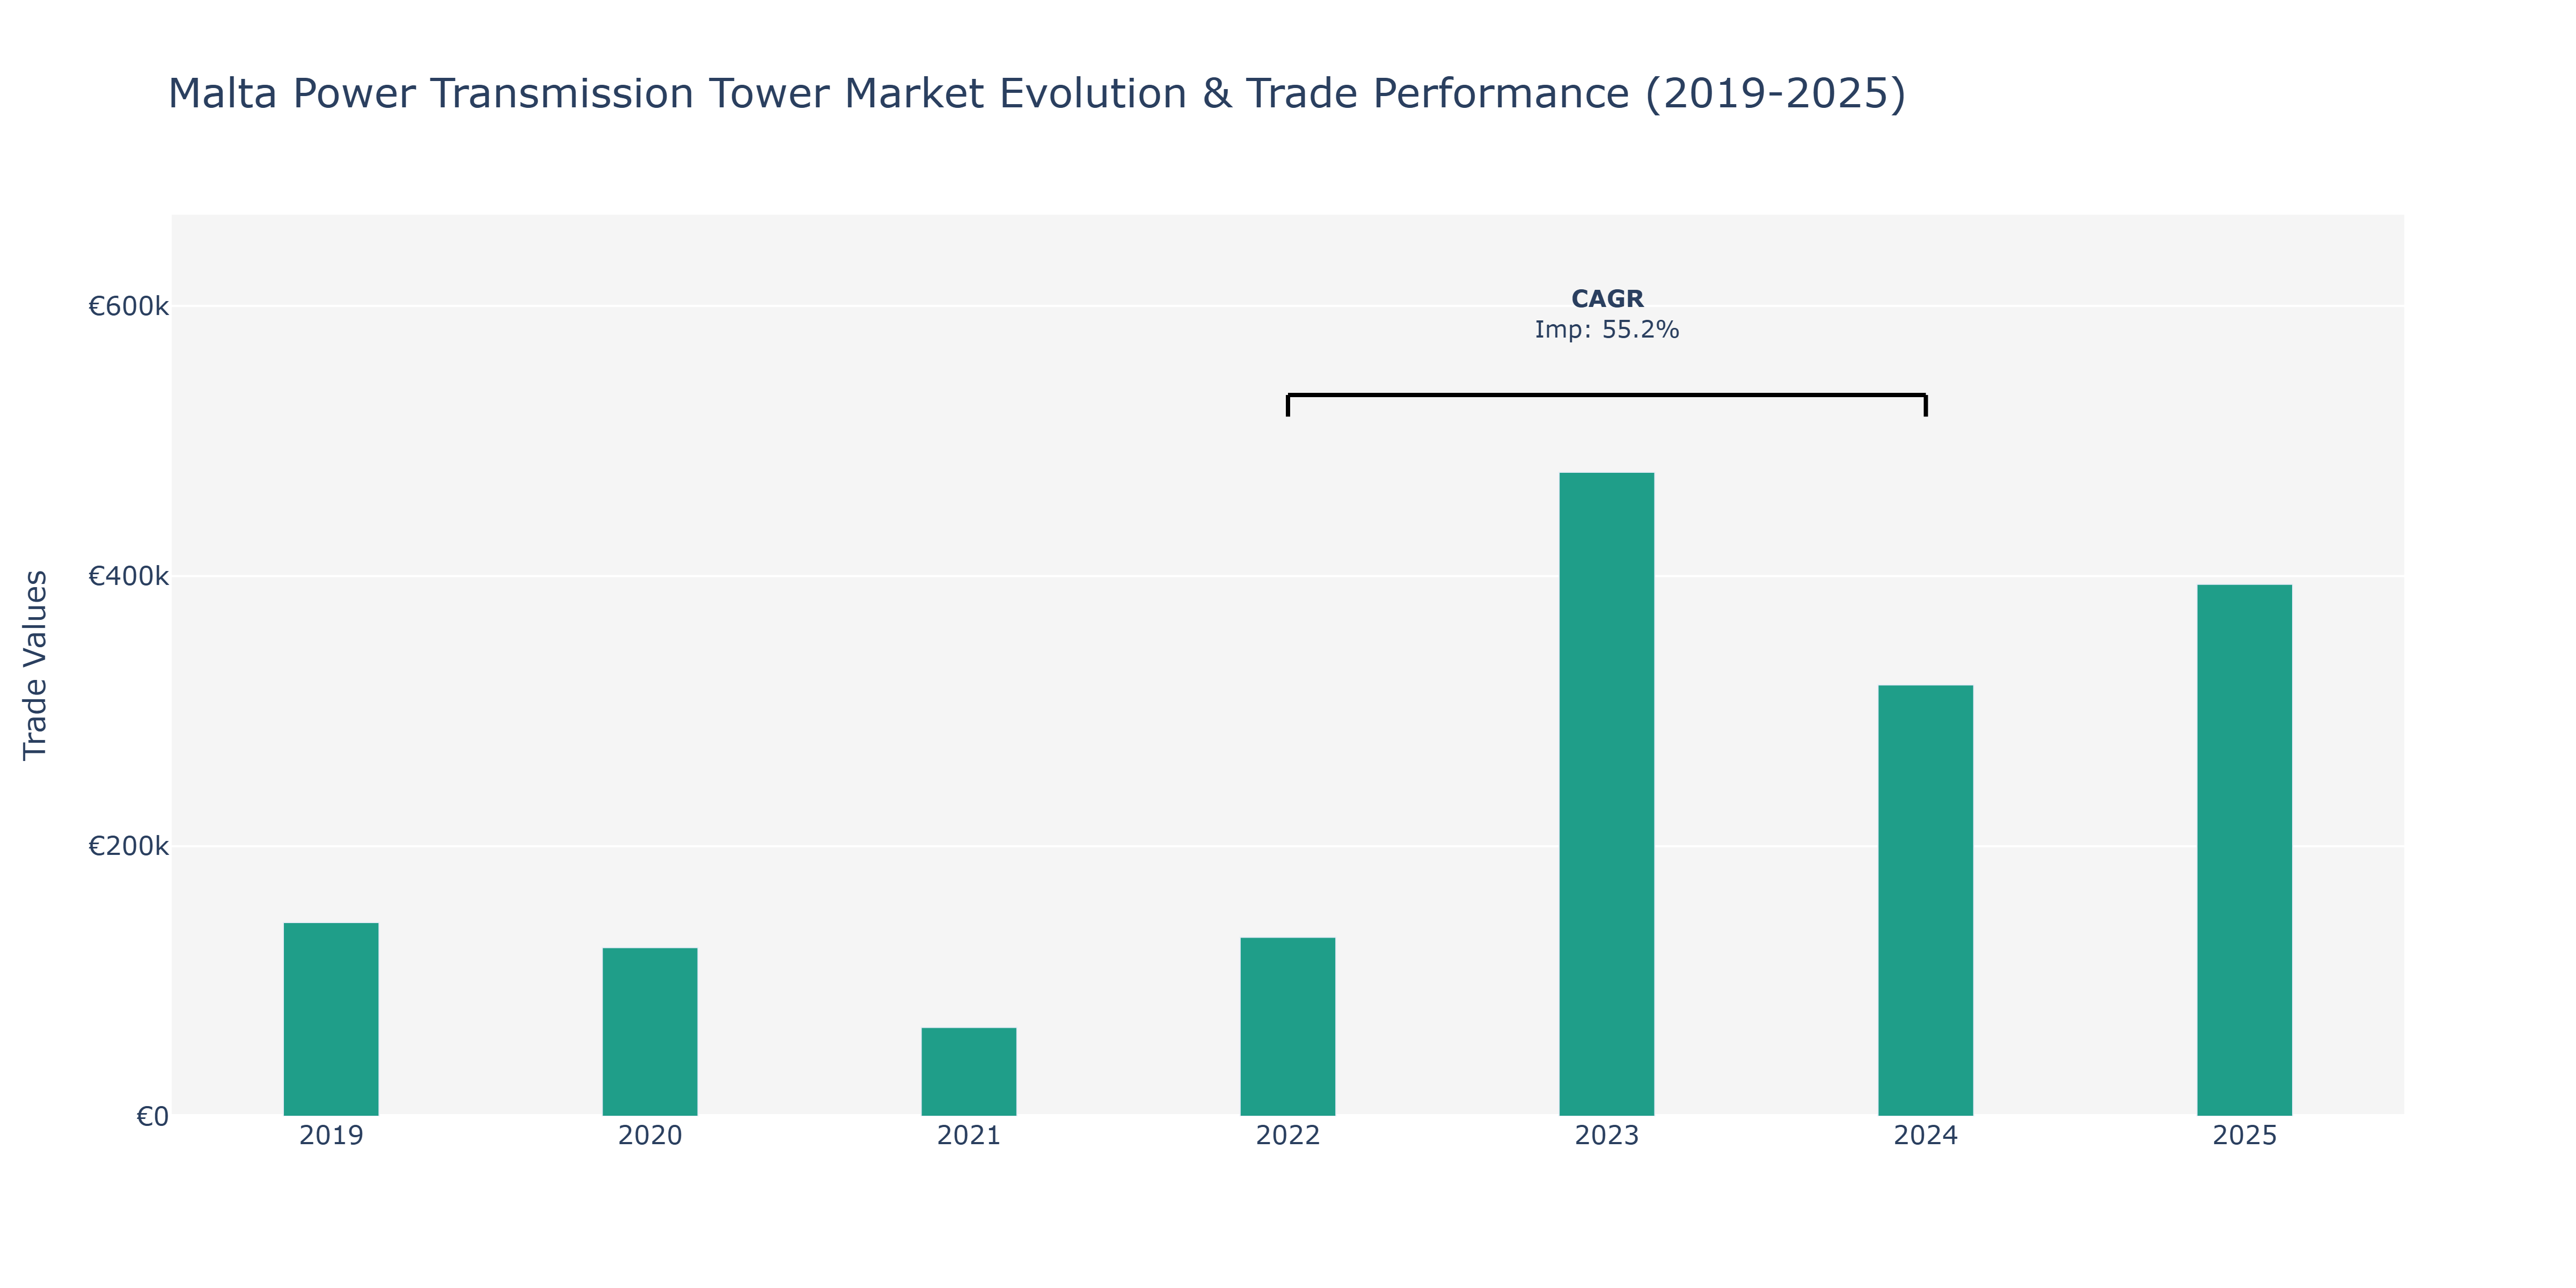
Imports of power transmission towers in the Malta market displayed a fluctuating trend over the specified years. In 2019, imports stood at €143.49 thousand, showing a decrease to €124.92 thousand in 2020. A notable decline was observed in 2021, with imports dropping to €65.77 thousand. However, significant growth occurred in 2022, reaching €132.56 thousand, followed by a substantial surge to €476.85 thousand in 2023. The market experienced a slight decrease in 2024 to €319.36 thousand before rebounding to €393.95 thousand in 2025. This erratic pattern could be attributed to infrastructure development projects, regulatory changes impacting import volumes, and shifts in energy transmission strategies within Malta. The impressive 55.22% CAGR from 2022 to 2024 further underscores the market's dynamism, reflecting a drive towards modernization and efficiency in the power sector, as supported by ongoing government initiatives aimed at enhancing the country's energy infrastructure.
Key Highlights of the Report:
- Malta Power Transmission Tower Market Outlook
- Market Size of Malta Power Transmission Tower Market, 2025
- Forecast of Malta Power Transmission Tower Market, 2032
- Historical Data and Forecast of Malta Power Transmission Tower Revenues & Volume for the Period 2022 - 2032
- Malta Power Transmission Tower Market Trend Evolution
- Malta Power Transmission Tower Market Drivers and Challenges
- Malta Power Transmission Tower Price Trends
- Malta Power Transmission Tower Porter's Five Forces
- Malta Power Transmission Tower Industry Life Cycle
- Historical Data and Forecast of Malta Power Transmission Tower Market Revenues & Volume By Structure Type for the Period 2022 - 2032
- Historical Data and Forecast of Malta Power Transmission Tower Market Revenues & Volume By Waist Type Tower for the Period 2022 - 2032
- Historical Data and Forecast of Malta Power Transmission Tower Market Revenues & Volume By Guyed-V-Tower for the Period 2022 - 2032
- Historical Data and Forecast of Malta Power Transmission Tower Market Revenues & Volume By Tubular Steel Pole for the Period 2022 - 2032
- Historical Data and Forecast of Malta Power Transmission Tower Market Revenues & Volume By Guyed Cross-Rope Suspension Tower for the Period 2022 - 2032
- Historical Data and Forecast of Malta Power Transmission Tower Market Revenues & Volume By Crossings for the Period 2022 - 2032
- Historical Data and Forecast of Malta Power Transmission Tower Market Revenues & Volume By Number of Circuits for the Period 2022 - 2032
- Historical Data and Forecast of Malta Power Transmission Tower Market Revenues & Volume By Double-Circuit for the Period 2022 - 2032
- Historical Data and Forecast of Malta Power Transmission Tower Market Revenues & Volume By 3-Circuit for the Period 2022 - 2032
- Historical Data and Forecast of Malta Power Transmission Tower Market Revenues & Volume By 4-Circuit for the Period 2022 - 2032
- Historical Data and Forecast of Malta Power Transmission Tower Market Revenues & Volume By Angle of Deviation for the Period 2022 - 2032
- Historical Data and Forecast of Malta Power Transmission Tower Market Revenues & Volume By A-Type for the Period 2022 - 2032
- Historical Data and Forecast of Malta Power Transmission Tower Market Revenues & Volume By B-Type for the Period 2022 - 2032
- Historical Data and Forecast of Malta Power Transmission Tower Market Revenues & Volume By C-type for the Period 2022 - 2032
- Historical Data and Forecast of Malta Power Transmission Tower Market Revenues & Volume By D-type for the Period 2022 - 2032
- Malta Power Transmission Tower Import Export Trade Statistics
- Market Opportunity Assessment By Structure Type
- Market Opportunity Assessment By Number of Circuits
- Market Opportunity Assessment By Angle of Deviation
- Malta Power Transmission Tower Top Companies Market Share
- Malta Power Transmission Tower Competitive Benchmarking By Technical and Operational Parameters
- Malta Power Transmission Tower Company Profiles
- Malta Power Transmission Tower Key Strategic Recommendations
Frequently Asked Questions About the Market Study (FAQs):
6Wresearch actively monitors the Malta Power Transmission Tower Market and publishes its comprehensive annual report, highlighting emerging trends, growth drivers, revenue analysis, and forecast outlook. Our insights help businesses to make data-backed strategic decisions with ongoing market dynamics. Our analysts track relevent industries related to the Malta Power Transmission Tower Market, allowing our clients with actionable intelligence and reliable forecasts tailored to emerging regional needs.
Yes, we provide customisation as per your requirements. To learn more, feel free to contact us on sales@6wresearch.com
1 Executive Summary |
2 Introduction |
2.1 Key Highlights of the Report |
2.2 Report Description |
2.3 Market Scope & Segmentation |
2.4 Research Methodology |
2.5 Assumptions |
3 Malta Power Transmission Tower Market Overview |
3.1 Malta Country Macro Economic Indicators |
3.2 Malta Power Transmission Tower Market Revenues & Volume, 2022 & 2032F |
3.3 Malta Power Transmission Tower Market - Industry Life Cycle |
3.4 Malta Power Transmission Tower Market - Porter's Five Forces |
3.5 Malta Power Transmission Tower Market Revenues & Volume Share, By Structure Type, 2022 & 2032F |
3.6 Malta Power Transmission Tower Market Revenues & Volume Share, By Number of Circuits, 2022 & 2032F |
3.7 Malta Power Transmission Tower Market Revenues & Volume Share, By Angle of Deviation, 2022 & 2032F |
4 Malta Power Transmission Tower Market Dynamics |
4.1 Impact Analysis |
4.2 Market Drivers |
4.3 Market Restraints |
5 Malta Power Transmission Tower Market Trends |
6 Malta Power Transmission Tower Market, By Types |
6.1 Malta Power Transmission Tower Market, By Structure Type |
6.1.1 Overview and Analysis |
6.1.2 Malta Power Transmission Tower Market Revenues & Volume, By Structure Type, 2022 - 2032F |
6.1.3 Malta Power Transmission Tower Market Revenues & Volume, By Waist Type Tower, 2022 - 2032F |
6.1.4 Malta Power Transmission Tower Market Revenues & Volume, By Guyed-V-Tower, 2022 - 2032F |
6.1.5 Malta Power Transmission Tower Market Revenues & Volume, By Tubular Steel Pole, 2022 - 2032F |
6.1.6 Malta Power Transmission Tower Market Revenues & Volume, By Guyed Cross-Rope Suspension Tower, 2022 - 2032F |
6.1.7 Malta Power Transmission Tower Market Revenues & Volume, By Crossings, 2022 - 2032F |
6.2 Malta Power Transmission Tower Market, By Number of Circuits |
6.2.1 Overview and Analysis |
6.2.2 Malta Power Transmission Tower Market Revenues & Volume, By Double-Circuit, 2022 - 2032F |
6.2.3 Malta Power Transmission Tower Market Revenues & Volume, By 3-Circuit, 2022 - 2032F |
6.2.4 Malta Power Transmission Tower Market Revenues & Volume, By 4-Circuit, 2022 - 2032F |
6.3 Malta Power Transmission Tower Market, By Angle of Deviation |
6.3.1 Overview and Analysis |
6.3.2 Malta Power Transmission Tower Market Revenues & Volume, By A-Type, 2022 - 2032F |
6.3.3 Malta Power Transmission Tower Market Revenues & Volume, By B-Type, 2022 - 2032F |
6.3.4 Malta Power Transmission Tower Market Revenues & Volume, By C-type, 2022 - 2032F |
6.3.5 Malta Power Transmission Tower Market Revenues & Volume, By D-type, 2022 - 2032F |
7 Malta Power Transmission Tower Market Import-Export Trade Statistics |
7.1 Malta Power Transmission Tower Market Export to Major Countries |
7.2 Malta Power Transmission Tower Market Imports from Major Countries |
8 Malta Power Transmission Tower Market Key Performance Indicators |
9 Malta Power Transmission Tower Market - Opportunity Assessment |
9.1 Malta Power Transmission Tower Market Opportunity Assessment, By Structure Type, 2022 & 2032F |
9.2 Malta Power Transmission Tower Market Opportunity Assessment, By Number of Circuits, 2022 & 2032F |
9.3 Malta Power Transmission Tower Market Opportunity Assessment, By Angle of Deviation, 2022 & 2032F |
10 Malta Power Transmission Tower Market - Competitive Landscape |
10.1 Malta Power Transmission Tower Market Revenue Share, By Companies, 2025 |
10.2 Malta Power Transmission Tower Market Competitive Benchmarking, By Operating and Technical Parameters |
11 Company Profiles |
12 Recommendations |
13 Disclaimer |
Global Go To Market Strategy - 2030
Export potential enables firms to identify high-growth global markets with greater confidence by combining advanced trade intelligence with a structured quantitative methodology. The framework analyzes emerging demand trends and country-level import patterns while integrating macroeconomic and trade datasets such as GDP and population forecasts, bilateral import–export flows, tariff structures, elasticity differentials between developed and developing economies, geographic distance, and import demand projections. Using weighted trade values from 2020–2024 as the base period to project country-to-country export potential for 2030, these inputs are operationalized through calculated drivers such as gravity model parameters, tariff impact factors, and projected GDP per-capita growth. Through an analysis of hidden potentials, demand hotspots, and market conditions that are most favorable to success, this method enables firms to focus on target countries, maximize returns, and global expansion with data, backed by accuracy.
By factoring in the projected importer demand gap that is currently unmet and could be potential opportunity, it identifies the potential for the Exporter (Country) among 190 countries, against the general trade analysis, which identifies the biggest importer or exporter.
To discover high-growth global markets and optimize your business strategy:
Click Here
Pricing
- Single User License$ 1,995
- Department License$ 2,400
- Site License$ 3,120
- Global License$ 3,795

Leadership Perspectives from Industry Events
Search
Thought Leadership and Analyst Meet


Our Clients
6WResearch In News
- India Export Attractiveness Tracker 2026
- India Air Conditioner Market Set for Strong Rebound in 2026 After Weather-Led Correction and GST-Driven Recovery: 6Wresearch
- ADAS in India: How Automatic Emergency Braking, Blind Spot Detection & Driver Monitoring are Transforming Road Safety
- Doha a strategic location for EV manufacturing hub: IPA Qatar
- Demand for luxury TVs surging in the GCC, says Samsung
- Empowering Growth: The Thriving Journey of Bangladesh’s Cable Industry
Latest Reports
- Nicaragua RPG Gaming Market (2026-2032)
- New Zealand RPG Gaming Market (2026-2032)
- Netherlands RPG Gaming Market (2026-2032)
- Nauru RPG Gaming Market (2026-2032)
- Namibia RPG Gaming Market (2026-2032)
- Mozambique RPG Gaming Market (2026-2032)
- Montenegro RPG Gaming Market (2026-2032)
- Mongolia RPG Gaming Market (2026-2032)
- Monaco RPG Gaming Market (2026-2032)
- Micronesia RPG Gaming Market (2026-2032)
Industry Events and Analyst Meet

EV India Expo 2026

HIMTEX 2026

India Refining Summit 2026

India EV Show 2026

EV tech India Expo 2026
Whitepaper
- Middle East & Africa Commercial Security Market Click here to view more.
- Middle East & Africa Fire Safety Systems & Equipment Market Click here to view more.
- GCC Drone Market Click here to view more.
- Middle East Lighting Fixture Market Click here to view more.
- GCC Physical & Perimeter Security Market Click here to view more.