Myanmar Battery Scrap Market Size, Share & Growth Rate
The Myanmar Battery Scrap Market was estimated at USD 678 Million in 2025 and is projected to reach USD 1247 Million by 2032, growing at a CAGR of 9.1% from 2026 to 2032. This growth is largely driven by the burgeoning automotive industry and a heightened focus on renewable energy initiatives within the country. As electric vehicles gain traction and energy storage solutions become increasingly vital, the demand for battery scrap is expected to continue its upward trajectory.
Myanmar Battery Scrap Market Year-wise Growth Rate and Key Drivers
This graph highlights how the Myanmar Battery Scrap Market has steadily grown over the years, supported by major growth factors.
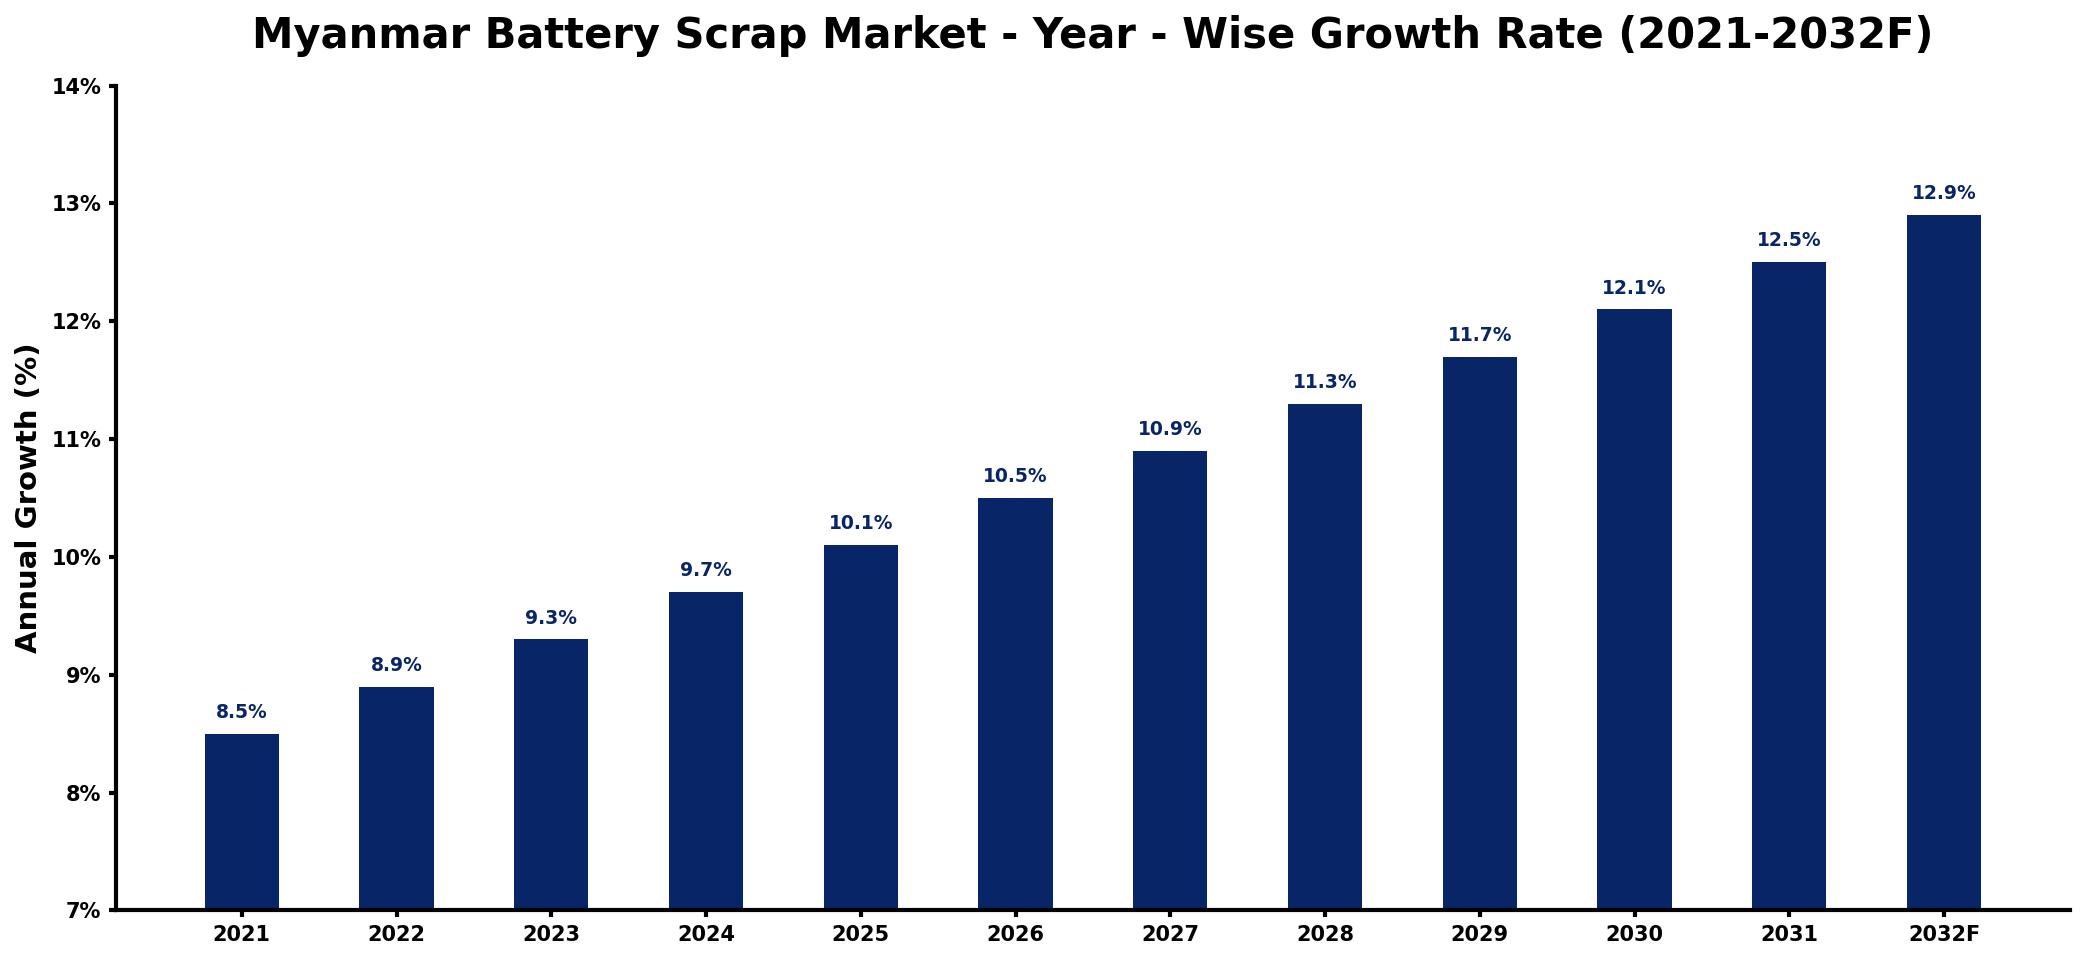
The table below presents the year‑wise growth rates along with the key drivers influencing the market
| Year | Growth Rate | Major Drivers |
| 2021 | 8.5% | Rising electric vehicle adoption |
| 2022 | 8.9% | Increased renewable energy initiatives |
| 2023 | 9.3% | Expansion of recycling facilities |
| 2024 | 9.7% | Growing consumer electronics market |
| 2025 | 10.1% | Government sustainability incentives introduced |
| 2026 | 10.5% | Technological advancements in recycling |
| 2027 | 10.9% | Rising demand for energy storage |
| 2028 | 11.3% | Improved regulatory frameworks established |
| 2029 | 11.7% | Enhanced public awareness campaigns |
| 2030 | 12.1% | Investment in green technologies |
| 2031 | 12.5% | Strengthened international trade agreements |
| 2032 | 12.9% | Emerging markets seeking sustainable solutions |
Note: Market size estimations and growth projections presented in this report are based on 6Wresearch's proprietary forecasting methodology, utilizing the latest available industry data, government publications, and primary research inputs.
Myanmar Battery Scrap Market Synopsis
The strongest force shaping the Myanmar Battery Scrap Market today is the rapid expansion of the electric vehicle sector. As more consumers and businesses shift towards electric mobility, the need for efficient recycling of battery materials is becoming critical. This trend is compounded by government efforts to promote sustainable energy practices and reduce environmental impact.
In parallel, the increasing reliance on renewable energy sources is further propelling the demand for lead-acid batteries. This escalating consumption pattern not only highlights the economic potential of battery scrap but also emphasizes the urgent need for advanced recycling solutions to manage waste responsibly and sustainably.
Myanmar Battery Scrap Market Key Takeaways
- The market is primarily driven by the automotive industry's growth and rising energy storage needs.
- Government initiatives supporting renewable energy significantly boost the demand for battery scrap.
- Advanced recycling technologies are being adopted to optimize the extraction of valuable materials.
- The lack of proper recycling infrastructure poses a challenge to the market's growth potential.
- Investment opportunities exist for those willing to innovate in battery recycling solutions.
Evaluation of Restraints in Myanmar Battery Scrap Market
Despite the positive market outlook, several key restraints hinder growth. A notable barrier is the inadequate collection and recycling infrastructure, which limits the ability to process battery scrap efficiently. Additionally, the presence of unregulated recyclers raises environmental and health concerns, as they often lack the expertise to handle hazardous materials safely. Moreover, consumer and business awareness regarding proper disposal methods remains low, further complicating efforts to establish a robust recycling framework. Addressing these issues will require concerted actions from government and industry stakeholders alike.
Myanmar Battery Scrap Market Trends
The Myanmar Battery Scrap Market is currently experiencing several noteworthy trends. The rising adoption of electric vehicles is at the forefront, with battery scrap increasingly recognized as a valuable resource for extracting critical materials such as lithium, cobalt, and nickel. Additionally, technological advancements in recycling processes are becoming prevalent, allowing companies to maximize recovery rates and minimize environmental impact. Furthermore, growing consumer awareness of sustainability issues is also driving demand for responsible recycling practices.
Myanmar Battery Scrap Market Opportunities
Investors looking for growth opportunities will find the Myanmar Battery Scrap Market particularly attractive. The rising demand for batteries across various sectors, including automotive, electronics, and renewable energy, presents a significant market for recycled materials. Establishing battery scrap recycling facilities or investing in advanced recycling technologies can yield substantial returns, not just financially but also in promoting sustainable practices. With government support for eco-friendly initiatives, businesses entering this sector may also benefit from favorable policies and incentives.
Government Initiatives in the Myanmar Battery Scrap Market
The Myanmar government has implemented several initiatives aimed at addressing battery scrap management and recycling. These include regulations governing the import and export of battery scrap, as well as guidelines to ensure environmentally responsible disposal and recycling practices. The government is actively promoting recycling to reduce waste and environmental harm, while also encouraging the adoption of circular economy principles to foster sustainable growth within the industry.
Future Insights of the Myanmar Battery Scrap Market
Looking ahead to 2026-2032, the future of the Myanmar Battery Scrap Market appears promising. With continued industrialization and infrastructure development, there will be sustained demand for battery recycling to fulfill the raw material needs for battery production. Government policies favoring sustainable practices and environmental regulations will further enhance market prospects. Stakeholders can anticipate robust growth driven by innovation and increased awareness of the benefits of recycling and repurposing battery materials.
Myanmar Battery Scrap Market Latest Developments (2025 - 2026)
Recent developments in the Myanmar Battery Scrap Market indicate a shift towards more sustainable practices and technologies. Industry stakeholders are increasingly collaborating with government agencies to improve recycling infrastructure and awareness campaigns. New technologies aimed at enhancing material recovery rates are also emerging, reflecting a commitment to address environmental concerns surrounding battery waste. Overall, the market is evolving towards more regulated and efficient recycling processes.
Myanmar Battery Scrap Market - Key Attractiveness of the Report
- 10 Years of Market Numbers
- Historical Data Starting from 2022 to 2025
- Base Year: 2025
- Forecast Data until 2032
- Key Performance Indicators Impacting the Market
- Major Upcoming Developments and Projects
Key Highlights of the Report:
- Myanmar Battery Scrap Market Outlook
- Market Size of Myanmar Battery Scrap Market, 2025
- Forecast of Myanmar Battery Scrap Market, 2032
- Historical Data and Forecast of Myanmar Battery Scrap Revenues & Volume for the Period 2022-2032F
- Myanmar Battery Scrap Market Trend Evolution
- Myanmar Battery Scrap Market Drivers and Challenges
- Myanmar Battery Scrap Price Trends
- Myanmar Battery Scrap Porter's Five Forces
- Myanmar Battery Scrap Industry Life Cycle
- Historical Data and Forecast of Myanmar Battery Scrap Market Revenues & Volume By Product for the Period 2022-2032F
- Historical Data and Forecast of Myanmar Battery Scrap Market Revenues & Volume By Lead Acid for the Period 2022-2032F
- Historical Data and Forecast of Myanmar Battery Scrap Market Revenues & Volume By Lithium Ion for the Period 2022-2032F
- Historical Data and Forecast of Myanmar Battery Scrap Market Revenues & Volume By Nickel Cadmium for the Period 2022-2032F
- Historical Data and Forecast of Myanmar Battery Scrap Market Revenues & Volume By Nickel??Metal Hydride for the Period 2022-2032F
- Historical Data and Forecast of Myanmar Battery Scrap Market Revenues & Volume By Others for the Period 2022-2032F
- Historical Data and Forecast of Myanmar Battery Scrap Market Revenues & Volume By Application for the Period 2022-2032F
- Historical Data and Forecast of Myanmar Battery Scrap Market Revenues & Volume By Material Extraction for the Period 2022-2032F
- Historical Data and Forecast of Myanmar Battery Scrap Market Revenues & Volume By Reuse or Second Life for the Period 2022-2032F
- Historical Data and Forecast of Myanmar Battery Scrap Market Revenues & Volume By Disposal for the Period 2022-2032F
- Historical Data and Forecast of Myanmar Battery Scrap Market Revenues & Volume By Others for the Period 2022-2032F
- Historical Data and Forecast of Myanmar Battery Scrap Market Revenues & Volume By Source for the Period 2022-2032F
- Historical Data and Forecast of Myanmar Battery Scrap Market Revenues & Volume By Consumer Electronics for the Period 2022-2032F
- Historical Data and Forecast of Myanmar Battery Scrap Market Revenues & Volume By Automotive for the Period 2022-2032F
- Historical Data and Forecast of Myanmar Battery Scrap Market Revenues & Volume By Industrial for the Period 2022-2032F
- Historical Data and Forecast of Myanmar Battery Scrap Market Revenues & Volume By Marine for the Period 2022-2032F
- Historical Data and Forecast of Myanmar Battery Scrap Market Revenues & Volume By Others for the Period 2022-2032F
- Myanmar Battery Scrap Import Export Trade Statistics
- Market Opportunity Assessment By Product
- Market Opportunity Assessment By Application
- Market Opportunity Assessment By Source
- Myanmar Battery Scrap Top Companies Market Share
- Myanmar Battery Scrap Competitive Benchmarking By Technical and Operational Parameters
- Myanmar Battery Scrap Company Profiles
- Myanmar Battery Scrap Key Strategic Recommendations






































