Myanmar Pool Tables Market (2026-2032) Outlook | Revenue, Value, Share, Companies, Size, Growth, Analysis, Industry, Trends & Forecast
Market Forecast By Type (American Pool Table, British Pool Table), By Material (Slate Pool Table, Wooden Pool Table, Metallic Pool Table, Rubber Pool Table), By End Use (Residential, Commercial, Professional), By Distribution Channel (Hypermarkets & Supermarkets, Departmental Stores, Specialty Stores, Online Sales Channel) And Competitive Landscape
| Product Code: ETC231814 | Publication Date: Aug 2022 | Updated Date: Jul 2026 | Product Type: Market Research Report | |
| Publisher: 6Wresearch | Author: Bhawna Singh | No. of Pages: 75 | No. of Figures: 35 | No. of Tables: 20 |
Myanmar Pool Tables Market Size, Share & Growth Rate
The Myanmar Pool Tables Market was estimated at USD 314 Million in 2025 and is projected to reach USD 419 Million by 2032, growing at a CAGR of 4.2% from 2026 to 2032. This steady growth trajectory is fueled by an increasing affinity for recreational activities such as pool, particularly in urban settings. The demand for high-quality and customizable tables, as well as the burgeoning tourism sector, are significant contributors to this market expansion.
Myanmar Pool Tables Market Year-wise Growth Rate and Key Drivers
This graph highlights how the Myanmar Pool Tables Market has steadily grown over the years, supported by major growth factors.
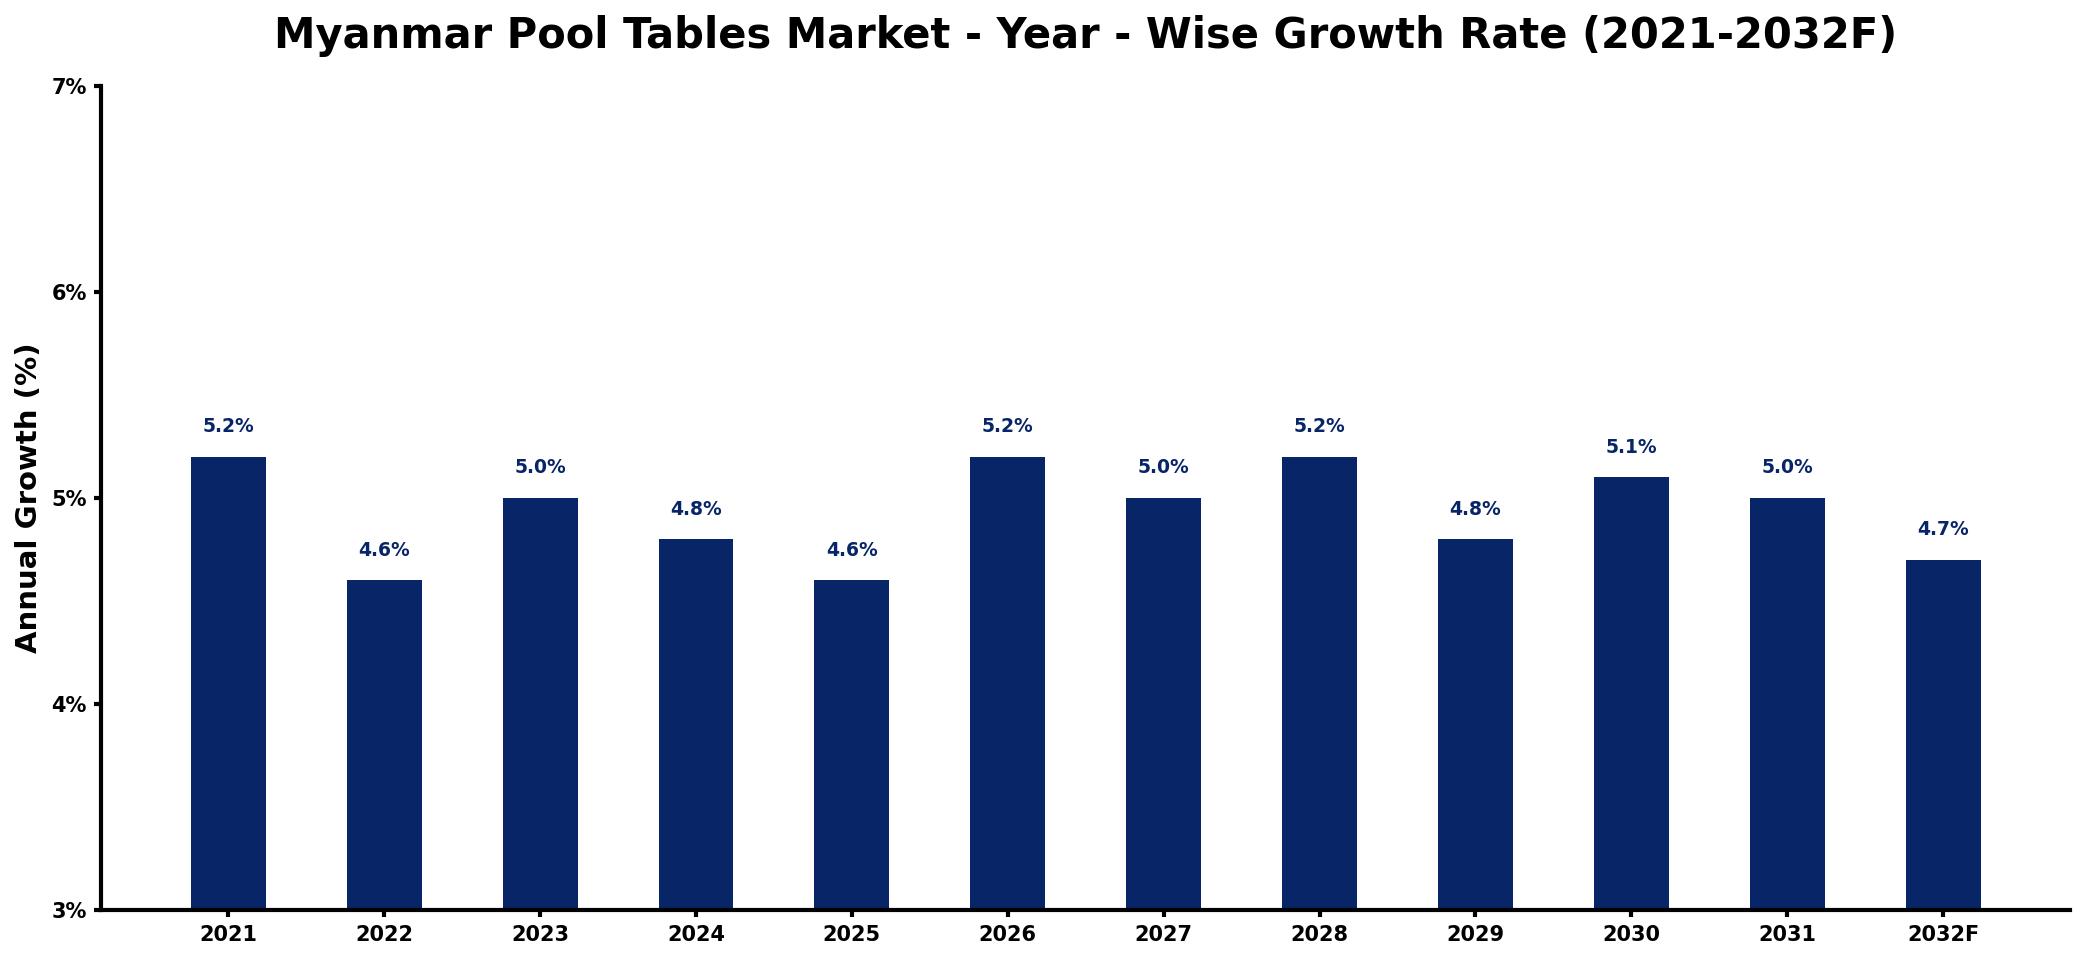
The table below presents the year‑wise growth rates along with the key drivers influencing the market
| Year | Growth Rate | Major Drivers |
| 2021 | 5.2% | Increased leisure spending trends |
| 2022 | 4.6% | Growing popularity of recreational venues |
| 2023 | 5.0% | Expansion of entertainment facilities |
| 2024 | 4.8% | Rising interest in social activities |
| 2025 | 4.6% | Investment in sports and recreation |
| 2026 | 5.2% | Emergence of new gaming lounges |
| 2027 | 5.0% | Enhanced marketing strategies implemented |
| 2028 | 5.2% | Diversification of entertainment options |
| 2029 | 4.8% | Strengthening of local communities |
| 2030 | 5.1% | Collaboration with tourism sectors |
| 2031 | 5.0% | Development of youth engagement programs |
| 2032 | 4.7% | Increase in disposable income levels |
Note: Market size estimations and growth projections presented in this report are based on 6Wresearch's proprietary forecasting methodology, utilizing the latest available industry data, government publications, and primary research inputs.
Myanmar Pool Tables Market Synopsis
As leisure activities gain traction among Myanmar's middle class, pool has emerged as a favored pastime, evident in the proliferation of pool tables in entertainment venues and private residences alike. The market showcases a diverse array of pool table designs, catering to various consumer tastes and budgets.
Local manufacturers are innovating by blending traditional craftsmanship with modern materials, producing tables that reflect both quality and aesthetic appeal. With the growing trend towards customization, consumers are eager to personalize their gaming experiences, further stimulating market growth.
Myanmar Pool Tables Market Key Takeaways
- The Myanmar pool tables market is experiencing a notable increase in demand driven by recreational interests and rising disposable incomes.
- High-quality tables with customizable features are becoming increasingly popular among consumers.
- The tourism sector is enhancing the demand for pool tables in hotels and resorts across the country.
- Domestic manufacturers are meeting local market needs through innovative designs and pricing strategies.
- Investment opportunities are emerging, particularly in manufacturing and entertainment venue establishment.
Evaluation of Restraints in Myanmar Pool Tables Market
Despite its growth potential, the Myanmar pool tables market faces significant challenges. Economic instability has resulted in limited disposable income for many consumers, constraining market reach. High import tariffs on luxury items, including pool tables, further exacerbate affordability issues for potential buyers. Additionally, inadequate infrastructure and distribution channels complicate market penetration, limiting access to a broader customer base. The overall awareness and interest in pool as a recreational activity remain relatively low, further restricting growth opportunities.
Myanmar Pool Tables Market Trends
Current trends highlight a marked shift towards high-quality, durable pool tables that meld traditional aesthetics with contemporary functionality. There's a growing consumer inclination towards tables featuring advanced specifications, such as adjustable leveling feet and premium-grade cloth. Furthermore, the demand for compact and space-efficient designs is rising, appealing to urban consumers who often navigate smaller living spaces. Customization options continue to resonate with buyers, enhancing their connection to the game.
Myanmar Pool Tables Market Opportunities
The landscape of the Myanmar pool tables market brims with investment prospects. As the middle class expands, along with increased leisure spending, the demand for pool tables is set to rise. Investors can capitalize on opportunities within the manufacturing sector by producing high-quality tables tailored to local preferences. Establishing billiards clubs or entertainment venues is another avenue for growth, attracting both locals and tourists. Collaboration with local entrepreneurs to enhance distribution networks can also be a strategic investment approach in this developing market.
Government Initiatives in the Myanmar Pool Tables Market
The Myanmar government has enacted various policies aimed at regulating the pool tables market. These initiatives include implementing licensing requirements for manufacturers and retailers to ensure product quality and consumer safety. Taxation policies are also in place to generate revenue while restrictions on imports aim to safeguard local manufacturers. Furthermore, regulations surrounding the potential gambling aspect of pool are enforced to maintain market integrity. Overall, these governmental efforts seek to foster a competitive landscape while supporting domestic production.
Future Insights of the Myanmar Pool Tables Market
Looking ahead to 2026-2032, the Myanmar pool tables market is positioned for promising growth. Factors such as a burgeoning middle-class population and a deepening interest in recreational activities are expected to elevate demand. As urbanization progresses, businesses will find enhanced opportunities to cater to the entertainment needs of an increasingly engaged populace. Elevated disposable incomes and shifting lifestyle priorities further underpin a positive outlook for this niche market segment.
Myanmar Pool Tables Market Latest Developments (2025 - 2026)
Recent developments in the Myanmar pool tables market indicate a growing emphasis on quality and customization. Manufacturers are increasingly integrating advanced technologies in table construction, while retailers focus on enhancing customer experiences through personalized offerings. Additionally, the expansion of recreational venues that feature billiards is attracting attention, as they cater to both local communities and tourists. The evolving landscape of leisure activities in Myanmar is shaping the future of the pool tables market significantly.
Myanmar Pool Tables Market - Key Attractiveness of the Report
- 10 Years of Market Numbers
- Historical Data Starting from 2022 to 2025
- Base Year: 2025
- Forecast Data until 2032
- Key Performance Indicators Impacting the Market
- Major Upcoming Developments and Projects
Key Highlights of the Report:
- Myanmar Pool Tables Market Outlook
- Market Size of Myanmar Pool Tables Market, 2025
- Forecast of Myanmar Pool Tables Market, 2032
- Historical Data and Forecast of Myanmar Pool Tables Revenues & Volume for the Period 2022-2032F
- Myanmar Pool Tables Market Trend Evolution
- Myanmar Pool Tables Market Drivers and Challenges
- Myanmar Pool Tables Price Trends
- Myanmar Pool Tables Porter's Five Forces
- Myanmar Pool Tables Industry Life Cycle
- Historical Data and Forecast of Myanmar Pool Tables Market Revenues & Volume By Type for the Period 2022-2032F
- Historical Data and Forecast of Myanmar Pool Tables Market Revenues & Volume By American Pool Table for the Period 2022-2032F
- Historical Data and Forecast of Myanmar Pool Tables Market Revenues & Volume By British Pool Table for the Period 2022-2032F
- Historical Data and Forecast of Myanmar Pool Tables Market Revenues & Volume By Material for the Period 2022-2032F
- Historical Data and Forecast of Myanmar Pool Tables Market Revenues & Volume By Slate Pool Table for the Period 2022-2032F
- Historical Data and Forecast of Myanmar Pool Tables Market Revenues & Volume By Wooden Pool Table for the Period 2022-2032F
- Historical Data and Forecast of Myanmar Pool Tables Market Revenues & Volume By Metallic Pool Table for the Period 2022-2032F
- Historical Data and Forecast of Myanmar Pool Tables Market Revenues & Volume By Rubber Pool Table for the Period 2022-2032F
- Historical Data and Forecast of Myanmar Pool Tables Market Revenues & Volume By End Use for the Period 2022-2032F
- Historical Data and Forecast of Myanmar Pool Tables Market Revenues & Volume By Residential for the Period 2022-2032F
- Historical Data and Forecast of Myanmar Pool Tables Market Revenues & Volume By Commercial for the Period 2022-2032F
- Historical Data and Forecast of Myanmar Pool Tables Market Revenues & Volume By Professional for the Period 2022-2032F
- Historical Data and Forecast of Myanmar Pool Tables Market Revenues & Volume By Distribution Channel for the Period 2022-2032F
- Historical Data and Forecast of Myanmar Pool Tables Market Revenues & Volume By Hypermarkets & Supermarkets for the Period 2022-2032F
- Historical Data and Forecast of Myanmar Pool Tables Market Revenues & Volume By Departmental Stores for the Period 2022-2032F
- Historical Data and Forecast of Myanmar Pool Tables Market Revenues & Volume By Specialty Stores for the Period 2022-2032F
- Historical Data and Forecast of Myanmar Pool Tables Market Revenues & Volume By Online Sales Channel for the Period 2022-2032F
- Myanmar Pool Tables Import Export Trade Statistics
- Market Opportunity Assessment By Type
- Market Opportunity Assessment By Material
- Market Opportunity Assessment By End Use
- Market Opportunity Assessment By Distribution Channel
- Myanmar Pool Tables Top Companies Market Share
- Myanmar Pool Tables Competitive Benchmarking By Technical and Operational Parameters
- Myanmar Pool Tables Company Profiles
- Myanmar Pool Tables Key Strategic Recommendations
Frequently Asked Questions About the Market Study (FAQs):
The Myanmar Pool Tables Market was estimated at USD 314 Million in 2025 and is projected to reach USD 419 Million by 2032, indicating strong growth opportunities.
The rising middle class, coupled with an increasing preference for leisure and social activities, has significantly driven the popularity of pool in Myanmar, leading to greater demand for pool tables.
Manufacturers often encounter challenges such as high import tariffs, inadequate distribution channels, and limited consumer awareness, which can hinder efficient market penetration.
Yes, there is a growing trend toward customization, with consumers showing interest in personalized designs, colors, and features tailored to their preferences.
The tourism sector is increasingly contributing to the market by driving demand for pool tables in hotels and entertainment venues, creating a ripple effect in the overall market dynamics.
6Wresearch actively monitors the Myanmar Pool Tables Market and publishes its comprehensive annual report, highlighting emerging trends, growth drivers, revenue analysis, and forecast outlook. Our insights help businesses to make data-backed strategic decisions with ongoing market dynamics. Our analysts track relevent industries related to the Myanmar Pool Tables Market, allowing our clients with actionable intelligence and reliable forecasts tailored to emerging regional needs.
Yes, we provide customisation as per your requirements. To learn more, feel free to contact us on sales@6wresearch.com
1 Executive Summary |
2 Introduction |
2.1 Key Highlights of the Report |
2.2 Report Description |
2.3 Market Scope & Segmentation |
2.4 Research Methodology |
2.5 Assumptions |
3 Myanmar Pool Tables Market Overview |
3.1 Myanmar Country Macro Economic Indicators |
3.2 Myanmar Pool Tables Market Revenues & Volume, 2022 & 2032F |
3.3 Myanmar Pool Tables Market - Industry Life Cycle |
3.4 Myanmar Pool Tables Market - Porter's Five Forces |
3.5 Myanmar Pool Tables Market Revenues & Volume Share, By Type, 2022 & 2032F |
3.6 Myanmar Pool Tables Market Revenues & Volume Share, By Material, 2022 & 2032F |
3.7 Myanmar Pool Tables Market Revenues & Volume Share, By End Use, 2022 & 2032F |
3.8 Myanmar Pool Tables Market Revenues & Volume Share, By Distribution Channel, 2022 & 2032F |
4 Myanmar Pool Tables Market Dynamics |
4.1 Impact Analysis |
4.2 Market Drivers |
4.2.1 Increasing disposable income of consumers in Myanmar leading to higher spending on leisure activities. |
4.2.2 Growing popularity of pool as a recreational sport in Myanmar. |
4.2.3 Rising number of entertainment venues and cafes incorporating pool tables to attract customers. |
4.3 Market Restraints |
4.3.1 Limited awareness and exposure to the game of pool among the general population in Myanmar. |
4.3.2 High import costs and duties on pool tables affecting affordability. |
4.3.3 Lack of skilled technicians for maintenance and repair of pool tables in Myanmar. |
5 Myanmar Pool Tables Market Trends |
6 Myanmar Pool Tables Market, By Types |
6.1 Myanmar Pool Tables Market, By Type |
6.1.1 Overview and Analysis |
6.1.2 Myanmar Pool Tables Market Revenues & Volume, By Type, 2022-2032F |
6.1.3 Myanmar Pool Tables Market Revenues & Volume, By American Pool Table, 2022-2032F |
6.1.4 Myanmar Pool Tables Market Revenues & Volume, By British Pool Table, 2022-2032F |
6.2 Myanmar Pool Tables Market, By Material |
6.2.1 Overview and Analysis |
6.2.2 Myanmar Pool Tables Market Revenues & Volume, By Slate Pool Table, 2022-2032F |
6.2.3 Myanmar Pool Tables Market Revenues & Volume, By Wooden Pool Table, 2022-2032F |
6.2.4 Myanmar Pool Tables Market Revenues & Volume, By Metallic Pool Table, 2022-2032F |
6.2.5 Myanmar Pool Tables Market Revenues & Volume, By Rubber Pool Table, 2022-2032F |
6.3 Myanmar Pool Tables Market, By End Use |
6.3.1 Overview and Analysis |
6.3.2 Myanmar Pool Tables Market Revenues & Volume, By Residential, 2022-2032F |
6.3.3 Myanmar Pool Tables Market Revenues & Volume, By Commercial, 2022-2032F |
6.3.4 Myanmar Pool Tables Market Revenues & Volume, By Professional, 2022-2032F |
6.4 Myanmar Pool Tables Market, By Distribution Channel |
6.4.1 Overview and Analysis |
6.4.2 Myanmar Pool Tables Market Revenues & Volume, By Hypermarkets & Supermarkets, 2022-2032F |
6.4.3 Myanmar Pool Tables Market Revenues & Volume, By Departmental Stores, 2022-2032F |
6.4.4 Myanmar Pool Tables Market Revenues & Volume, By Specialty Stores, 2022-2032F |
6.4.5 Myanmar Pool Tables Market Revenues & Volume, By Online Sales Channel, 2022-2032F |
7 Myanmar Pool Tables Market Import-Export Trade Statistics |
7.1 Myanmar Pool Tables Market Export to Major Countries |
7.2 Myanmar Pool Tables Market Imports from Major Countries |
8 Myanmar Pool Tables Market Key Performance Indicators |
8.1 Average monthly searches for pool tables in Myanmar on online platforms. |
8.2 Number of pool tournaments and events held in Myanmar annually. |
8.3 Percentage increase in the number of pool table suppliers and manufacturers in Myanmar. |
8.4 Average hourly rental rates for pool tables in entertainment venues and cafes in Myanmar. |
8.5 Number of social media followers or engagement metrics for pool table-related pages/accounts in Myanmar. |
9 Myanmar Pool Tables Market - Opportunity Assessment |
9.1 Myanmar Pool Tables Market Opportunity Assessment, By Type, 2022 & 2032F |
9.2 Myanmar Pool Tables Market Opportunity Assessment, By Material, 2022 & 2032F |
9.3 Myanmar Pool Tables Market Opportunity Assessment, By End Use, 2022 & 2032F |
9.4 Myanmar Pool Tables Market Opportunity Assessment, By Distribution Channel, 2022 & 2032F |
10 Myanmar Pool Tables Market - Competitive Landscape |
10.1 Myanmar Pool Tables Market Revenue Share, By Companies, 2025 |
10.2 Myanmar Pool Tables Market Competitive Benchmarking, By Operating and Technical Parameters |
11 Company Profiles |
12 Recommendations |
13 Disclaimer |
Global Go To Market Strategy - 2030
Export potential enables firms to identify high-growth global markets with greater confidence by combining advanced trade intelligence with a structured quantitative methodology. The framework analyzes emerging demand trends and country-level import patterns while integrating macroeconomic and trade datasets such as GDP and population forecasts, bilateral import–export flows, tariff structures, elasticity differentials between developed and developing economies, geographic distance, and import demand projections. Using weighted trade values from 2020–2024 as the base period to project country-to-country export potential for 2030, these inputs are operationalized through calculated drivers such as gravity model parameters, tariff impact factors, and projected GDP per-capita growth. Through an analysis of hidden potentials, demand hotspots, and market conditions that are most favorable to success, this method enables firms to focus on target countries, maximize returns, and global expansion with data, backed by accuracy.
By factoring in the projected importer demand gap that is currently unmet and could be potential opportunity, it identifies the potential for the Exporter (Country) among 190 countries, against the general trade analysis, which identifies the biggest importer or exporter.
To discover high-growth global markets and optimize your business strategy:
Click Here
Pricing
- Single User License$ 1,995
- Department License$ 2,400
- Site License$ 3,120
- Global License$ 3,795

Leadership Perspectives from Industry Events
Search
Thought Leadership and Analyst Meet


Our Clients
6WResearch In News
- India Air Conditioner Market Set for Strong Rebound in 2026 After Weather-Led Correction and GST-Driven Recovery: 6Wresearch
- ADAS in India: How Automatic Emergency Braking, Blind Spot Detection & Driver Monitoring are Transforming Road Safety
- Doha a strategic location for EV manufacturing hub: IPA Qatar
- Demand for luxury TVs surging in the GCC, says Samsung
- Empowering Growth: The Thriving Journey of Bangladesh’s Cable Industry
- Demand for luxury TVs surging in the GCC, says Samsung
Latest Reports
- Nicaragua RPG Gaming Market (2026-2032)
- New Zealand RPG Gaming Market (2026-2032)
- Netherlands RPG Gaming Market (2026-2032)
- Nauru RPG Gaming Market (2026-2032)
- Namibia RPG Gaming Market (2026-2032)
- Mozambique RPG Gaming Market (2026-2032)
- Montenegro RPG Gaming Market (2026-2032)
- Mongolia RPG Gaming Market (2026-2032)
- Monaco RPG Gaming Market (2026-2032)
- Micronesia RPG Gaming Market (2026-2032)
Industry Events and Analyst Meet

EV India Expo 2026

HIMTEX 2026

India Refining Summit 2026

India EV Show 2026

EV tech India Expo 2026
Whitepaper
- Middle East & Africa Commercial Security Market Click here to view more.
- Middle East & Africa Fire Safety Systems & Equipment Market Click here to view more.
- GCC Drone Market Click here to view more.
- Middle East Lighting Fixture Market Click here to view more.
- GCC Physical & Perimeter Security Market Click here to view more.