Myanmar Potassium sulphate Market (2025-2031) Outlook | Growth, Share, Revenue, Analysis, Forecast, Size, Industry, Trends, Companies & Value
Market Forecast By Form (Solid, Liquid), By Process (Mannheim Process, Sulphate Salts Reaction, Brine Processing, Others), By End-users (Agriculture, Industrial, Pharmaceuticals, Cosmetics, Food & Beverages, Others) And Competitive Landscape
| Product Code: ETC092933 | Publication Date: Jun 2021 | Updated Date: Apr 2025 | Product Type: Report | |
| Publisher: 6Wresearch | Author: Ravi Bhandari | No. of Pages: 70 | No. of Figures: 35 | No. of Tables: 5 |
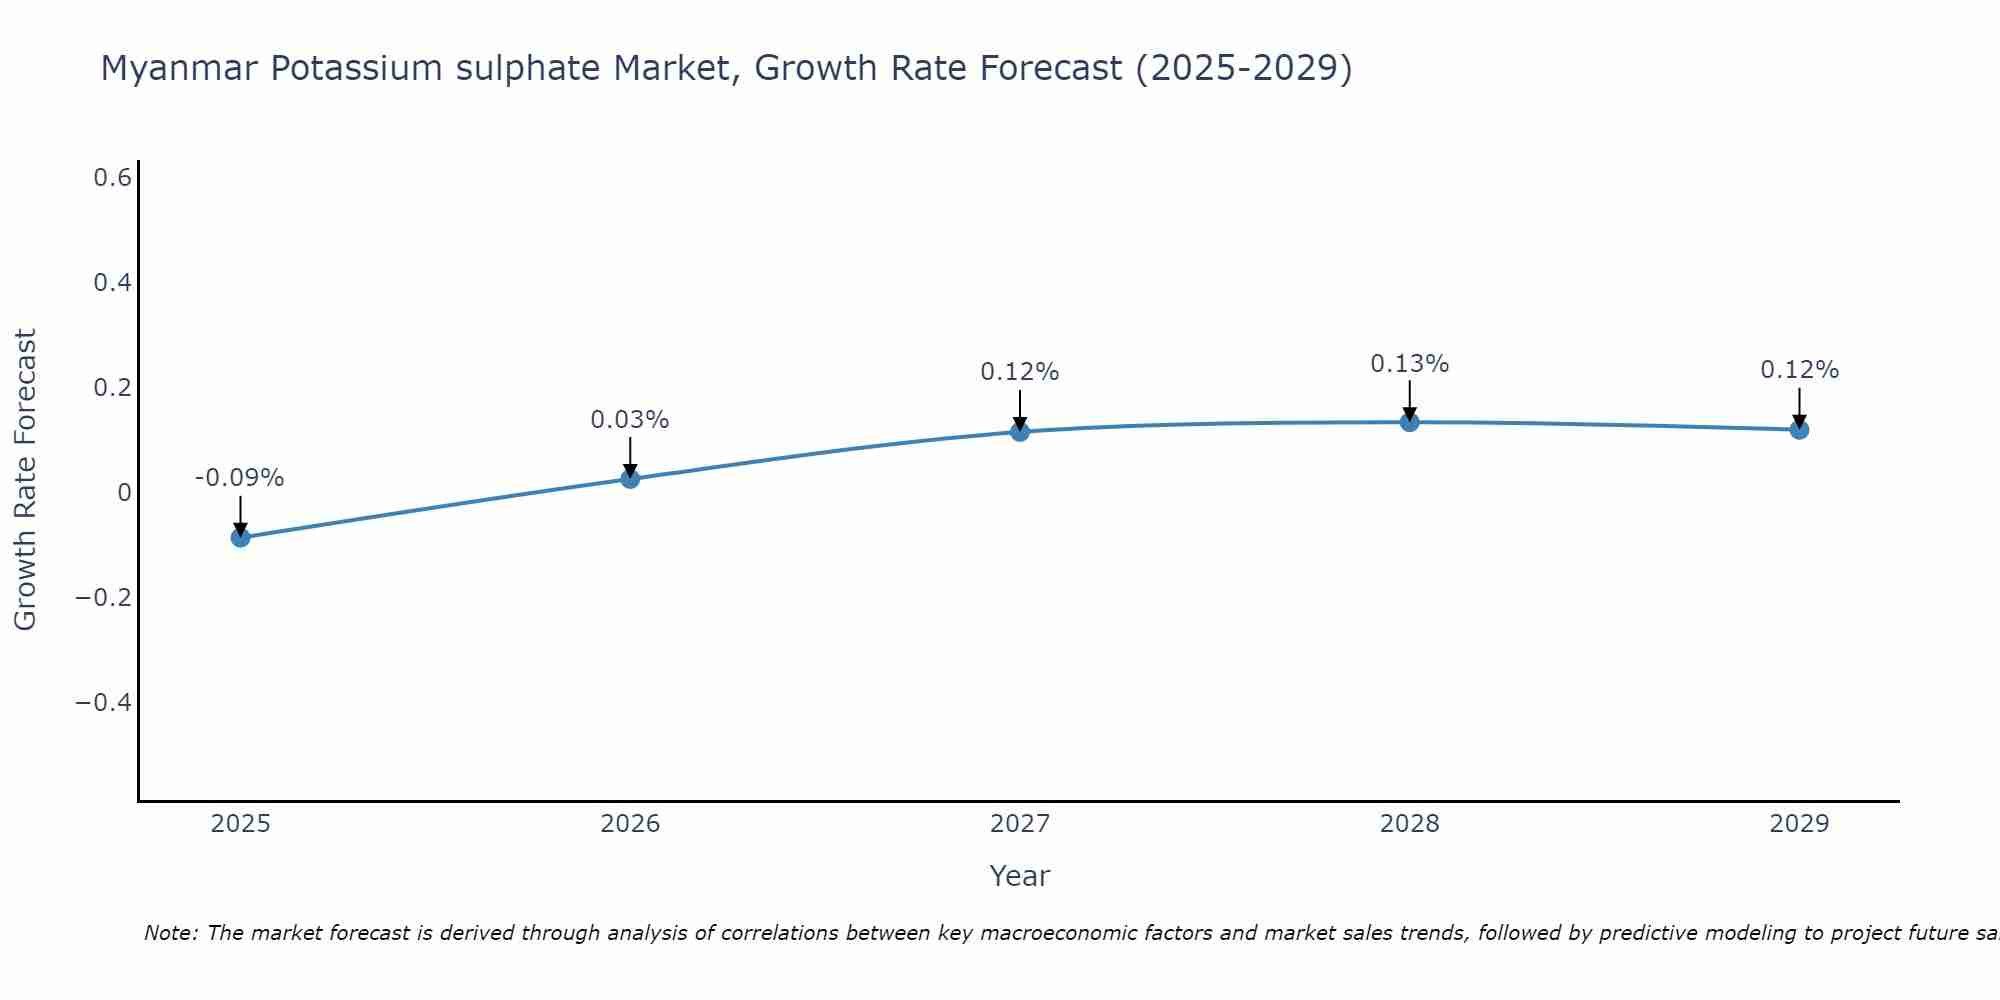
Myanmar Potassium sulphate Market Size Growth Rate
The Myanmar Potassium sulphate Market is projected to witness mixed growth rate patterns during 2025 to 2029. Growth accelerates to 0.13% in 2028, following an initial rate of -0.09%, before easing to 0.12% at the end of the period.
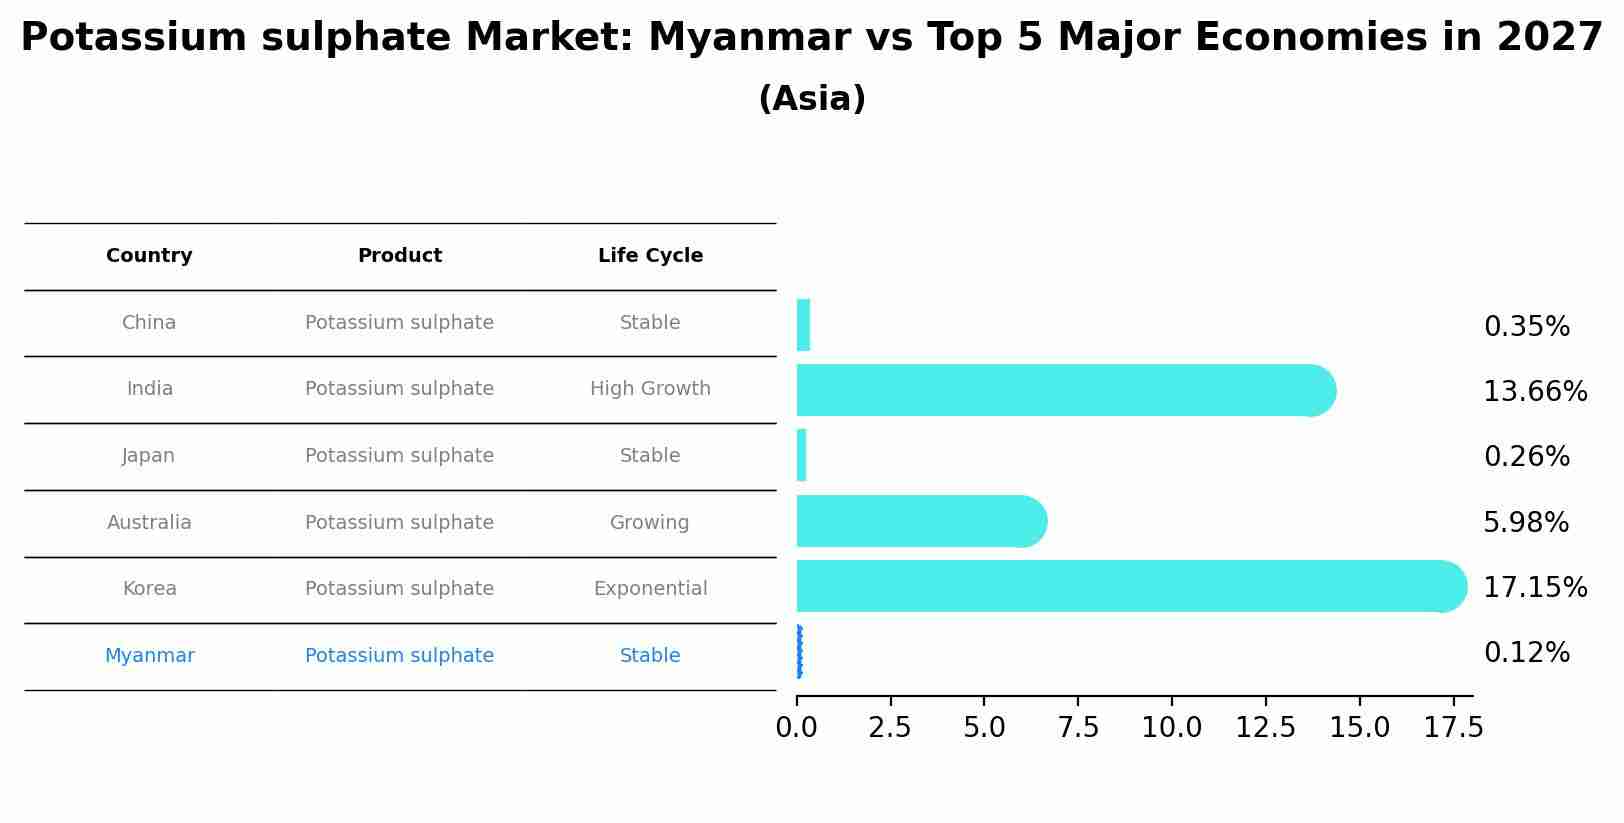
Potassium sulphate Market: Myanmar vs Top 5 Major Economies in 2027 (Asia)
The Potassium sulphate market in Myanmar is projected to grow at a stable growth rate of 0.12% by 2027, highlighting the country's increasing focus on advanced technologies within the Asia region, where China holds the dominant position, followed closely by India, Japan, Australia and South Korea, shaping overall regional demand.
Myanmar Potassium sulphate Market Overview
Potassium sulphate is used as a fertilizer to improve crop yields and soil quality. The market in Myanmar is expanding, driven by the agricultural sector`s growth and the increasing demand for high-quality crops. Potassium sulphate provides essential nutrients to plants, supporting healthy growth. As farmers adopt modern farming practices and seek to enhance productivity, the demand for potassium sulphate is expected to grow.
Drivers of the market
The agricultural sector in Myanmar is a key driver of the potassium sulfate market. With a growing focus on improving agricultural productivity and crop yields, farmers are increasingly adopting potassium sulfate fertilizers to address soil nutrient deficiencies and enhance plant growth. Additionally, the rising demand for high-value crops such as fruits and vegetables further fuels market growth.
Challenges of the market
Myanmar potassium sulphate market is confronted with issues such as the lack of domestic production facilities, leading to a heavy reliance on imports. This dependence exposes the market to international price fluctuations and supply chain interruptions. Additionally, there is limited awareness among farmers about the advantages of using potassium sulphate as a fertilizer, which restricts its market penetration. Inadequate infrastructure for storage and distribution further hampers the efficient supply of potassium sulphate to end-users, affecting market growth.
Government Policy of the market
Regulatory frameworks in Myanmar potassium sulfate market prioritize product quality and safety standards. Government policies govern production processes, import-export procedures, and industry practices to promote market competitiveness and consumer confidence.
Key Highlights of the Report:
- Myanmar Potassium sulphate Market Outlook
- Market Size of Myanmar Potassium sulphate Market, 2024
- Forecast of Myanmar Potassium sulphate Market, 2031
- Historical Data and Forecast of Myanmar Potassium sulphate Revenues & Volume for the Period 2021-2031
- Myanmar Potassium sulphate Market Trend Evolution
- Myanmar Potassium sulphate Market Drivers and Challenges
- Myanmar Potassium sulphate Price Trends
- Myanmar Potassium sulphate Porter's Five Forces
- Myanmar Potassium sulphate Industry Life Cycle
- Historical Data and Forecast of Myanmar Potassium sulphate Market Revenues & Volume By Form for the Period 2021-2031
- Historical Data and Forecast of Myanmar Potassium sulphate Market Revenues & Volume By Solid for the Period 2021-2031
- Historical Data and Forecast of Myanmar Potassium sulphate Market Revenues & Volume By Liquid for the Period 2021-2031
- Historical Data and Forecast of Myanmar Potassium sulphate Market Revenues & Volume By Process for the Period 2021-2031
- Historical Data and Forecast of Myanmar Potassium sulphate Market Revenues & Volume By Mannheim Process for the Period 2021-2031
- Historical Data and Forecast of Myanmar Potassium sulphate Market Revenues & Volume By Sulphate Salts Reaction for the Period 2021-2031
- Historical Data and Forecast of Myanmar Potassium sulphate Market Revenues & Volume By Brine Processing for the Period 2021-2031
- Historical Data and Forecast of Myanmar Potassium sulphate Market Revenues & Volume By Others for the Period 2021-2031
- Historical Data and Forecast of Myanmar Potassium sulphate Market Revenues & Volume By End-users for the Period 2021-2031
- Historical Data and Forecast of Myanmar Potassium sulphate Market Revenues & Volume By Agriculture for the Period 2021-2031
- Historical Data and Forecast of Myanmar Potassium sulphate Market Revenues & Volume By Industrial for the Period 2021-2031
- Historical Data and Forecast of Myanmar Potassium sulphate Market Revenues & Volume By Pharmaceuticals for the Period 2021-2031
- Historical Data and Forecast of Myanmar Potassium sulphate Market Revenues & Volume By Cosmetics for the Period 2021-2031
- Historical Data and Forecast of Myanmar Potassium sulphate Market Revenues & Volume By Food & Beverages for the Period 2021-2031
- Historical Data and Forecast of Myanmar Potassium sulphate Market Revenues & Volume By Others for the Period 2021-2031
- Myanmar Potassium sulphate Import Export Trade Statistics
- Market Opportunity Assessment By Form
- Market Opportunity Assessment By Process
- Market Opportunity Assessment By End-users
- Myanmar Potassium sulphate Top Companies Market Share
- Myanmar Potassium sulphate Competitive Benchmarking By Technical and Operational Parameters
- Myanmar Potassium sulphate Company Profiles
- Myanmar Potassium sulphate Key Strategic Recommendations
Frequently Asked Questions About the Market Study (FAQs):
6Wresearch actively monitors the Myanmar Potassium sulphate Market and publishes its comprehensive annual report, highlighting emerging trends, growth drivers, revenue analysis, and forecast outlook. Our insights help businesses to make data-backed strategic decisions with ongoing market dynamics. Our analysts track relevent industries related to the Myanmar Potassium sulphate Market, allowing our clients with actionable intelligence and reliable forecasts tailored to emerging regional needs.
Yes, we provide customisation as per your requirements. To learn more, feel free to contact us on sales@6wresearch.com
1 Executive Summary |
2 Introduction |
2.1 Key Highlights of the Report |
2.2 Report Description |
2.3 Market Scope & Segmentation |
2.4 Research Methodology |
2.5 Assumptions |
3 Myanmar Potassium sulphate Market Overview |
3.1 Myanmar Country Macro Economic Indicators |
3.2 Myanmar Potassium sulphate Market Revenues & Volume, 2021 & 2031F |
3.3 Myanmar Potassium sulphate Market - Industry Life Cycle |
3.4 Myanmar Potassium sulphate Market - Porter's Five Forces |
3.5 Myanmar Potassium sulphate Market Revenues & Volume Share, By Form, 2021 & 2031F |
3.6 Myanmar Potassium sulphate Market Revenues & Volume Share, By Process, 2021 & 2031F |
3.7 Myanmar Potassium sulphate Market Revenues & Volume Share, By End-users, 2021 & 2031F |
4 Myanmar Potassium sulphate Market Dynamics |
4.1 Impact Analysis |
4.2 Market Drivers |
4.3 Market Restraints |
5 Myanmar Potassium sulphate Market Trends |
6 Myanmar Potassium sulphate Market, By Types |
6.1 Myanmar Potassium sulphate Market, By Form |
6.1.1 Overview and Analysis |
6.1.2 Myanmar Potassium sulphate Market Revenues & Volume, By Form, 2021-2031F |
6.1.3 Myanmar Potassium sulphate Market Revenues & Volume, By Solid , 2021-2031F |
6.1.4 Myanmar Potassium sulphate Market Revenues & Volume, By Liquid , 2021-2031F |
6.2 Myanmar Potassium sulphate Market, By Process |
6.2.1 Overview and Analysis |
6.2.2 Myanmar Potassium sulphate Market Revenues & Volume, By Mannheim Process, 2021-2031F |
6.2.3 Myanmar Potassium sulphate Market Revenues & Volume, By Sulphate Salts Reaction, 2021-2031F |
6.2.4 Myanmar Potassium sulphate Market Revenues & Volume, By Brine Processing, 2021-2031F |
6.2.5 Myanmar Potassium sulphate Market Revenues & Volume, By Others, 2021-2031F |
6.3 Myanmar Potassium sulphate Market, By End-users |
6.3.1 Overview and Analysis |
6.3.2 Myanmar Potassium sulphate Market Revenues & Volume, By Agriculture, 2021-2031F |
6.3.3 Myanmar Potassium sulphate Market Revenues & Volume, By Industrial, 2021-2031F |
6.3.4 Myanmar Potassium sulphate Market Revenues & Volume, By Pharmaceuticals, 2021-2031F |
6.3.5 Myanmar Potassium sulphate Market Revenues & Volume, By Cosmetics, 2021-2031F |
6.3.6 Myanmar Potassium sulphate Market Revenues & Volume, By Food & Beverages, 2021-2031F |
6.3.7 Myanmar Potassium sulphate Market Revenues & Volume, By Others, 2021-2031F |
7 Myanmar Potassium sulphate Market Import-Export Trade Statistics |
7.1 Myanmar Potassium sulphate Market Export to Major Countries |
7.2 Myanmar Potassium sulphate Market Imports from Major Countries |
8 Myanmar Potassium sulphate Market Key Performance Indicators |
9 Myanmar Potassium sulphate Market - Opportunity Assessment |
9.1 Myanmar Potassium sulphate Market Opportunity Assessment, By Form, 2021 & 2031F |
9.2 Myanmar Potassium sulphate Market Opportunity Assessment, By Process, 2021 & 2031F |
9.3 Myanmar Potassium sulphate Market Opportunity Assessment, By End-users, 2021 & 2031F |
10 Myanmar Potassium sulphate Market - Competitive Landscape |
10.1 Myanmar Potassium sulphate Market Revenue Share, By Companies, 2024 |
10.2 Myanmar Potassium sulphate Market Competitive Benchmarking, By Operating and Technical Parameters |
11 Company Profiles |
12 Recommendations |
13 Disclaimer |
Export potential assessment - trade Analytics for 2030
Export potential enables firms to identify high-growth global markets with greater confidence by combining advanced trade intelligence with a structured quantitative methodology. The framework analyzes emerging demand trends and country-level import patterns while integrating macroeconomic and trade datasets such as GDP and population forecasts, bilateral import–export flows, tariff structures, elasticity differentials between developed and developing economies, geographic distance, and import demand projections. Using weighted trade values from 2020–2024 as the base period to project country-to-country export potential for 2030, these inputs are operationalized through calculated drivers such as gravity model parameters, tariff impact factors, and projected GDP per-capita growth. Through an analysis of hidden potentials, demand hotspots, and market conditions that are most favorable to success, this method enables firms to focus on target countries, maximize returns, and global expansion with data, backed by accuracy.
By factoring in the projected importer demand gap that is currently unmet and could be potential opportunity, it identifies the potential for the Exporter (Country) among 190 countries, against the general trade analysis, which identifies the biggest importer or exporter.
To discover high-growth global markets and optimize your business strategy:
Click Here
Pricing
- Single User License$ 1,995
- Department License$ 2,400
- Site License$ 3,120
- Global License$ 3,795

Search
Thought Leadership and Analyst Meet


Our Clients
Latest Reports
- China Electric Appliance Rental Market (2026-2032) | Trends, Revenue, Growth, Challenges, Size, Value, Outlook, Pricing, Strategy, Insights, Restraints, segmentation, Companies, Investment Opportunities, Analysis, Demand, Drivers, Competition, Forecast, Share
- Chile Electric Appliance Rental Market (2026-2032) | Outlook, Competition, Drivers, Strategy, Revenue, Analysis, Value, Pricing, Restraints, Size, Demand, Share, Growth, Forecast, Challenges, Insights, Investment Opportunities, Companies, Trends, segmentation
- Cambodia Electric Appliance Rental Market (2026-2032) | Companies, Analysis, Restraints, Pricing, Insights, Challenges, Outlook, Strategy, Forecast, Trends, Competition, Value, Revenue, Investment Opportunities, segmentation, Drivers, Size, Demand, Growth, Share
- Brazil Electric Appliance Rental Market (2026-2032) | Revenue, Strategy, Forecast, Companies, segmentation, Competition, Size, Investment Opportunities, Pricing, Restraints, Outlook, Challenges, Analysis, Drivers, Value, Demand, Insights, Trends, Growth, Share
- Bangladesh Electric Appliance Rental Market (2026-2032) | Drivers, Forecast, Investment Opportunities, Strategy, Insights, Demand, Challenges, Outlook, Trends, Competition, Value, Revenue, Size, Pricing, Analysis, Companies, Restraints, segmentation, Share, Growth
- Bahrain Electric Appliance Rental Market (2026-2032) | Outlook, Size, Competition, Restraints, Drivers, Value, Trends, Investment Opportunities, Insights, Forecast, Revenue, Strategy, Growth, Share, Demand, Analysis, Challenges, Companies, segmentation, Pricing
- Azerbaijan Electric Appliance Rental Market (2026-2032) | Trends, Investment Opportunities, Restraints, Insights, Strategy, Competition, Value, Growth, Demand, Drivers, Analysis, Forecast, Size, Share, Outlook, segmentation, Pricing, Challenges, Revenue, Companies
- Australia Electric Appliance Rental Market (2026-2032) | Challenges, Restraints, Forecast, Demand, Size, Competition, Pricing, Investment Opportunities, Revenue, Trends, Drivers, Growth, Outlook, Analysis, Strategy, Value, segmentation, Insights, Companies, Share
- Argentina Electric Appliance Rental Market (2026-2032) | Growth, Trends, Insights, Outlook, Forecast, Size, Drivers, Analysis, Restraints, Challenges, Share, Revenue, Investment Opportunities, Strategy, Demand, Value, Companies, segmentation, Competition, Pricing
- Algeria Electric Appliance Rental Market (2026-2032) | Share, Size, Value, Strategy, Competition, Outlook, Challenges, Companies, Trends, Pricing, Insights, Forecast, Investment Opportunities, Revenue, Growth, Restraints, segmentation, Analysis, Demand, Drivers
Industry Events and Analyst Meet

HIMTEX 2026

India Refining Summit 2026

India EV Show 2026

EV tech India Expo 2026

Auto Tech Asia 2026
Whitepaper
- Middle East & Africa Commercial Security Market Click here to view more.
- Middle East & Africa Fire Safety Systems & Equipment Market Click here to view more.
- GCC Drone Market Click here to view more.
- Middle East Lighting Fixture Market Click here to view more.
- GCC Physical & Perimeter Security Market Click here to view more.
6WResearch In News
- Doha a strategic location for EV manufacturing hub: IPA Qatar
- Demand for luxury TVs surging in the GCC, says Samsung
- Empowering Growth: The Thriving Journey of Bangladesh’s Cable Industry
- Demand for luxury TVs surging in the GCC, says Samsung
- Video call with a traditional healer? Once unthinkable, it’s now common in South Africa
- Intelligent Buildings To Smooth GCC’s Path To Net Zero