Nepal Chemical Packaging Market (2026-2032) | Share, Growth, Companies, Trends, Revenue, Outlook, Analysis, Industry, Value, Size & Forecast
Market Forecast By Product Types (Sacks, Drums, FIBC, Other), By Applications (Pharmaceutical Factory, Laboratory, Chemical Plant, Others) And Competitive Landscape
| Product Code: ETC006896 | Publication Date: Sep 2020 | Updated Date: Jun 2026 | Product Type: Report | |
| Publisher: 6Wresearch | Author: Bhawna Singh | No. of Pages: 70 | No. of Figures: 35 | No. of Tables: 5 |
Nepal Chemical Packaging Market Summary
The nepal chemical packaging market was estimated at USD 991 Million in 2025 and is projected to reach USD 1411 Million by 2032, growing at a CAGR of 6.3% from 2026 to 2032.
Nepal Chemical Packaging Market Year-wise Growth Rate and Key Drivers
This graph highlights how the Nepal Chemical Packaging Market has steadily grown over the past five years, supported by major growth factors.
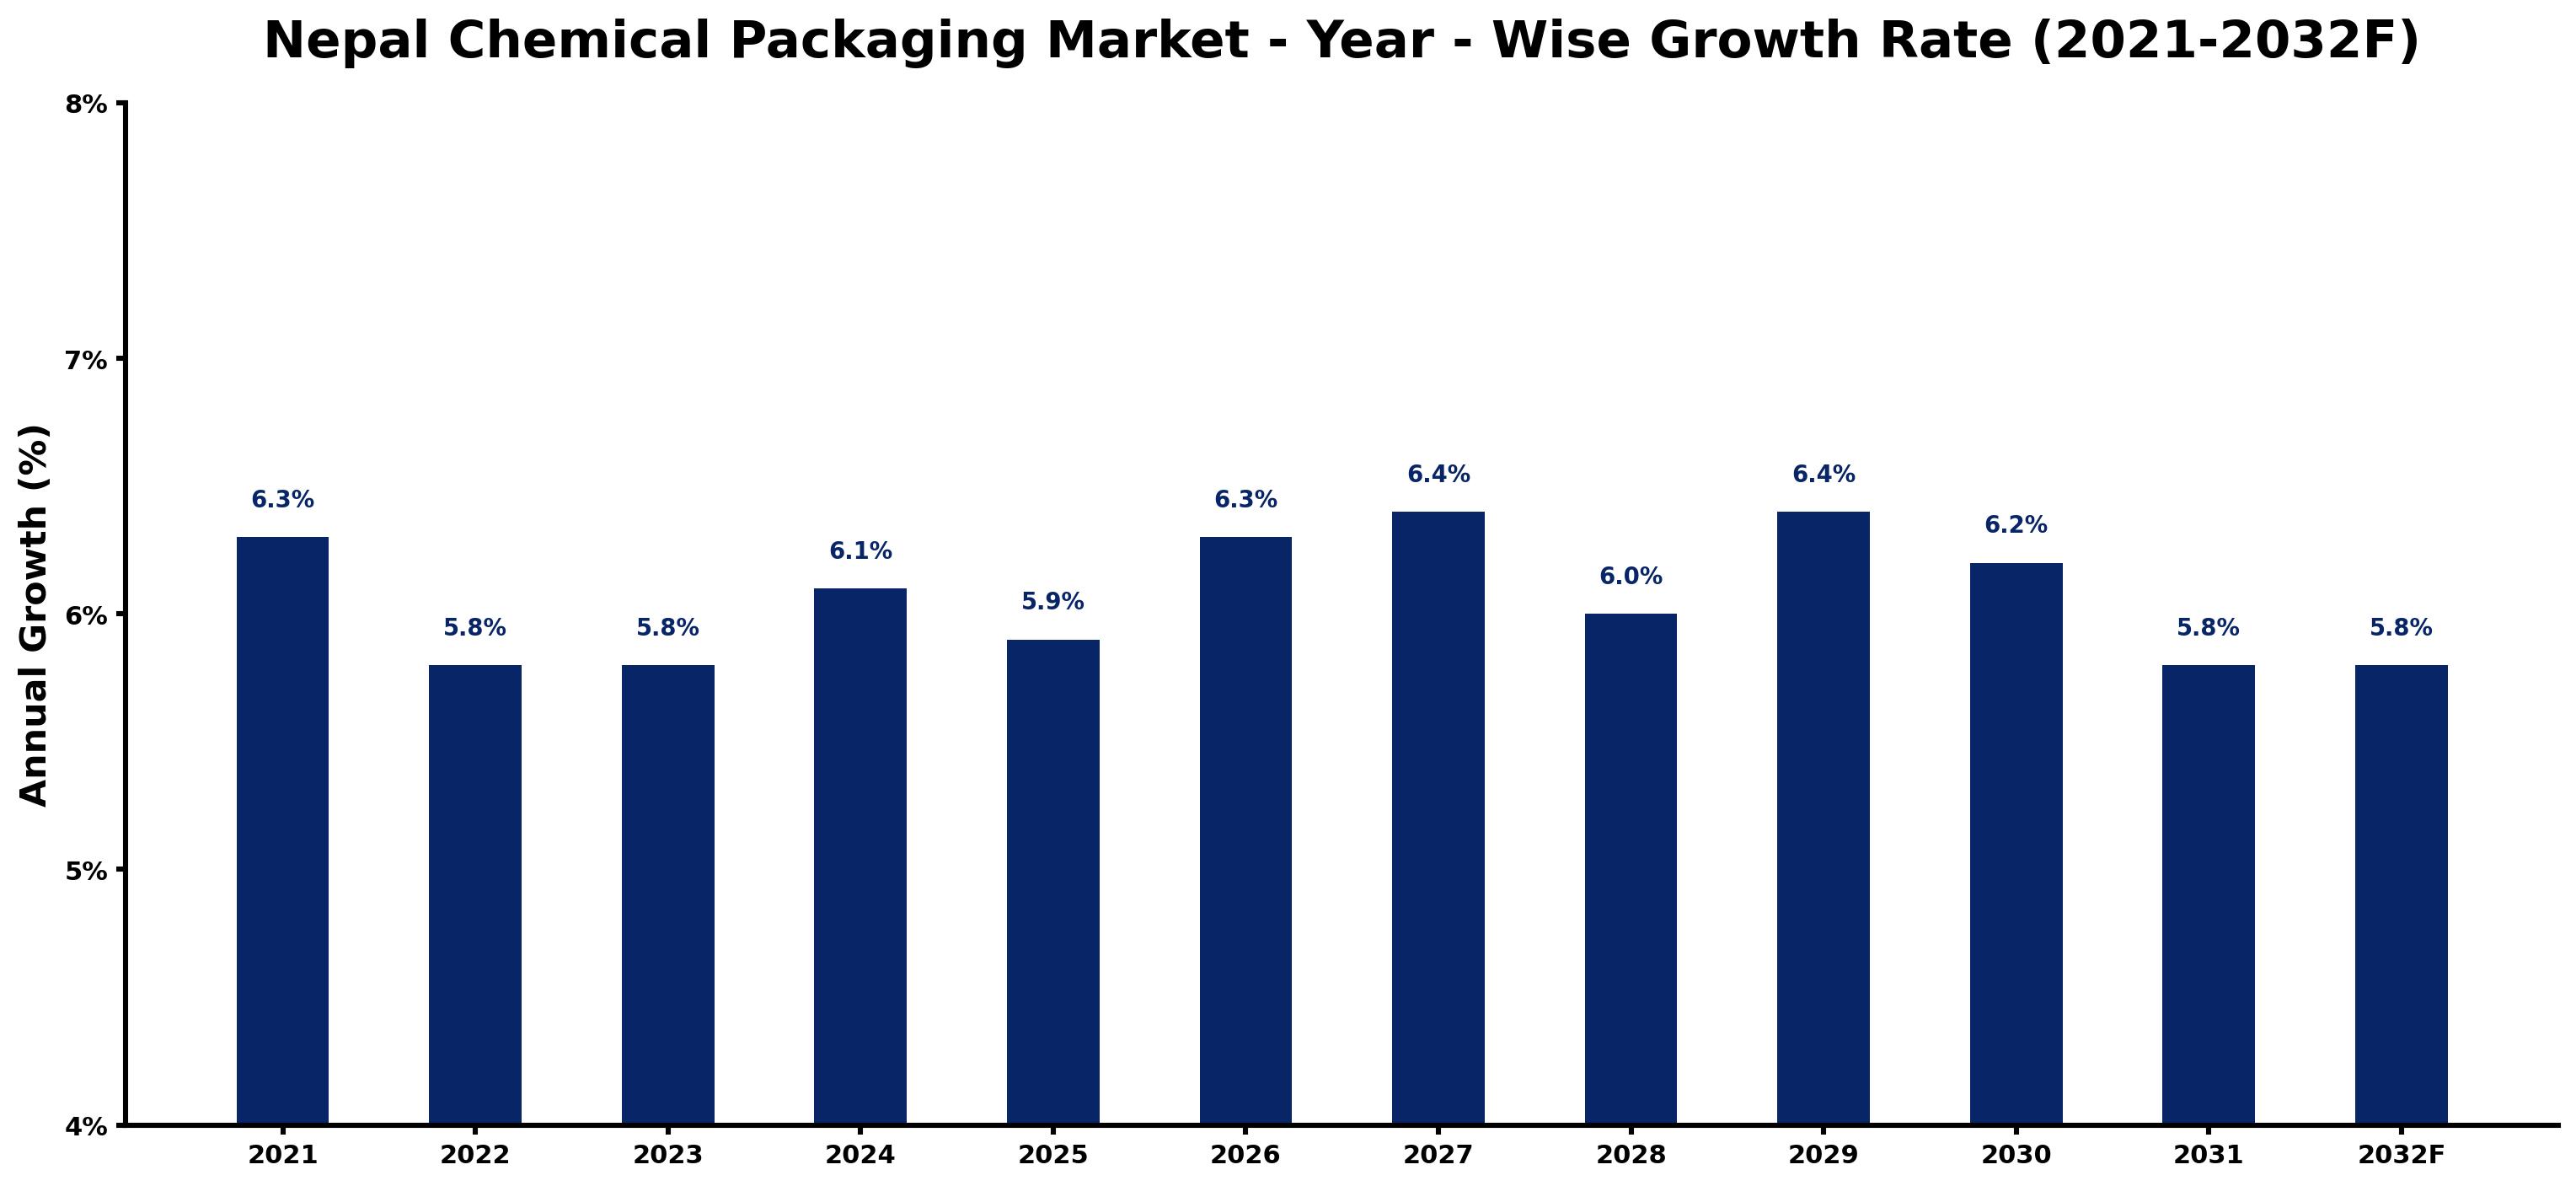
The table below presents the year wise growth rates along with the key drivers influencing the market
| Year | Growth Rate | Major Drivers |
| 2021 | 6.3% | The pandemic highlighted the need for safe, reliable chemical packaging solutions. |
| 2022 | 5.8% | Local manufacturers began investing in innovative packaging technologies and materials. |
| 2023 | 5.8% | Shifts towards sustainable practices prompted interest in biodegradable packaging options. |
| 2024 | 6.1% | A surge in e-commerce led to increased packaging requirements for chemicals. |
| 2025 | 5.9% | Infrastructure development in urban areas created demand for specialized chemical packaging. |
| 2026 | 6.3% | International partnerships with chemical firms opened avenues for advanced packaging solutions. |
| 2027 | 6.4% | Consumer awareness about safety standards spurred stricter packaging compliance measures. |
| 2028 | 6.0% | Emergence of new market players enhanced competition and innovation within the sector. |
| 2029 | 6.4% | Rising demand for agrochemicals necessitated better packaging to ensure product integrity. |
| 2030 | 6.2% | Technological advancements in recycling processes improved the sustainability of packaging formats. |
| 2031 | 5.8% | Investment in logistics networks streamlined distribution, benefiting chemical packaging efficiency. |
| 2032 | 5.8% | The trend of localized production reduced reliance on imported packaging materials significantly. |
Note - Market size estimations and growth projections presented in this report are based on 6Wresearch's advanced forecasting approach, validated with industry datasets as of June 2026.
Nepal Chemical Packaging Market Synopsis
The Nepal Chemical Packaging Market is projected to reach 6.3% and witness significant growth during the forecast period (2026-2032). Driven by the expanding chemical industry, the demand for effective packaging solutions is on the rise, establishing a substantial market ecosystem comprising both domestic and international players. This diversity in participation enriches the market landscape with a plethora of packaging options, including plastic containers, drums, jerry cans, and flexible packaging materials which are crucial for the safe storage and transportation of chemicals.
Nepal Chemical Packaging Market Growth Drivers
The growth trajectory of the Nepal Chemical Packaging Market is primarily fueled by several key factors:
- The expanding chemical sector in Nepal is a pivotal driver, as increasing production and consumption of chemicals necessitate robust and safe packaging solutions.
- Rising awareness regarding the significance of secure packaging in preventing leaks and contamination is propelling businesses to invest in advanced materials.
- Stricter regulations regarding packaging standards are reshaping the market, compelling producers to upgrade their packaging protocols to comply with safety norms.
- The shift towards sustainability is prompting companies to innovate and develop eco-friendly packaging materials, aligning with global environmental initiatives.
- The growing trend of urbanization is influencing consumer habits, increasing the demand for more diverse and tailored packaging solutions that cater to specific needs.
Nepal Chemical Packaging Market Trends and Opportunities
As the Nepal Chemical Packaging Market continues to evolve, several noteworthy trends are emerging:
- There is a notable shift towards sustainable and biodegradable packaging options, as companies strive to minimize their environmental footprints and cater to eco-conscious consumers.
- Innovative packaging solutions incorporating advanced technologies, such as smart packaging and anti-counterfeiting measures, are gaining traction, enhancing product safety and consumer trust.
- Customization of packaging solutions is becoming increasingly important, with businesses seeking to tailor their offerings to meet specific client requirements and preferences.
- The rise of the e-commerce sector is creating additional demand for durable and reliable packaging solutions, as online sales of chemicals grow and require efficient delivery systems.
- Collaboration between packaging manufacturers and chemical producers is fostering opportunities for innovative product development, enhancing efficiency and market responsiveness.
Nepal Chemical Packaging Market Challenges and Restraints
Despite its growth potential, the Nepal Chemical Packaging Market faces several challenges:
- Infrastructural deficiencies hinder the efficient transportation and storage of chemical products, posing risks to product integrity and safety.
- A lack of standardized regulations for chemical packaging materials and processes can lead to inconsistencies in quality and safety among products.
- Limited access to advanced packaging technology may restrict the innovation capability of local manufacturers, impacting their competitive edge.
- Environmental concerns related to waste management and sustainability remain critical issues that the industry must address through more responsible practices.
- The prevalence of counterfeit products in the market can undermine consumer trust and affect the overall perception of the chemical packaging sector.
Nepal Chemical Packaging Market Investment Opportunities
The evolving landscape of the Nepal Chemical Packaging Market presents numerous investment avenues:
- Investing in specialized manufacturing facilities for chemical packaging products, such as tailored drums and containers, can yield significant returns.
- The surge in demand for eco-friendly packaging solutions creates lucrative opportunities for investments in the production of biodegradable and recyclable materials.
- Engaging in partnerships with local chemical manufacturers to develop bespoke packaging solutions that align with their requirements can drive mutual growth.
- The ongoing push for innovation presents opportunities for companies to invest in cutting-edge technology that enhances packaging integrity and consumer engagement.
- Exploring potential export markets for Nepal's chemical packaging offerings can open new revenue streams as global demand for sustainable packaging rises.
Nepal Chemical Packaging Market Government Investment and Initiatives
The government of Nepal has undertaken various initiatives to bolster the chemical packaging market. Key policies focus on enhancing safety standards for packaging, incorporating stringent labeling regulations to ensure consumer awareness of chemical products. These regulatory frameworks aim to promote responsible manufacturing practices and minimize environmental impacts associated with chemical packaging waste.
Incentives for companies that adopt eco-friendly packaging materials reflect the government's commitment to sustainability. Furthermore, public spending on infrastructure improvements is vital for advancing storage and transportation capabilities within the chemical sector. By fostering a regulatory environment that promotes innovation and safety, the government is laying the foundation for sustainable market growth.
Nepal Chemical Packaging Market Latest Developments (May 2025 - June 2026)
In recent months, the Nepal Chemical Packaging Market has experienced several noteworthy developments. A heightened emphasis on sustainability has led companies to innovate with more environmentally friendly packaging solutions, aligning their products with global standards. Additionally, advancements in smart packaging technologies have begun to emerge, enhancing both safety and efficiency in chemical distribution.
Industry stakeholders are increasingly collaborating to push forward customized solutions, catering to the specific demands of the chemical sector. Initiatives aimed at addressing counterfeit product challenges have also gained momentum, as companies implement stronger anti-counterfeiting measures within their packaging designs. These developments collectively reflect the market's pivot towards greater sustainability and enhanced consumer protection.
Nepal Chemical Packaging Market - Key Attractiveness of the Report
- 10 Years of Market Numbers
- Historical Data Starting from 2022 to 2025
- Base Year: 2025
- Forecast Data until 2032
- Key Performance Indicators Impacting the Market
- Major Upcoming Developments and Projects
Key Highlights of the Report:
- Nepal Chemical Packaging Market Outlook
- Market Size of Nepal Chemical Packaging Market, 2025
- Forecast of Nepal Chemical Packaging Market, 2032F
- Historical Data and Forecast of Nepal Chemical Packaging Revenues & Volume for the Period 2022-2032F
- Nepal Chemical Packaging Market Trend Evolution
- Nepal Chemical Packaging Market Drivers and Challenges
- Nepal Chemical Packaging Price Trends
- Nepal Chemical Packaging Porter's Five Forces
- Nepal Chemical Packaging Industry Life Cycle
- Historical Data and Forecast of Nepal Chemical Packaging Market Revenues & Volume By Product Types for the Period 2022-2032F
- Historical Data and Forecast of Nepal Chemical Packaging Market Revenues & Volume By Sacks for the Period 2022-2032F
- Historical Data and Forecast of Nepal Chemical Packaging Market Revenues & Volume By Drums for the Period 2022-2032F
- Historical Data and Forecast of Nepal Chemical Packaging Market Revenues & Volume By FIBC for the Period 2022-2032F
- Historical Data and Forecast of Nepal Chemical Packaging Market Revenues & Volume By Other for the Period 2022-2032F
- Historical Data and Forecast of Nepal Chemical Packaging Market Revenues & Volume By Applications for the Period 2022-2032F
- Historical Data and Forecast of Nepal Chemical Packaging Market Revenues & Volume By Pharmaceutical Factory? for the Period 2022-2032F
- Historical Data and Forecast of Nepal Chemical Packaging Market Revenues & Volume By Laboratory for the Period 2022-2032F
- Historical Data and Forecast of Nepal Chemical Packaging Market Revenues & Volume By Chemical Plant? for the Period 2022-2032F
- Historical Data and Forecast of Nepal Chemical Packaging Market Revenues & Volume By Others for the Period 2022-2032F
- Nepal Chemical Packaging Import Export Trade Statistics
- Market Opportunity Assessment By Product Types
- Market Opportunity Assessment By Applications
- Nepal Chemical Packaging Top Companies Market Share
- Nepal Chemical Packaging Competitive Benchmarking By Technical and Operational Parameters
- Nepal Chemical Packaging Company Profiles
- Nepal Chemical Packaging Key Strategic Recommendations
Frequently Asked Questions About the Market Study (FAQs):
The market is driven by the expanding chemical industry, increased awareness of safe packaging, regulatory pressure for compliance, and a growing emphasis on sustainability.
Key challenges include infrastructural inadequacies, lack of standardized regulations, limited access to advanced technologies, and concerns regarding counterfeit products.
Yes, opportunities exist in specialized manufacturing, sustainable packaging solutions, technological advancements, and collaboration with local chemical producers.
The government implements regulations to ensure safety standards, promotes eco-friendly practices, and invests in infrastructure improvements to support the chemical packaging sector.
6Wresearch actively monitors the Nepal Chemical Packaging Market and publishes its comprehensive annual report, highlighting emerging trends, growth drivers, revenue analysis, and forecast outlook. Our insights help businesses to make data-backed strategic decisions with ongoing market dynamics. Our analysts track relevent industries related to the Nepal Chemical Packaging Market, allowing our clients with actionable intelligence and reliable forecasts tailored to emerging regional needs.
Yes, we provide customisation as per your requirements. To learn more, feel free to contact us on sales@6wresearch.com
1 Executive Summary |
2 Introduction |
2.1 Key Highlights of the Report |
2.2 Report Description |
2.3 Market Scope & Segmentation |
2.4 Research Methodology |
2.5 Assumptions |
3 Nepal Chemical Packaging Market Overview |
3.1 Nepal Country Macro Economic Indicators |
3.2 Nepal Chemical Packaging Market Revenues & Volume, 2022 & 2032F |
3.3 Nepal Chemical Packaging Market - Industry Life Cycle |
3.4 Nepal Chemical Packaging Market - Porter's Five Forces |
3.5 Nepal Chemical Packaging Market Revenues & Volume Share, By Product Types, 2022 & 2032F |
3.6 Nepal Chemical Packaging Market Revenues & Volume Share, By Applications, 2022 & 2032F |
4 Nepal Chemical Packaging Market Dynamics |
4.1 Impact Analysis |
4.2 Market Drivers |
4.3 Market Restraints |
5 Nepal Chemical Packaging Market Trends |
6 Nepal Chemical Packaging Market, By Types |
6.1 Nepal Chemical Packaging Market, By Product Types |
6.1.1 Overview and Analysis |
6.1.2 Nepal Chemical Packaging Market Revenues & Volume, By Product Types, 2022-2032F |
6.1.3 Nepal Chemical Packaging Market Revenues & Volume, By Sacks, 2022-2032F |
6.1.4 Nepal Chemical Packaging Market Revenues & Volume, By Drums, 2022-2032F |
6.1.5 Nepal Chemical Packaging Market Revenues & Volume, By FIBC, 2022-2032F |
6.1.6 Nepal Chemical Packaging Market Revenues & Volume, By Other, 2022-2032F |
6.2 Nepal Chemical Packaging Market, By Applications |
6.2.1 Overview and Analysis |
6.2.2 Nepal Chemical Packaging Market Revenues & Volume, By Pharmaceutical Factory , 2022-2032F |
6.2.3 Nepal Chemical Packaging Market Revenues & Volume, By Laboratory, 2022-2032F |
6.2.4 Nepal Chemical Packaging Market Revenues & Volume, By Chemical Plant , 2022-2032F |
6.2.5 Nepal Chemical Packaging Market Revenues & Volume, By Others, 2022-2032F |
7 Nepal Chemical Packaging Market Import-Export Trade Statistics |
7.1 Nepal Chemical Packaging Market Export to Major Countries |
7.2 Nepal Chemical Packaging Market Imports from Major Countries |
8 Nepal Chemical Packaging Market Key Performance Indicators |
9 Nepal Chemical Packaging Market - Opportunity Assessment |
9.1 Nepal Chemical Packaging Market Opportunity Assessment, By Product Types, 2022 & 2032F |
9.2 Nepal Chemical Packaging Market Opportunity Assessment, By Applications, 2022 & 2032F |
10 Nepal Chemical Packaging Market - Competitive Landscape |
10.1 Nepal Chemical Packaging Market Revenue Share, By Companies, 2025 |
10.2 Nepal Chemical Packaging Market Competitive Benchmarking, By Operating and Technical Parameters |
11 Company Profiles |
12 Recommendations |
13 Disclaimer |
Global Go To Market Strategy - 2030
Export potential enables firms to identify high-growth global markets with greater confidence by combining advanced trade intelligence with a structured quantitative methodology. The framework analyzes emerging demand trends and country-level import patterns while integrating macroeconomic and trade datasets such as GDP and population forecasts, bilateral import–export flows, tariff structures, elasticity differentials between developed and developing economies, geographic distance, and import demand projections. Using weighted trade values from 2020–2024 as the base period to project country-to-country export potential for 2030, these inputs are operationalized through calculated drivers such as gravity model parameters, tariff impact factors, and projected GDP per-capita growth. Through an analysis of hidden potentials, demand hotspots, and market conditions that are most favorable to success, this method enables firms to focus on target countries, maximize returns, and global expansion with data, backed by accuracy.
By factoring in the projected importer demand gap that is currently unmet and could be potential opportunity, it identifies the potential for the Exporter (Country) among 190 countries, against the general trade analysis, which identifies the biggest importer or exporter.
To discover high-growth global markets and optimize your business strategy:
Click Here
Pricing
- Single User License$ 1,995
- Department License$ 2,400
- Site License$ 3,120
- Global License$ 3,795

Leadership Perspectives from Industry Events
Search
Thought Leadership and Analyst Meet


Our Clients
6WResearch In News
- India Air Conditioner Market Set for Strong Rebound in 2026 After Weather-Led Correction and GST-Driven Recovery: 6Wresearch
- ADAS in India: How Automatic Emergency Braking, Blind Spot Detection & Driver Monitoring are Transforming Road Safety
- Doha a strategic location for EV manufacturing hub: IPA Qatar
- Demand for luxury TVs surging in the GCC, says Samsung
- Empowering Growth: The Thriving Journey of Bangladesh’s Cable Industry
- Demand for luxury TVs surging in the GCC, says Samsung
Latest Reports
- Nicaragua RPG Gaming Market (2026-2032)
- New Zealand RPG Gaming Market (2026-2032)
- Netherlands RPG Gaming Market (2026-2032)
- Nauru RPG Gaming Market (2026-2032)
- Namibia RPG Gaming Market (2026-2032)
- Mozambique RPG Gaming Market (2026-2032)
- Montenegro RPG Gaming Market (2026-2032)
- Mongolia RPG Gaming Market (2026-2032)
- Monaco RPG Gaming Market (2026-2032)
- Micronesia RPG Gaming Market (2026-2032)
Industry Events and Analyst Meet

EV India Expo 2026

HIMTEX 2026

India Refining Summit 2026

India EV Show 2026

EV tech India Expo 2026
Whitepaper
- Middle East & Africa Commercial Security Market Click here to view more.
- Middle East & Africa Fire Safety Systems & Equipment Market Click here to view more.
- GCC Drone Market Click here to view more.
- Middle East Lighting Fixture Market Click here to view more.
- GCC Physical & Perimeter Security Market Click here to view more.