Nepal Coal Based Activated Carbon Market (2026-2032) Outlook | Size, Share, Trends, Industry, Companies, Value, Revenue, Analysis, Growth & Forecast
Market Forecast By Product (Granular, Powdered, Others), By End-Use (Water Treatment, Food & Beverage Processing, Pharmaceutical & Medical, Automotive, Air Purification, Others) And Competitive Landscape
| Product Code: ETC273936 | Publication Date: Aug 2022 | Updated Date: Jul 2026 | Product Type: Market Research Report | |
| Publisher: 6Wresearch | Author: Vasudha | No. of Pages: 75 | No. of Figures: 35 | No. of Tables: 20 |
Nepal Coal Based Activated Carbon Market Size, Share & Growth Rate
The Nepal Coal Based Activated Carbon Market was estimated at USD 443 Million in 2025 and is projected to reach USD 552 Million by 2032, growing at a CAGR of 3.2% from 2026 to 2032. This growth trajectory is fueled by the increasing demand for advanced purification solutions across various sectors, including water treatment and air filtration. Additionally, heightened awareness of environmental sustainability is prompting industries to adopt coal-based activated carbon as a cost-effective and efficient method for contaminant removal.
Nepal Coal Based Activated Carbon Market Year-wise Growth Rate and Key Drivers
This graph highlights how the Nepal Coal Based Activated Carbon Market has steadily grown over the years, supported by major growth factors.
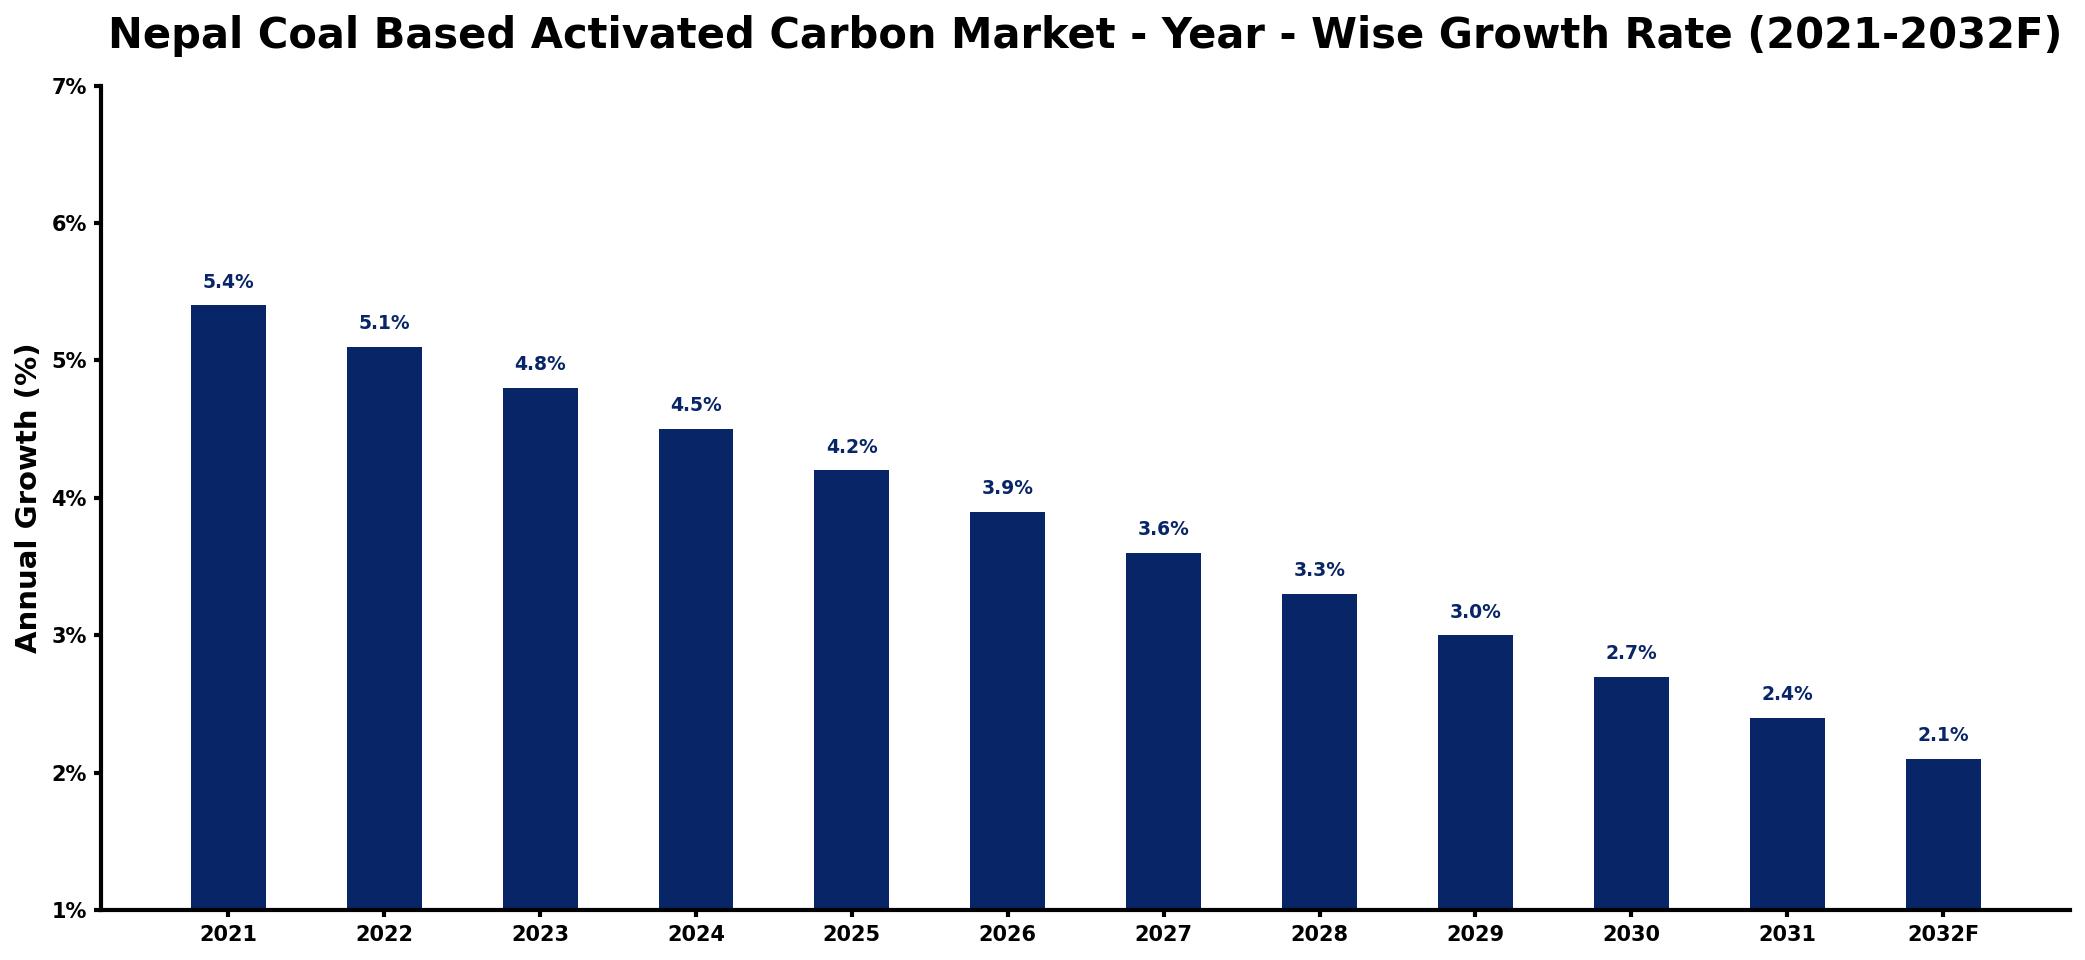
The table below presents the year‑wise growth rates along with the key drivers influencing the market
| Year | Growth Rate | Major Drivers |
| 2021 | 5.4% | Growing industrial applications demand |
| 2022 | 5.1% | Increased investments in infrastructure |
| 2023 | 4.8% | Rising environmental regulations focus |
| 2024 | 4.5% | Expanding pharmaceutical industry needs |
| 2025 | 4.2% | Boosted water treatment initiatives |
| 2026 | 3.9% | Higher energy sector requirements |
| 2027 | 3.6% | Surge in automotive industry use |
| 2028 | 3.3% | Increased consumer goods production |
| 2029 | 3.0% | Growing food processing demands |
| 2030 | 2.7% | Rising air purification needs |
| 2031 | 2.4% | Expanding electronics manufacturing sector |
| 2032 | 2.1% | Increased waste management solutions |
Note: Market size estimations and growth projections presented in this report are based on 6Wresearch's proprietary forecasting methodology, utilizing the latest available industry data, government publications, and primary research inputs.
Nepal Coal Based Activated Carbon Market Synopsis
The Nepal Coal Based Activated Carbon Market is currently navigating a period of steady expansion, driven by escalating requirements for clean air and water across multiple industries. This surge in demand reflects the nation's commitment to environmental sustainability and effective pollution control measures.
With a rich supply of local coal resources, Nepal stands at a unique advantage, making it possible to produce activated carbon sustainably. This growth is bolstered by an increasing focus on product innovation, leading to enhancements in the quality and longevity of activated carbon offerings.
Nepal Coal Based Activated Carbon Market Key Takeaways
- The market is benefiting from rising demand for purification solutions in water treatment, air quality management, and food processing.
- Investment in technology and product development is paramount for enhancing the quality and performance of activated carbon.
- Growing awareness of the environmental benefits of activated carbon is fueling its adoption across various sectors.
- Challenges such as raw material price fluctuations can impact the market dynamics and pricing strategies.
- The Nepal coal-based activated carbon sector presents lucrative opportunities for investment, especially with increased environmental regulations.
Evaluation of Restraints in Nepal Coal Based Activated Carbon Market
While the market is on an upward trajectory, several factors pose significant restraints to its full potential. Limited access to high-quality raw materials, particularly coal, could lead to inconsistent supply levels and pricing volatility. Additionally, some local manufacturers face technological challenges, including outdated production processes, which may hinder their ability to compete on a global scale. The relatively low awareness of activated carbons benefits among potential users also restricts market penetration, necessitating focused efforts on education and outreach.
Nepal Coal Based Activated Carbon Market Trends
The market is witnessing a notable shift towards sustainable production methods, aligning with global trends for eco-friendly solutions. Companies are increasingly focused on developing high-quality activated carbon products with superior adsorption capabilities and tailored solutions for specific industry needs. Furthermore, technological advancements continue to play a pivotal role in enhancing the efficiency and cost-effectiveness of production processes, thereby driving market demand.
Nepal Coal Based Activated Carbon Market Opportunities
Opportunities abound in the Nepal Coal Based Activated Carbon Market, particularly in the wake of escalating environmental regulations aimed at improving air and water quality. The country's abundant coal reserves provide a viable foundation for sustainable production, making investments in this sector particularly appealing. Moreover, there is significant potential for expansion into neighboring markets, which can further amplify growth and profitability for local manufacturers.
Government Initiatives in the Nepal Coal Based Activated Carbon Market
The Nepalese government has initiated several policies to regulate and promote the coal-based activated carbon industry. These policies emphasize the importance of sustainable practices and adherence to international quality standards. The government supports initiatives that encourage research and development, aiming to enhance innovation and technological advancements in the sector. There is also a focused effort on monitoring emissions and managing waste to mitigate environmental impacts associated with production processes.
Future Insights of the Nepal Coal Based Activated Carbon Market
Looking ahead to 2026-2032, the Nepal Coal Based Activated Carbon Market is expected to maintain its growth momentum, underpinned by rising environmental awareness and stringent regulations for effective filtration systems. As companies adopt more efficient production methods, the sector is likely to see enhanced competitiveness on both domestic and international fronts. This period may also witness increased collaboration across industries to develop customized solutions that cater to specific purification needs, further boosting market dynamics.
Nepal Coal Based Activated Carbon Market Latest Developments (2025 - 2026)
Recent trends indicate a strong focus on sustainability within the industry, with manufacturers exploring innovative production techniques to minimize waste and emissions. Additionally, collaborations between industry stakeholders and research institutions have been on the rise, aiming to foster technological advancements in activated carbon applications. As regulatory frameworks become more stringent, local producers are adapting their strategies to ensure compliance and enhance product quality.
Nepal Coal Based Activated Carbon Market - Key Attractiveness of the Report
- 10 Years of Market Numbers
- Historical Data Starting from 2022 to 2025
- Base Year: 2025
- Forecast Data until 2032
- Key Performance Indicators Impacting the Market
- Major Upcoming Developments and Projects
Key Highlights of the Report:
- Nepal Coal Based Activated Carbon Market Outlook
- Market Size of Nepal Coal Based Activated Carbon Market, 2025
- Forecast of Nepal Coal Based Activated Carbon Market, 2032
- Historical Data and Forecast of Nepal Coal Based Activated Carbon Revenues & Volume for the Period 2022-2032F
- Nepal Coal Based Activated Carbon Market Trend Evolution
- Nepal Coal Based Activated Carbon Market Drivers and Challenges
- Nepal Coal Based Activated Carbon Price Trends
- Nepal Coal Based Activated Carbon Porter's Five Forces
- Nepal Coal Based Activated Carbon Industry Life Cycle
- Historical Data and Forecast of Nepal Coal Based Activated Carbon Market Revenues & Volume By Product for the Period 2022-2032F
- Historical Data and Forecast of Nepal Coal Based Activated Carbon Market Revenues & Volume By Granular for the Period 2022-2032F
- Historical Data and Forecast of Nepal Coal Based Activated Carbon Market Revenues & Volume By Powdered for the Period 2022-2032F
- Historical Data and Forecast of Nepal Coal Based Activated Carbon Market Revenues & Volume By Others for the Period 2022-2032F
- Historical Data and Forecast of Nepal Coal Based Activated Carbon Market Revenues & Volume By End-Use for the Period 2022-2032F
- Historical Data and Forecast of Nepal Coal Based Activated Carbon Market Revenues & Volume By Water Treatment for the Period 2022-2032F
- Historical Data and Forecast of Nepal Coal Based Activated Carbon Market Revenues & Volume By Food & Beverage Processing for the Period 2022-2032F
- Historical Data and Forecast of Nepal Coal Based Activated Carbon Market Revenues & Volume By Pharmaceutical & Medical for the Period 2022-2032F
- Historical Data and Forecast of Nepal Coal Based Activated Carbon Market Revenues & Volume By Automotive for the Period 2022-2032F
- Historical Data and Forecast of Nepal Coal Based Activated Carbon Market Revenues & Volume By Air Purification for the Period 2022-2032F
- Historical Data and Forecast of Nepal Coal Based Activated Carbon Market Revenues & Volume By Others for the Period 2022-2032F
- Nepal Coal Based Activated Carbon Import Export Trade Statistics
- Market Opportunity Assessment By Product
- Market Opportunity Assessment By End-Use
- Nepal Coal Based Activated Carbon Top Companies Market Share
- Nepal Coal Based Activated Carbon Competitive Benchmarking By Technical and Operational Parameters
- Nepal Coal Based Activated Carbon Company Profiles
- Nepal Coal Based Activated Carbon Key Strategic Recommendations
Frequently Asked Questions About the Market Study (FAQs):
Key drivers include rising demand for effective filtration solutions across industries and a growing commitment to environmental sustainability.
The market is estimated at USD 443 Million in 2025, with expectations to reach USD 552 Million by 2032, growing at a CAGR of 3.2% from 2026 to 2032.
Companies are increasingly focusing on sustainable production methods and innovation to comply with stricter regulations aimed at reducing pollution.
Technological advancements are critical in enhancing production efficiency and product quality, enabling companies to meet both local and international standards.
Challenges include fluctuating raw material prices and the need for technological upgrades to maintain competitiveness in a growing market.
6Wresearch actively monitors the Nepal Coal Based Activated Carbon Market and publishes its comprehensive annual report, highlighting emerging trends, growth drivers, revenue analysis, and forecast outlook. Our insights help businesses to make data-backed strategic decisions with ongoing market dynamics. Our analysts track relevent industries related to the Nepal Coal Based Activated Carbon Market, allowing our clients with actionable intelligence and reliable forecasts tailored to emerging regional needs.
Yes, we provide customisation as per your requirements. To learn more, feel free to contact us on sales@6wresearch.com
1 Executive Summary |
2 Introduction |
2.1 Key Highlights of the Report |
2.2 Report Description |
2.3 Market Scope & Segmentation |
2.4 Research Methodology |
2.5 Assumptions |
3 Nepal Coal Based Activated Carbon Market Overview |
3.1 Nepal Country Macro Economic Indicators |
3.2 Nepal Coal Based Activated Carbon Market Revenues & Volume, 2022 & 2032F |
3.3 Nepal Coal Based Activated Carbon Market - Industry Life Cycle |
3.4 Nepal Coal Based Activated Carbon Market - Porter's Five Forces |
3.5 Nepal Coal Based Activated Carbon Market Revenues & Volume Share, By Product, 2022 & 2032F |
3.6 Nepal Coal Based Activated Carbon Market Revenues & Volume Share, By End-Use, 2022 & 2032F |
4 Nepal Coal Based Activated Carbon Market Dynamics |
4.1 Impact Analysis |
4.2 Market Drivers |
4.2.1 Growing awareness about environmental pollution and the need for water and air purification solutions. |
4.2.2 Increasing industrial activities leading to higher demand for activated carbon in various applications. |
4.2.3 Rising focus on sustainable and eco-friendly products driving the adoption of coal-based activated carbon. |
4.3 Market Restraints |
4.3.1 Fluctuating prices of raw materials impacting the production cost of coal-based activated carbon. |
4.3.2 Stringent environmental regulations affecting the production and usage of coal-based activated carbon. |
4.3.3 Competition from alternative purification technologies such as bio-based activated carbon or other filtration methods. |
5 Nepal Coal Based Activated Carbon Market Trends |
6 Nepal Coal Based Activated Carbon Market, By Types |
6.1 Nepal Coal Based Activated Carbon Market, By Product |
6.1.1 Overview and Analysis |
6.1.2 Nepal Coal Based Activated Carbon Market Revenues & Volume, By Product, 2022-2032F |
6.1.3 Nepal Coal Based Activated Carbon Market Revenues & Volume, By Granular, 2022-2032F |
6.1.4 Nepal Coal Based Activated Carbon Market Revenues & Volume, By Powdered, 2022-2032F |
6.1.5 Nepal Coal Based Activated Carbon Market Revenues & Volume, By Others, 2022-2032F |
6.2 Nepal Coal Based Activated Carbon Market, By End-Use |
6.2.1 Overview and Analysis |
6.2.2 Nepal Coal Based Activated Carbon Market Revenues & Volume, By Water Treatment, 2022-2032F |
6.2.3 Nepal Coal Based Activated Carbon Market Revenues & Volume, By Food & Beverage Processing, 2022-2032F |
6.2.4 Nepal Coal Based Activated Carbon Market Revenues & Volume, By Pharmaceutical & Medical, 2022-2032F |
6.2.5 Nepal Coal Based Activated Carbon Market Revenues & Volume, By Automotive, 2022-2032F |
6.2.6 Nepal Coal Based Activated Carbon Market Revenues & Volume, By Air Purification, 2022-2032F |
6.2.7 Nepal Coal Based Activated Carbon Market Revenues & Volume, By Others, 2022-2032F |
7 Nepal Coal Based Activated Carbon Market Import-Export Trade Statistics |
7.1 Nepal Coal Based Activated Carbon Market Export to Major Countries |
7.2 Nepal Coal Based Activated Carbon Market Imports from Major Countries |
8 Nepal Coal Based Activated Carbon Market Key Performance Indicators |
8.1 Percentage of market growth in the water purification sector. |
8.2 Number of industrial partnerships for coal-based activated carbon applications. |
8.3 Rate of adoption of coal-based activated carbon in different industries. |
9 Nepal Coal Based Activated Carbon Market - Opportunity Assessment |
9.1 Nepal Coal Based Activated Carbon Market Opportunity Assessment, By Product, 2022 & 2032F |
9.2 Nepal Coal Based Activated Carbon Market Opportunity Assessment, By End-Use, 2022 & 2032F |
10 Nepal Coal Based Activated Carbon Market - Competitive Landscape |
10.1 Nepal Coal Based Activated Carbon Market Revenue Share, By Companies, 2025 |
10.2 Nepal Coal Based Activated Carbon Market Competitive Benchmarking, By Operating and Technical Parameters |
11 Company Profiles |
12 Recommendations |
13 Disclaimer |
Global Go To Market Strategy - 2030
Export potential enables firms to identify high-growth global markets with greater confidence by combining advanced trade intelligence with a structured quantitative methodology. The framework analyzes emerging demand trends and country-level import patterns while integrating macroeconomic and trade datasets such as GDP and population forecasts, bilateral import–export flows, tariff structures, elasticity differentials between developed and developing economies, geographic distance, and import demand projections. Using weighted trade values from 2020–2024 as the base period to project country-to-country export potential for 2030, these inputs are operationalized through calculated drivers such as gravity model parameters, tariff impact factors, and projected GDP per-capita growth. Through an analysis of hidden potentials, demand hotspots, and market conditions that are most favorable to success, this method enables firms to focus on target countries, maximize returns, and global expansion with data, backed by accuracy.
By factoring in the projected importer demand gap that is currently unmet and could be potential opportunity, it identifies the potential for the Exporter (Country) among 190 countries, against the general trade analysis, which identifies the biggest importer or exporter.
To discover high-growth global markets and optimize your business strategy:
Click Here
Pricing
- Single User License$ 1,995
- Department License$ 2,400
- Site License$ 3,120
- Global License$ 3,795

Leadership Perspectives from Industry Events
Search
Thought Leadership and Analyst Meet


Our Clients
6WResearch In News
- India Air Conditioner Market Set for Strong Rebound in 2026 After Weather-Led Correction and GST-Driven Recovery: 6Wresearch
- ADAS in India: How Automatic Emergency Braking, Blind Spot Detection & Driver Monitoring are Transforming Road Safety
- Doha a strategic location for EV manufacturing hub: IPA Qatar
- Demand for luxury TVs surging in the GCC, says Samsung
- Empowering Growth: The Thriving Journey of Bangladesh’s Cable Industry
- Demand for luxury TVs surging in the GCC, says Samsung
Latest Reports
- Nicaragua RPG Gaming Market (2026-2032)
- New Zealand RPG Gaming Market (2026-2032)
- Netherlands RPG Gaming Market (2026-2032)
- Nauru RPG Gaming Market (2026-2032)
- Namibia RPG Gaming Market (2026-2032)
- Mozambique RPG Gaming Market (2026-2032)
- Montenegro RPG Gaming Market (2026-2032)
- Mongolia RPG Gaming Market (2026-2032)
- Monaco RPG Gaming Market (2026-2032)
- Micronesia RPG Gaming Market (2026-2032)
Industry Events and Analyst Meet

EV India Expo 2026

HIMTEX 2026

India Refining Summit 2026

India EV Show 2026

EV tech India Expo 2026
Whitepaper
- Middle East & Africa Commercial Security Market Click here to view more.
- Middle East & Africa Fire Safety Systems & Equipment Market Click here to view more.
- GCC Drone Market Click here to view more.
- Middle East Lighting Fixture Market Click here to view more.
- GCC Physical & Perimeter Security Market Click here to view more.