Nepal Inorganic Pigments Market (2026-2032) Outlook | Revenue, Value, Industry, Forecast, Share, Companies, Size, Analysis, Trends & Growth
Market Forecast By Type (Titanium Dioxide, Iron Oxide, Cadmium, Carbon Blank, Lead Chromate, Chromium Oxide, Others), By Colour (Red, Yellow, Orange, Green, Blue, Black, White, Others), By Chemistry (Oxide, Silicate, Carbonate, Sulphate, Sulphide, Others), By Grade (Food Grade, Pharmaceutical Grade, Industrial Grade, Others), By Form (Powder, Liquid), By Application (Plastics, Paints & Coatings, Printing Inks, Glass & Ceramics, Cosmetics, Paper Industry, Food Industry, Others) And Competitive Landscape
| Product Code: ETC190548 | Publication Date: May 2022 | Updated Date: Jun 2026 | Product Type: Market Research Report | |
| Publisher: 6Wresearch | Author: Summon Dutta | No. of Pages: 60 | No. of Figures: 40 | No. of Tables: 7 |
Nepal Inorganic Pigments Market Size, Share & Growth Rate
The Nepal Inorganic Pigments Market was estimated at USD 268 Million in 2025 and is projected to reach USD 357 Million by 2032, growing at a CAGR of 4.2% from 2026 to 2032. This growth trajectory is primarily driven by the burgeoning construction sector, fueled by government initiatives and rising urbanization. Additionally, the increasing preference for durable and chemically stable pigments in applications such as paints and textiles further underpins market expansion.
Nepal Inorganic Pigments Market Year-wise Growth Rate and Key Drivers
This graph highlights how the Nepal Inorganic Pigments Market has steadily grown over the years, supported by major growth factors.
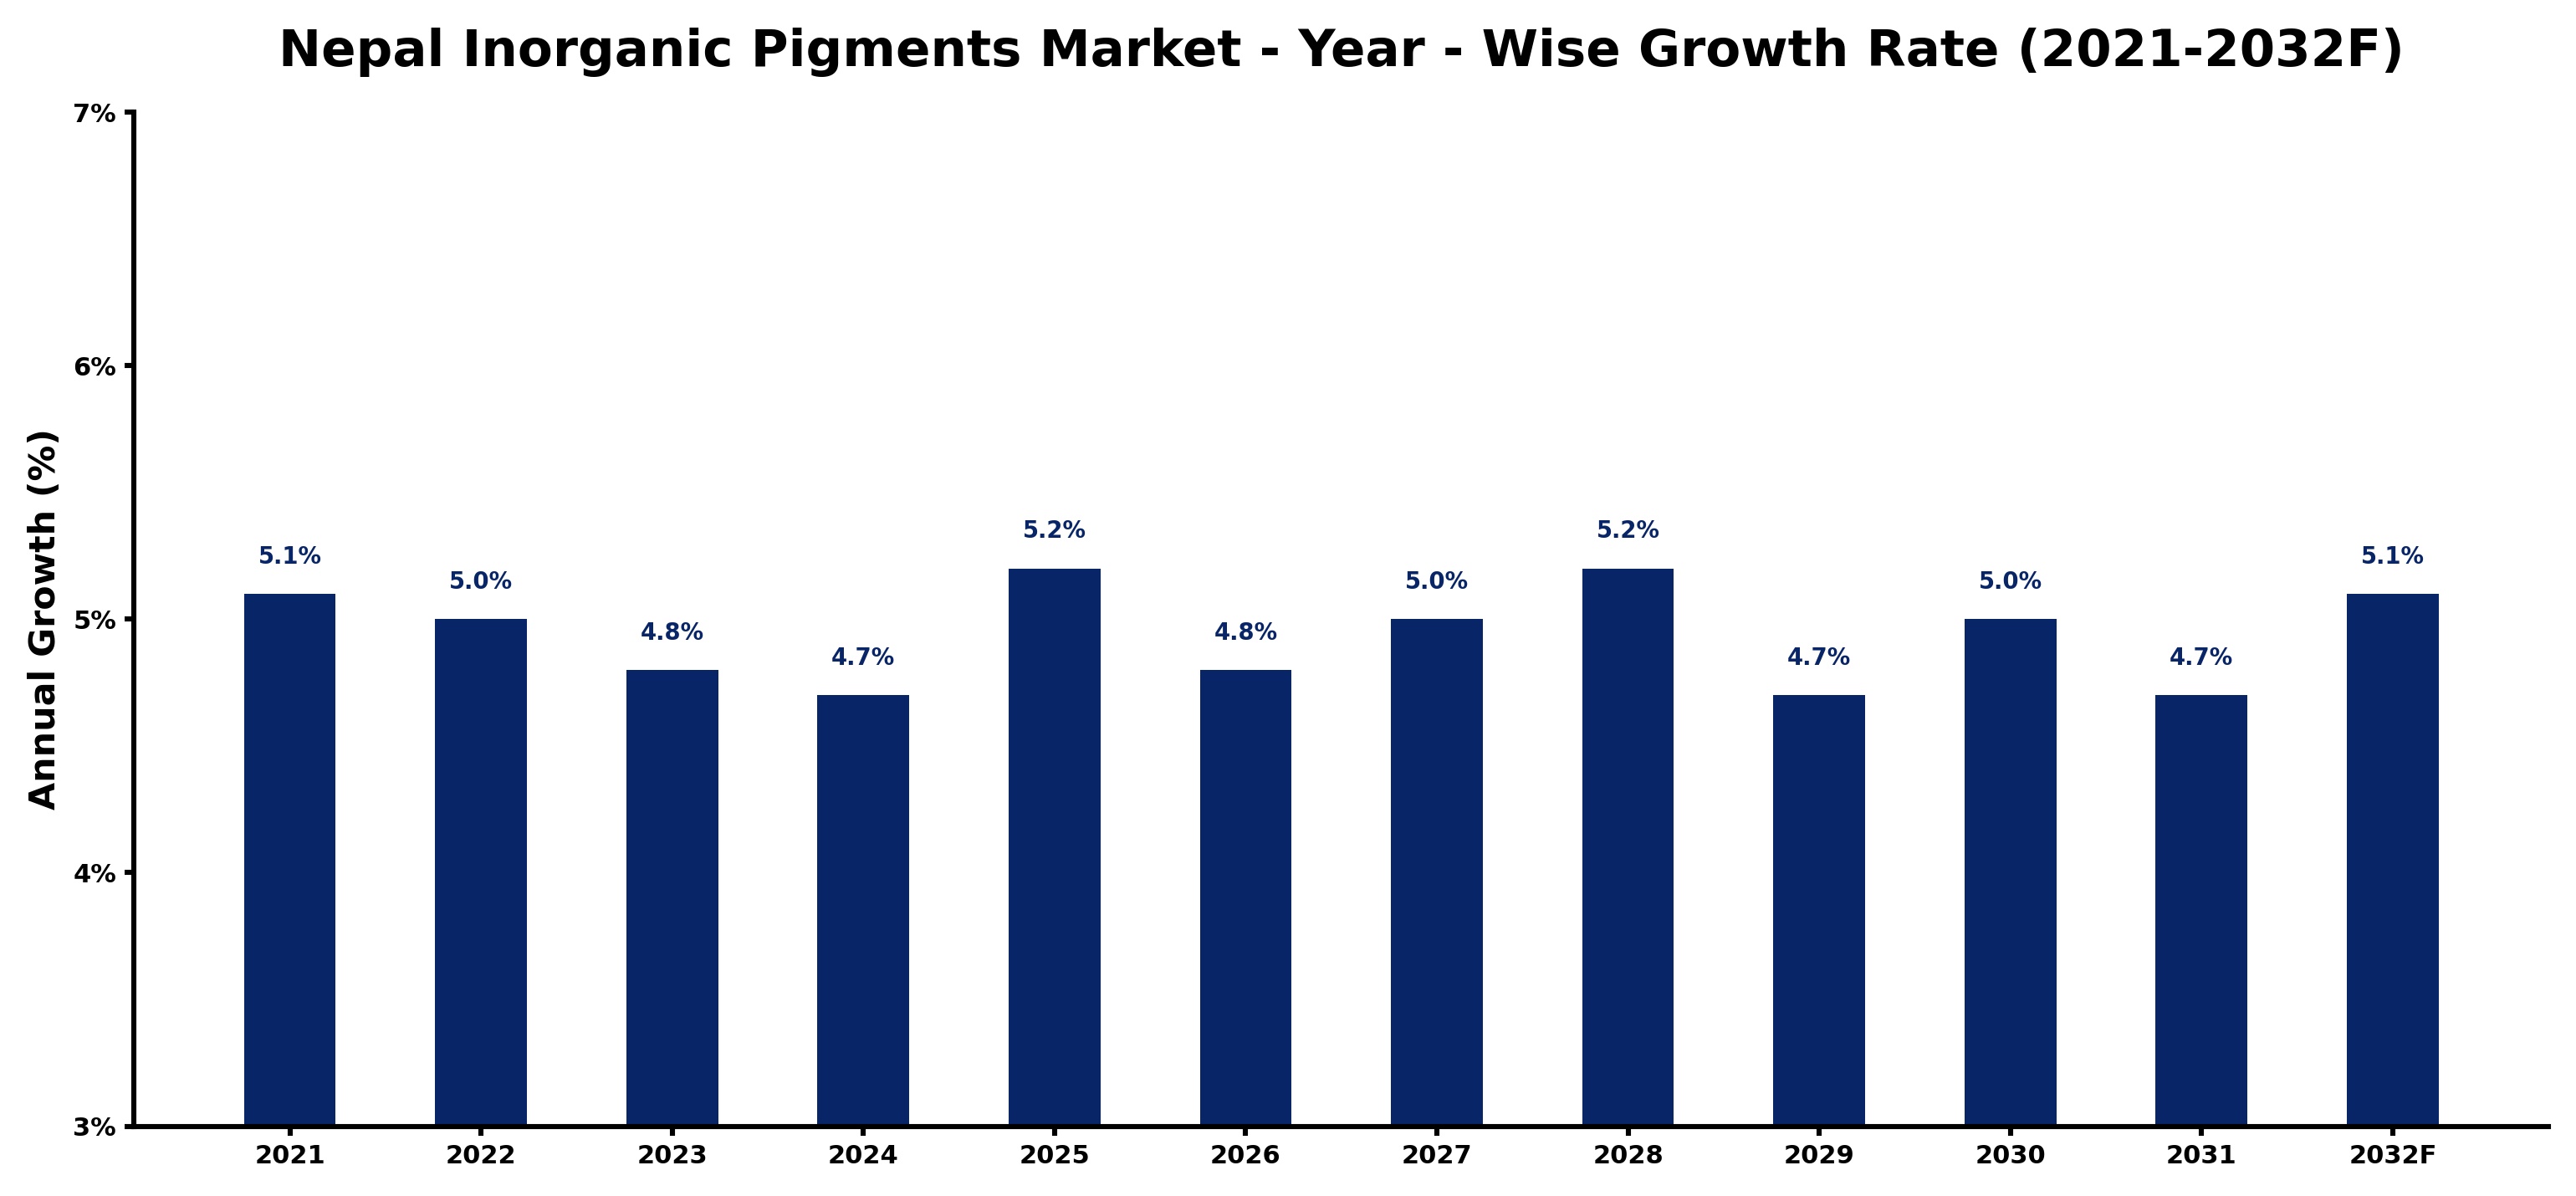
The table below presents the year‑wise growth rates along with the key drivers influencing the market
| Year | Growth Rate | Major Drivers |
| 2021 | 5.1% | Construction sector demand increased |
| 2022 | 5.0% | Automotive industry growth accelerated |
| 2023 | 4.8% | Paint and coatings market expanded |
| 2024 | 4.7% | Textile industry innovation advanced |
| 2025 | 5.2% | Consumer electronics production surged |
| 2026 | 4.8% | Agricultural applications gained traction |
| 2027 | 5.0% | Infrastructure projects boosted demand |
| 2028 | 5.2% | Sustainable products gained popularity |
| 2029 | 4.7% | Export opportunities enhanced growth |
| 2030 | 5.0% | Technological advancements improved efficiency |
| 2031 | 4.7% | Art and craft market flourished |
| 2032 | 5.1% | Regulatory support fostered development |
Note - Market size estimations and growth projections presented in this report are based on 6Wresearch’s advanced forecasting approach, validated with industry datasets as of June 2026.
Nepal Inorganic Pigments Market Synopsis
The Nepal Inorganic Pigments Market is currently experiencing a pivotal phase marked by robust demand from key sectors including construction, automotive, and textiles. The emphasis on quality and sustainability in product offerings is reshaping the landscape, creating opportunities for suppliers that can adapt quickly to market demands.
The shift towards eco-friendly pigments is becoming increasingly pronounced, aligning with global trends in environmental sustainability. This is not only affecting consumer preferences but also prompting manufacturers to innovate in their product lines, thereby enhancing competitive positioning within the market.
Nepal Inorganic Pigments Market Key Takeaways
- The market is driven by increasing demand from construction and infrastructure development projects.
- There is a notable shift toward sustainable and eco-friendly inorganic pigments among consumers.
- Technological advancements are leading to innovative and high-performance products.
- Investment opportunities exist in local production tailored to market needs and preferences.
- Government policies are focused on regulating quality and promoting sustainable practices.
Evaluation of Restraints in Nepal Inorganic Pigments Market
Despite its promising outlook, the Nepal Inorganic Pigments Market faces significant challenges that could hinder its growth. One major issue is the limited availability of high-quality raw materials, particularly titanium dioxide and iron oxide, which are essential for producing a range of pigments. Fluctuating prices for these key ingredients further complicate cost management for producers. Moreover, inconsistent quality standards can create uncertainty about product performance, which in turn may discourage end-users from fully embracing inorganic options. The prevalence of counterfeit products adds another layer of difficulty, threatening consumer safety and damaging the credibility of legitimate suppliers.
Nepal Inorganic Pigments Market Trends
Currently, the market is witnessing a surge in demand for eco-friendly inorganic pigments, particularly those sourced from natural minerals. This trend reflects a broader consumer shift toward sustainability, driving manufacturers to explore innovative formulations with enhanced properties such as heat resistance and weatherability. The rise of high-performance pigments in sectors like automotive and industrial applications further illustrates the evolving landscape, as companies seek to differentiate themselves through advanced product offerings.
Nepal Inorganic Pigments Market Opportunities
The Nepal Inorganic Pigments Market is ripe with investment opportunities, particularly in light of the country's expansive infrastructure projects. Investors are encouraged to consider local production facilities that can efficiently cater to domestic demands while also exploring potential export avenues. Furthermore, the increasing consumer inclination toward sustainable and eco-friendly products offers a lucrative niche for companies that prioritize innovation and environmental stewardship. Collaborative ventures with local manufacturers could amplify market presence and responsiveness to emerging trends.
Government Initiatives in the Nepal Inorganic Pigments Market
Government policies in Nepal are increasingly focused on regulating the import and export of inorganic pigments to maintain quality and sustainability standards. The Department of Customs plays a pivotal role in overseeing import processes, imposing tariffs that aim to protect domestic manufacturers while fostering healthy competition. Additionally, the Ministry of Industry, Commerce, and Supplies works to enforce regulations regarding manufacturing and labeling, ensuring consumer safety and environmental compliance across the industry.
Future Insights of the Nepal Inorganic Pigments Market
Looking ahead to the period from 2026 to 2032, the Nepal Inorganic Pigments Market is set to continue its steady growth. The anticipated expansion in construction projects, particularly infrastructure development, will play a crucial role in driving demand. Furthermore, rising disposable incomes will likely result in consumers favoring aesthetically appealing products across various applications, including paints and textiles. With ongoing technological advancements and a commitment to sustainable practices, the market is well-positioned to capitalize on these favorable trends.
Nepal Inorganic Pigments Market Latest Developments (May 2025 - June 2026)
Recent industry movements indicate a significant focus on innovation in pigment formulations, with several manufacturers investing in R&D to enhance product performance. Additionally, there has been a notable increase in collaboration between companies and regulatory bodies to address quality assurance challenges, including the fight against counterfeit products. As consumer demand for sustainable options rises, companies are re-evaluating their supply chains to ensure they meet both market expectations and environmental standards.
Nepal Inorganic Pigments Market - Key Attractiveness of the Report
- 10 Years of Market Numbers
- Historical Data Starting from 2022 to 2025
- Base Year: 2025
- Forecast Data until 2032
- Key Performance Indicators Impacting the Market
- Major Upcoming Developments and Projects
Key Highlights of the Report:
- Nepal Inorganic Pigments Market Outlook
- Market Size of Nepal Inorganic Pigments Market, 2025
- Forecast of Nepal Inorganic Pigments Market, 2032
- Historical Data and Forecast of Nepal Inorganic Pigments Revenues & Volume for the Period 2022-2032F
- Nepal Inorganic Pigments Market Trend Evolution
- Nepal Inorganic Pigments Market Drivers and Challenges
- Nepal Inorganic Pigments Price Trends
- Nepal Inorganic Pigments Porter's Five Forces
- Nepal Inorganic Pigments Industry Life Cycle
- Historical Data and Forecast of Nepal Inorganic Pigments Market Revenues & Volume By Type for the Period 2022-2032F
- Historical Data and Forecast of Nepal Inorganic Pigments Market Revenues & Volume By Titanium Dioxide for the Period 2022-2032F
- Historical Data and Forecast of Nepal Inorganic Pigments Market Revenues & Volume By Iron Oxide, Cadmium for the Period 2022-2032F
- Historical Data and Forecast of Nepal Inorganic Pigments Market Revenues & Volume By Carbon Blank for the Period 2022-2032F
- Historical Data and Forecast of Nepal Inorganic Pigments Market Revenues & Volume By Lead Chromate for the Period 2022-2032F
- Historical Data and Forecast of Nepal Inorganic Pigments Market Revenues & Volume By Chromium Oxide for the Period 2022-2032F
- Historical Data and Forecast of Nepal Inorganic Pigments Market Revenues & Volume By Others for the Period 2022-2032F
- Historical Data and Forecast of Nepal Inorganic Pigments Market Revenues & Volume By Colour for the Period 2022-2032F
- Historical Data and Forecast of Nepal Inorganic Pigments Market Revenues & Volume By Red for the Period 2022-2032F
- Historical Data and Forecast of Nepal Inorganic Pigments Market Revenues & Volume By Yellow for the Period 2022-2032F
- Historical Data and Forecast of Nepal Inorganic Pigments Market Revenues & Volume By Orange for the Period 2022-2032F
- Historical Data and Forecast of Nepal Inorganic Pigments Market Revenues & Volume By Green for the Period 2022-2032F
- Historical Data and Forecast of Nepal Inorganic Pigments Market Revenues & Volume By Blue for the Period 2022-2032F
- Historical Data and Forecast of Nepal Inorganic Pigments Market Revenues & Volume By Black for the Period 2022-2032F
- Historical Data and Forecast of Nepal Inorganic Pigments Market Revenues & Volume By White for the Period 2022-2032F
- Historical Data and Forecast of Nepal Inorganic Pigments Market Revenues & Volume By Others for the Period 2022-2032F
- Historical Data and Forecast of Nepal Inorganic Pigments Market Revenues & Volume By Chemistry for the Period 2022-2032F
- Historical Data and Forecast of Nepal Inorganic Pigments Market Revenues & Volume By Oxide for the Period 2022-2032F
- Historical Data and Forecast of Nepal Inorganic Pigments Market Revenues & Volume By Silicate for the Period 2022-2032F
- Historical Data and Forecast of Nepal Inorganic Pigments Market Revenues & Volume By Carbonate for the Period 2022-2032F
- Historical Data and Forecast of Nepal Inorganic Pigments Market Revenues & Volume By Sulphate for the Period 2022-2032F
- Historical Data and Forecast of Nepal Inorganic Pigments Market Revenues & Volume By Sulphide for the Period 2022-2032F
- Historical Data and Forecast of Nepal Inorganic Pigments Market Revenues & Volume By Others for the Period 2022-2032F
- Historical Data and Forecast of Nepal Inorganic Pigments Market Revenues & Volume By Grade for the Period 2022-2032F
- Historical Data and Forecast of Nepal Inorganic Pigments Market Revenues & Volume By Food Grade for the Period 2022-2032F
- Historical Data and Forecast of Nepal Inorganic Pigments Market Revenues & Volume By Pharmaceutical Grade for the Period 2022-2032F
- Historical Data and Forecast of Nepal Inorganic Pigments Market Revenues & Volume By Industrial Grade for the Period 2022-2032F
- Historical Data and Forecast of Nepal Inorganic Pigments Market Revenues & Volume By Others for the Period 2022-2032F
- Historical Data and Forecast of Nepal Inorganic Pigments Market Revenues & Volume By Form for the Period 2022-2032F
- Historical Data and Forecast of Nepal Inorganic Pigments Market Revenues & Volume By Powder for the Period 2022-2032F
- Historical Data and Forecast of Nepal Inorganic Pigments Market Revenues & Volume By Liquid for the Period 2022-2032F
- Historical Data and Forecast of Nepal Inorganic Pigments Market Revenues & Volume By Application for the Period 2022-2032F
- Historical Data and Forecast of Nepal Inorganic Pigments Market Revenues & Volume By Plastics for the Period 2022-2032F
- Historical Data and Forecast of Nepal Inorganic Pigments Market Revenues & Volume By Paints & Coatings for the Period 2022-2032F
- Historical Data and Forecast of Nepal Inorganic Pigments Market Revenues & Volume By Printing Inks for the Period 2022-2032F
- Historical Data and Forecast of Nepal Inorganic Pigments Market Revenues & Volume By Glass & Ceramics for the Period 2022-2032F
- Historical Data and Forecast of Nepal Inorganic Pigments Market Revenues & Volume By Cosmetics for the Period 2022-2032F
- Historical Data and Forecast of Nepal Inorganic Pigments Market Revenues & Volume By Paper Industry for the Period 2022-2032F
- Historical Data and Forecast of Nepal Inorganic Pigments Market Revenues & Volume By Food Industry for the Period 2022-2032F
- Historical Data and Forecast of Nepal Inorganic Pigments Market Revenues & Volume By Others for the Period 2022-2032F
- Nepal Inorganic Pigments Import Export Trade Statistics
- Market Opportunity Assessment By Type
- Market Opportunity Assessment By Colour
- Market Opportunity Assessment By Chemistry
- Market Opportunity Assessment By Grade
- Market Opportunity Assessment By Form
- Market Opportunity Assessment By Application
- Nepal Inorganic Pigments Top Companies Market Share
- Nepal Inorganic Pigments Competitive Benchmarking By Technical and Operational Parameters
- Nepal Inorganic Pigments Company Profiles
- Nepal Inorganic Pigments Key Strategic Recommendations
Nepal Inorganic Pigments Market - Frequently Asked Questions
The Nepal Inorganic Pigments Market was estimated at USD 268 Million in 2025 and is projected to reach USD 357 Million by 2032, growing at a CAGR of 4.2% from 2026 to 2032.
Government regulations focus on maintaining quality standards and promoting sustainable practices within the inorganic pigments market, thereby impacting supply chains and consumer trust.
The construction, automotive, and textile sectors are leading the charge, with increasing urbanization and infrastructure development playing a significant role in market growth.
Emerging trends include a growing preference for eco-friendly and high-performance pigments, along with innovation in product formulations to meet evolving consumer needs.
Successful entry hinges on understanding local market dynamics, forming strategic partnerships, and focusing on sustainable product offerings that resonate with consumer preferences.
6Wresearch actively monitors the Nepal Inorganic Pigments Market and publishes its comprehensive annual report, highlighting emerging trends, growth drivers, revenue analysis, and forecast outlook. Our insights help businesses to make data-backed strategic decisions with ongoing market dynamics. Our analysts track relevent industries related to the Nepal Inorganic Pigments Market, allowing our clients with actionable intelligence and reliable forecasts tailored to emerging regional needs.
Yes, we provide customisation as per your requirements. To learn more, feel free to contact us on sales@6wresearch.com
1 Executive Summary |
2 Introduction |
2.1 Key Highlights of the Report |
2.2 Report Description |
2.3 Market Scope & Segmentation |
2.4 Research Methodology |
2.5 Assumptions |
3 Nepal Inorganic Pigments Market Overview |
3.1 Nepal Country Macro Economic Indicators |
3.2 Nepal Inorganic Pigments Market Revenues & Volume, 2022 & 2032F |
3.3 Nepal Inorganic Pigments Market - Industry Life Cycle |
3.4 Nepal Inorganic Pigments Market - Porter's Five Forces |
3.5 Nepal Inorganic Pigments Market Revenues & Volume Share, By Type, 2022 & 2032F |
3.6 Nepal Inorganic Pigments Market Revenues & Volume Share, By Colour, 2022 & 2032F |
3.7 Nepal Inorganic Pigments Market Revenues & Volume Share, By Chemistry, 2022 & 2032F |
3.8 Nepal Inorganic Pigments Market Revenues & Volume Share, By Grade, 2022 & 2032F |
3.9 Nepal Inorganic Pigments Market Revenues & Volume Share, By Form, 2022 & 2032F |
3.10 Nepal Inorganic Pigments Market Revenues & Volume Share, By Application, 2022 & 2032F |
4 Nepal Inorganic Pigments Market Dynamics |
4.1 Impact Analysis |
4.2 Market Drivers |
4.2.1 Growing demand for inorganic pigments in various industries such as construction, automotive, and packaging |
4.2.2 Increasing infrastructure development projects in Nepal driving the demand for inorganic pigments |
4.2.3 Rising investments in the manufacturing sector leading to higher consumption of inorganic pigments |
4.3 Market Restraints |
4.3.1 Fluctuating prices of raw materials impacting the production cost of inorganic pigments |
4.3.2 Stringent environmental regulations regarding the use and disposal of inorganic pigments |
4.3.3 Limited availability of skilled labor for the production and application of inorganic pigments |
5 Nepal Inorganic Pigments Market Trends |
6 Nepal Inorganic Pigments Market, By Types |
6.1 Nepal Inorganic Pigments Market, By Type |
6.1.1 Overview and Analysis |
6.1.2 Nepal Inorganic Pigments Market Revenues & Volume, By Type, 2022-2032F |
6.1.3 Nepal Inorganic Pigments Market Revenues & Volume, By Titanium Dioxide, 2022-2032F |
6.1.4 Nepal Inorganic Pigments Market Revenues & Volume, By Iron Oxide, Cadmium, 2022-2032F |
6.1.5 Nepal Inorganic Pigments Market Revenues & Volume, By Carbon Blank, 2022-2032F |
6.1.6 Nepal Inorganic Pigments Market Revenues & Volume, By Lead Chromate, 2022-2032F |
6.1.7 Nepal Inorganic Pigments Market Revenues & Volume, By Chromium Oxide, 2022-2032F |
6.1.8 Nepal Inorganic Pigments Market Revenues & Volume, By Others, 2022-2032F |
6.2 Nepal Inorganic Pigments Market, By Colour |
6.2.1 Overview and Analysis |
6.2.2 Nepal Inorganic Pigments Market Revenues & Volume, By Red, 2022-2032F |
6.2.3 Nepal Inorganic Pigments Market Revenues & Volume, By Yellow, 2022-2032F |
6.2.4 Nepal Inorganic Pigments Market Revenues & Volume, By Orange, 2022-2032F |
6.2.5 Nepal Inorganic Pigments Market Revenues & Volume, By Green, 2022-2032F |
6.2.6 Nepal Inorganic Pigments Market Revenues & Volume, By Blue, 2022-2032F |
6.2.7 Nepal Inorganic Pigments Market Revenues & Volume, By Black, 2022-2032F |
6.2.8 Nepal Inorganic Pigments Market Revenues & Volume, By Others, 2022-2032F |
6.2.9 Nepal Inorganic Pigments Market Revenues & Volume, By Others, 2022-2032F |
6.3 Nepal Inorganic Pigments Market, By Chemistry |
6.3.1 Overview and Analysis |
6.3.2 Nepal Inorganic Pigments Market Revenues & Volume, By Oxide, 2022-2032F |
6.3.3 Nepal Inorganic Pigments Market Revenues & Volume, By Silicate, 2022-2032F |
6.3.4 Nepal Inorganic Pigments Market Revenues & Volume, By Carbonate, 2022-2032F |
6.3.5 Nepal Inorganic Pigments Market Revenues & Volume, By Sulphate, 2022-2032F |
6.3.6 Nepal Inorganic Pigments Market Revenues & Volume, By Sulphide, 2022-2032F |
6.3.7 Nepal Inorganic Pigments Market Revenues & Volume, By Others, 2022-2032F |
6.4 Nepal Inorganic Pigments Market, By Grade |
6.4.1 Overview and Analysis |
6.4.2 Nepal Inorganic Pigments Market Revenues & Volume, By Food Grade, 2022-2032F |
6.4.3 Nepal Inorganic Pigments Market Revenues & Volume, By Pharmaceutical Grade, 2022-2032F |
6.4.4 Nepal Inorganic Pigments Market Revenues & Volume, By Industrial Grade, 2022-2032F |
6.4.5 Nepal Inorganic Pigments Market Revenues & Volume, By Others, 2022-2032F |
6.5 Nepal Inorganic Pigments Market, By Form |
6.5.1 Overview and Analysis |
6.5.2 Nepal Inorganic Pigments Market Revenues & Volume, By Powder, 2022-2032F |
6.5.3 Nepal Inorganic Pigments Market Revenues & Volume, By Liquid, 2022-2032F |
6.6 Nepal Inorganic Pigments Market, By Application |
6.6.1 Overview and Analysis |
6.6.2 Nepal Inorganic Pigments Market Revenues & Volume, By Plastics, 2022-2032F |
6.6.3 Nepal Inorganic Pigments Market Revenues & Volume, By Paints & Coatings, 2022-2032F |
6.6.4 Nepal Inorganic Pigments Market Revenues & Volume, By Printing Inks, 2022-2032F |
6.6.5 Nepal Inorganic Pigments Market Revenues & Volume, By Glass & Ceramics, 2022-2032F |
6.6.6 Nepal Inorganic Pigments Market Revenues & Volume, By Cosmetics, 2022-2032F |
6.6.7 Nepal Inorganic Pigments Market Revenues & Volume, By Paper Industry, 2022-2032F |
6.6.8 Nepal Inorganic Pigments Market Revenues & Volume, By Others, 2022-2032F |
6.6.9 Nepal Inorganic Pigments Market Revenues & Volume, By Others, 2022-2032F |
7 Nepal Inorganic Pigments Market Import-Export Trade Statistics |
7.1 Nepal Inorganic Pigments Market Export to Major Countries |
7.2 Nepal Inorganic Pigments Market Imports from Major Countries |
8 Nepal Inorganic Pigments Market Key Performance Indicators |
8.1 Number of infrastructure projects in Nepal utilizing inorganic pigments |
8.2 Adoption rate of inorganic pigments in key industries within Nepal |
8.3 Investment trends in the manufacturing sector related to inorganic pigments |
8.4 Environmental compliance metrics for inorganic pigment manufacturers |
8.5 Training and skill development initiatives for the workforce in the inorganic pigment industry |
9 Nepal Inorganic Pigments Market - Opportunity Assessment |
9.1 Nepal Inorganic Pigments Market Opportunity Assessment, By Type, 2022 & 2032F |
9.2 Nepal Inorganic Pigments Market Opportunity Assessment, By Colour, 2022 & 2032F |
9.3 Nepal Inorganic Pigments Market Opportunity Assessment, By Chemistry, 2022 & 2032F |
9.4 Nepal Inorganic Pigments Market Opportunity Assessment, By Grade, 2022 & 2032F |
9.5 Nepal Inorganic Pigments Market Opportunity Assessment, By Form, 2022 & 2032F |
9.6 Nepal Inorganic Pigments Market Opportunity Assessment, By Application, 2022 & 2032F |
10 Nepal Inorganic Pigments Market - Competitive Landscape |
10.1 Nepal Inorganic Pigments Market Revenue Share, By Companies, 2025 |
10.2 Nepal Inorganic Pigments Market Competitive Benchmarking, By Operating and Technical Parameters |
11 Company Profiles |
12 Recommendations |
13 Disclaimer |
Global Go To Market Strategy - 2030
Export potential enables firms to identify high-growth global markets with greater confidence by combining advanced trade intelligence with a structured quantitative methodology. The framework analyzes emerging demand trends and country-level import patterns while integrating macroeconomic and trade datasets such as GDP and population forecasts, bilateral import–export flows, tariff structures, elasticity differentials between developed and developing economies, geographic distance, and import demand projections. Using weighted trade values from 2020–2024 as the base period to project country-to-country export potential for 2030, these inputs are operationalized through calculated drivers such as gravity model parameters, tariff impact factors, and projected GDP per-capita growth. Through an analysis of hidden potentials, demand hotspots, and market conditions that are most favorable to success, this method enables firms to focus on target countries, maximize returns, and global expansion with data, backed by accuracy.
By factoring in the projected importer demand gap that is currently unmet and could be potential opportunity, it identifies the potential for the Exporter (Country) among 190 countries, against the general trade analysis, which identifies the biggest importer or exporter.
To discover high-growth global markets and optimize your business strategy:
Click Here
Pricing
- Single User License$ 1,995
- Department License$ 2,400
- Site License$ 3,120
- Global License$ 3,795

Leadership Perspectives from Industry Events
Search
Thought Leadership and Analyst Meet


Our Clients
6WResearch In News
- India Air Conditioner Market Set for Strong Rebound in 2026 After Weather-Led Correction and GST-Driven Recovery: 6Wresearch
- ADAS in India: How Automatic Emergency Braking, Blind Spot Detection & Driver Monitoring are Transforming Road Safety
- Doha a strategic location for EV manufacturing hub: IPA Qatar
- Demand for luxury TVs surging in the GCC, says Samsung
- Empowering Growth: The Thriving Journey of Bangladesh’s Cable Industry
- Demand for luxury TVs surging in the GCC, says Samsung
Latest Reports
- Nicaragua RPG Gaming Market (2026-2032)
- New Zealand RPG Gaming Market (2026-2032)
- Netherlands RPG Gaming Market (2026-2032)
- Nauru RPG Gaming Market (2026-2032)
- Namibia RPG Gaming Market (2026-2032)
- Mozambique RPG Gaming Market (2026-2032)
- Montenegro RPG Gaming Market (2026-2032)
- Mongolia RPG Gaming Market (2026-2032)
- Monaco RPG Gaming Market (2026-2032)
- Micronesia RPG Gaming Market (2026-2032)
Industry Events and Analyst Meet

EV India Expo 2026

HIMTEX 2026

India Refining Summit 2026

India EV Show 2026

EV tech India Expo 2026
Whitepaper
- Middle East & Africa Commercial Security Market Click here to view more.
- Middle East & Africa Fire Safety Systems & Equipment Market Click here to view more.
- GCC Drone Market Click here to view more.
- Middle East Lighting Fixture Market Click here to view more.
- GCC Physical & Perimeter Security Market Click here to view more.