Netherlands Chloroethane Market (2026-2032) | Revenue, Share, Analysis, Value, Trends, Industry, Size, Outlook, Forecast, Companies, Segmentation & Growth
Market Forecast By Application (Pesticide, Dye, Foamed Plastics, Pharmaceuticals, Other Chemicals), By Product Type (Monochloroethane, Dichloroethane) And Competitive Landscape
| Product Code: ETC5256769 | Publication Date: Nov 2023 | Updated Date: Apr 2026 | Product Type: Market Research Report | |
| Publisher: 6Wresearch | Author: Ravi Bhandari | No. of Pages: 60 | No. of Figures: 30 | No. of Tables: 5 |
Netherlands Chloroethane Market Size (2020-2030)
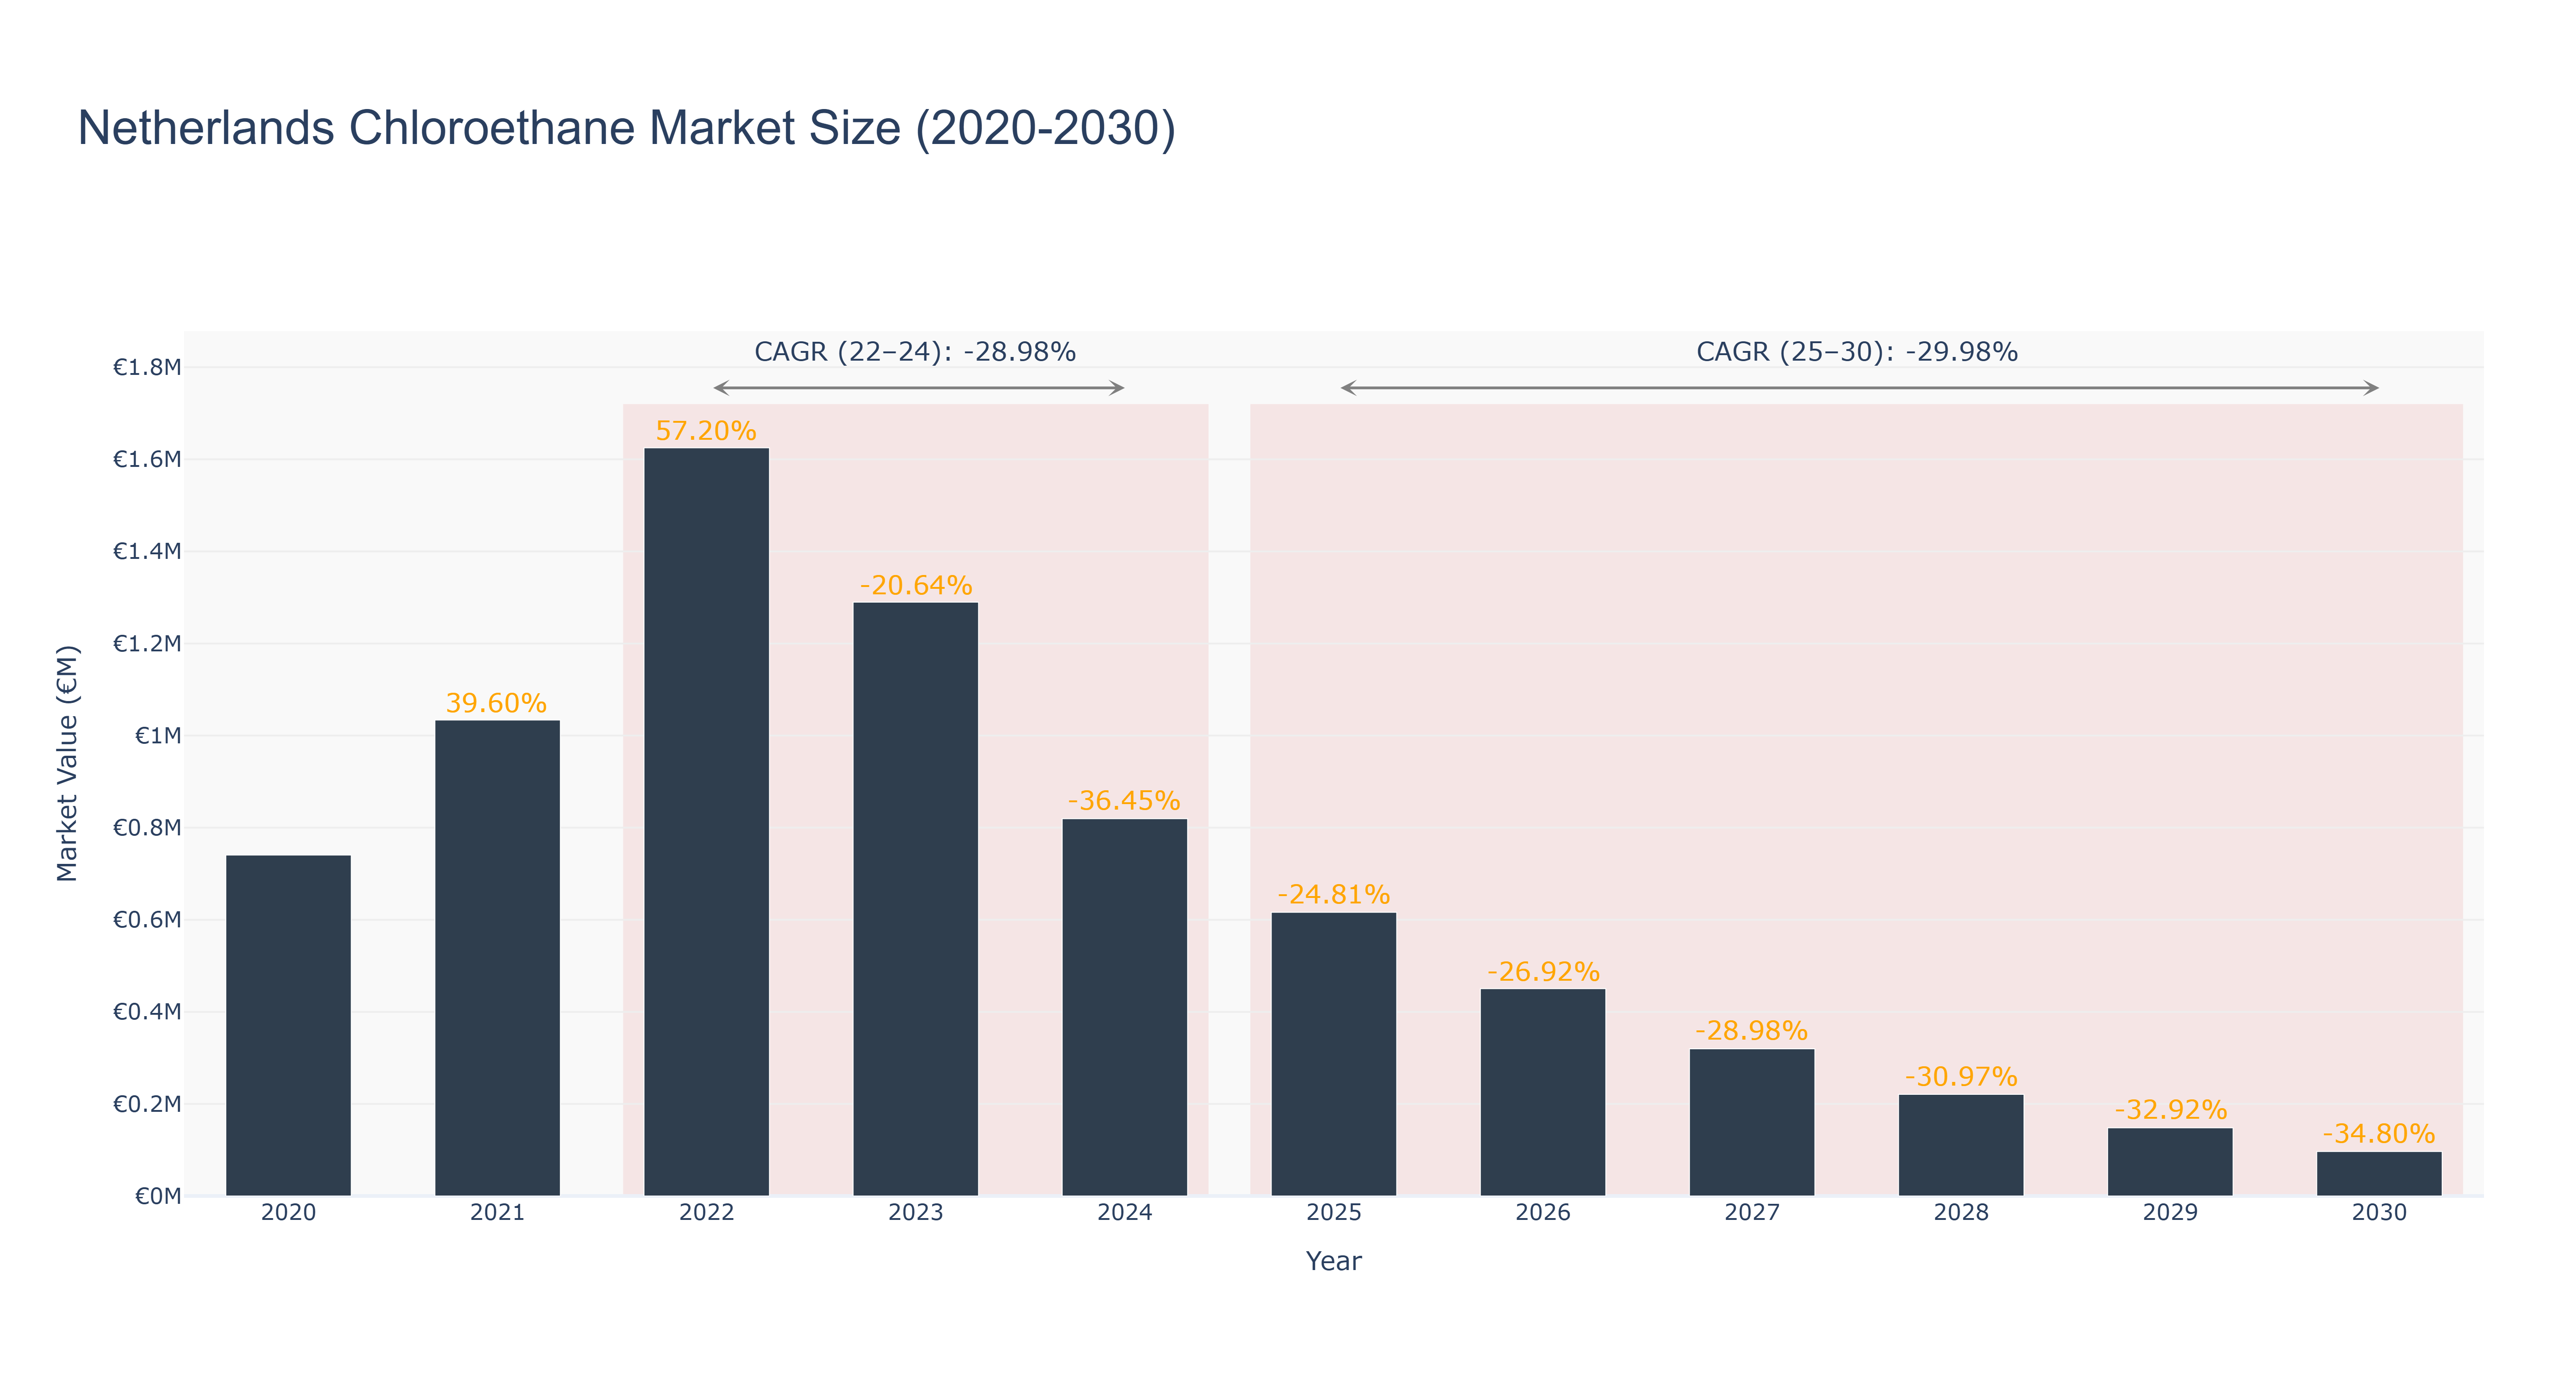
Netherlands Chloroethane Market: The market peaked at €1.63 million in 2022 before experiencing a downward trend. By 2024, the market size decreased to €0.82 million due to a negative growth rate of -36.45%. Forecasted market sizes from 2025 to 2030 continue on a declining trajectory, with a CAGR of -29.98%. The market's recent challenges can be attributed to factors such as regulatory changes impacting production and demand, as well as increased competition from alternative products. However, upcoming investments in sustainable production technologies are expected to drive future growth in the market. In the near future, a major project focusing on enhancing environmental sustainability in chloroethane production is set to launch, signaling a shift towards more eco-friendly practices within the industry.
Netherlands Chloroethane Market: Production & Trade Performance (2019-2025)
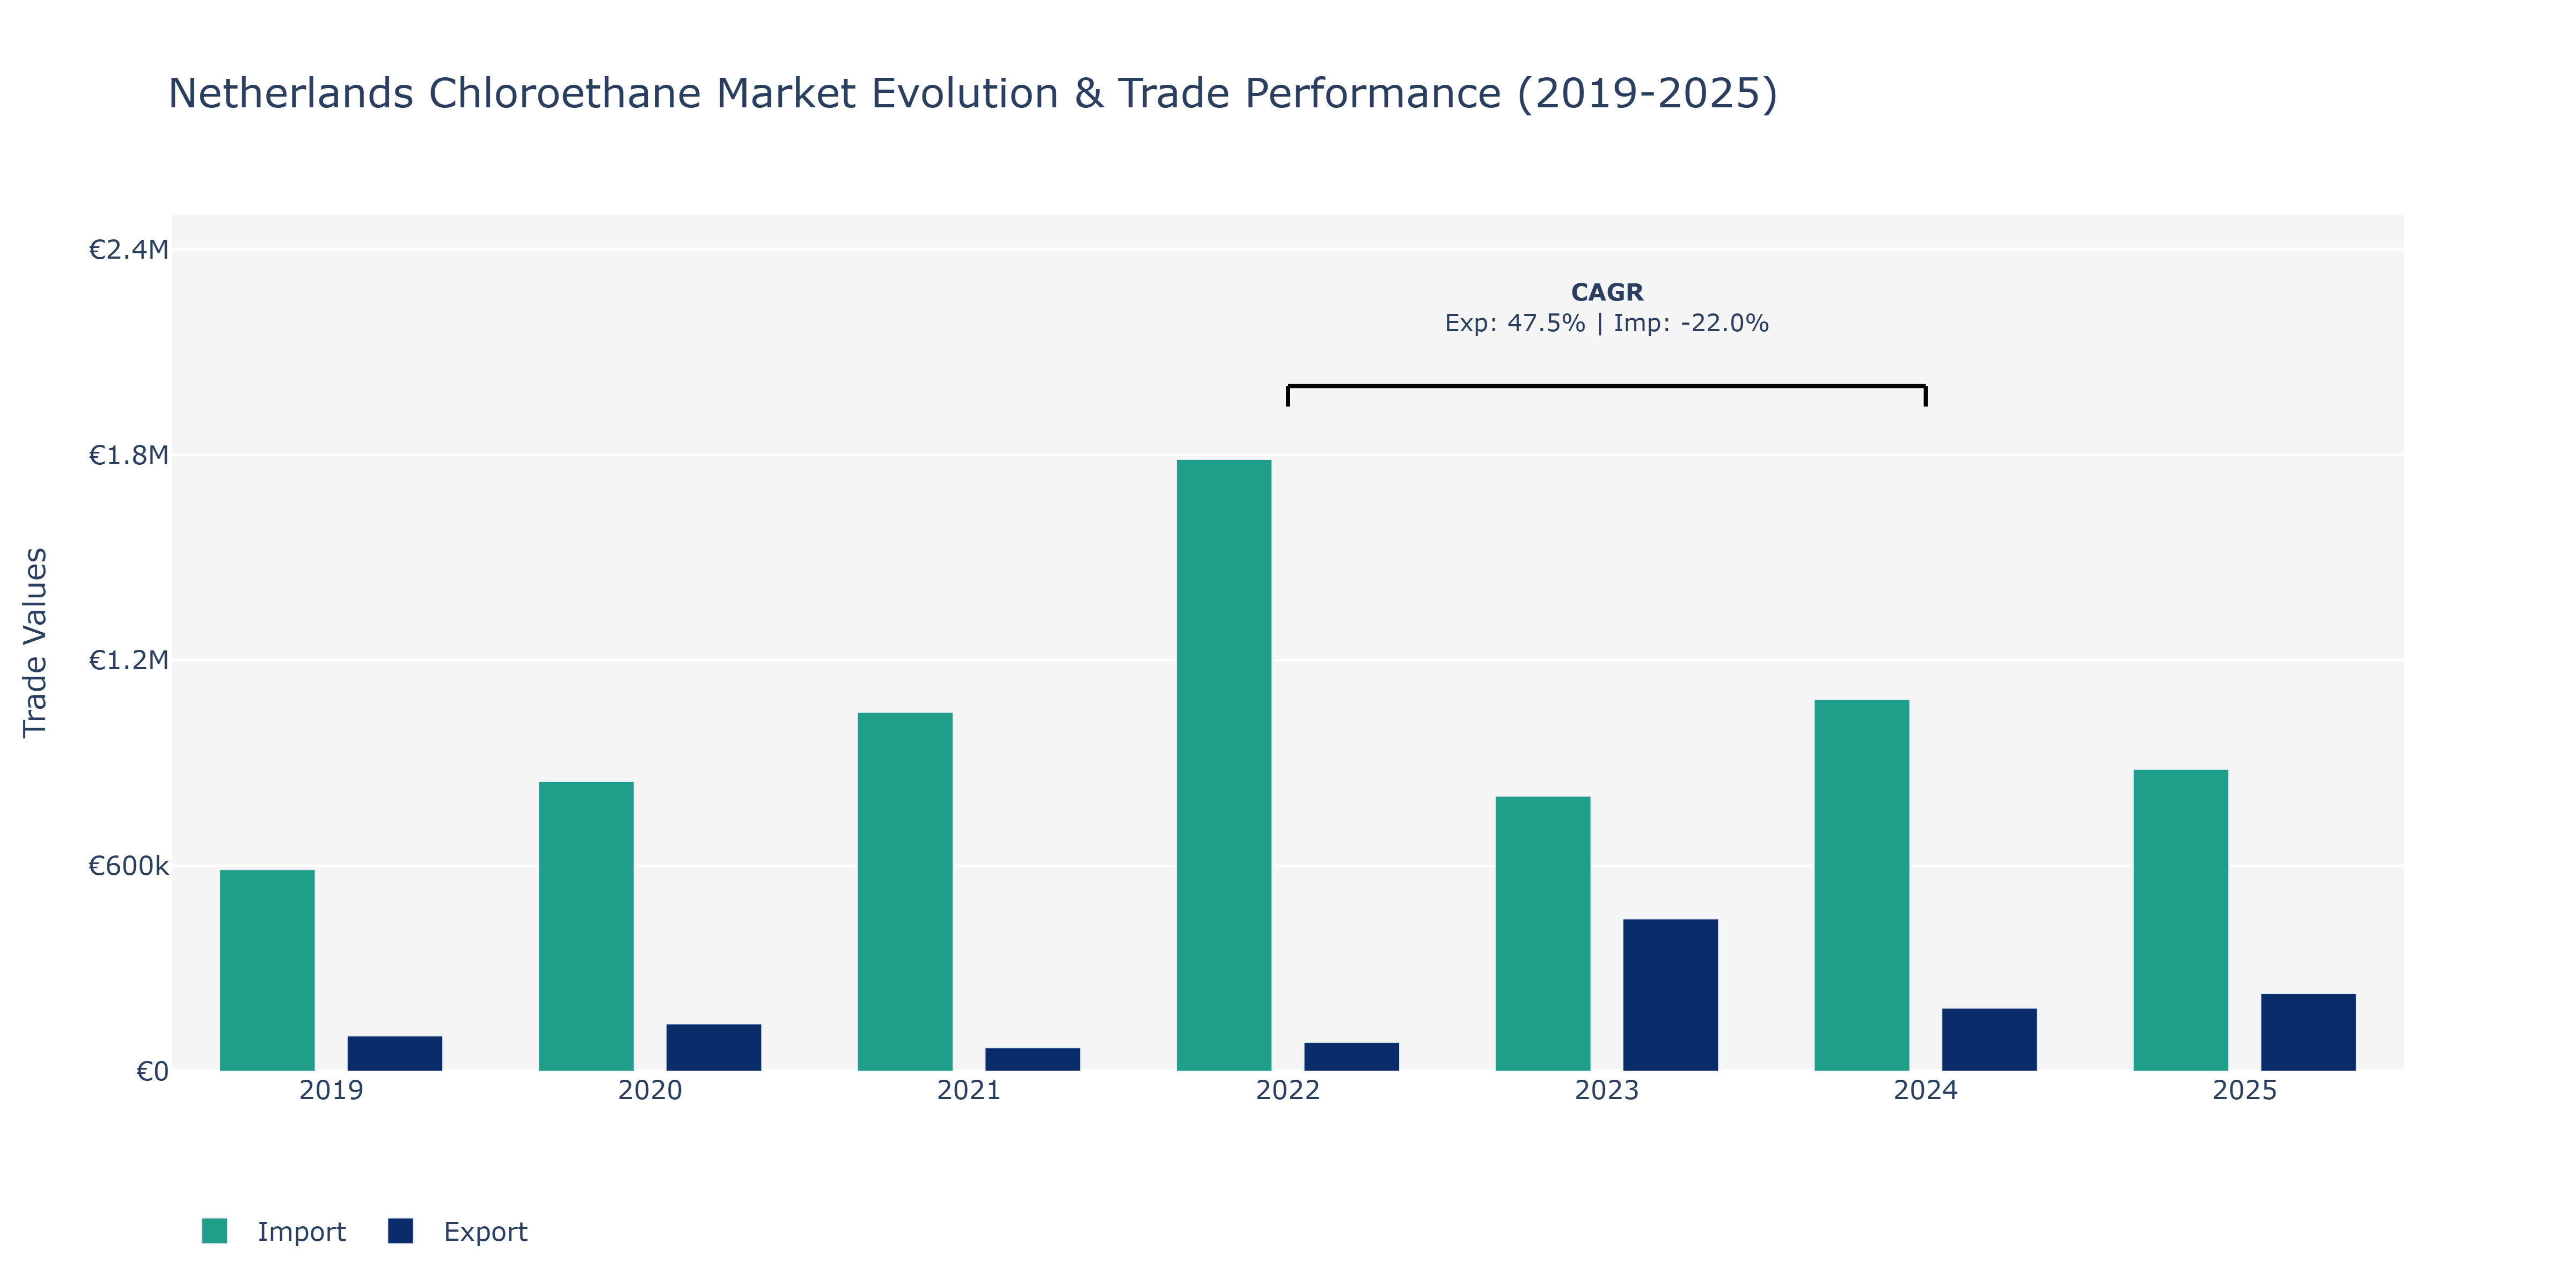
The Netherlands Chloroethane market witnessed notable fluctuations in both exports and imports from 2019 to 2025. In 2019, exports stood at €103.1 thousand, increasing to €138.47 thousand in 2020 before experiencing a significant drop to €68.44 thousand in 2021. Subsequently, exports surged to €444.69 thousand in 2023, indicating a substantial peak, and then decreased to €184.29 thousand in 2024, highlighting a notable decline. By 2025, exports rebounded to €227.33 thousand. On the import side, the market saw imports grow consistently from €588.93 thousand in 2019 to €1.79 million in 2022, representing a substantial upswing. However, imports decreased to €803.44 thousand in 2023, before rising again to €1.09 million in 2024, and then slightly dropping to €881.38 thousand in 2025. The fluctuations in exports and imports could be attributed to various factors, such as changes in global demand for chloroethane, shifts in pricing and supply chains, and regulatory developments impacting trade dynamics. The rising exports in 2023 could be linked to increased international demand due to economic recovery post-pandemic, while the subsequent decline might reflect market stabilization or changes in trade policies. The fluctuations in imports also suggest a dynamic market affected by factors like raw material sourcing, manufacturing trends, and regulatory compliance, showcasing the market's responsiveness to both domestic and international influences.
Key Highlights of the Report:
- Netherlands Chloroethane Market Outlook
- Market Size of Netherlands Chloroethane Market, 2025
- Forecast of Netherlands Chloroethane Market, 2032
- Historical Data and Forecast of Netherlands Chloroethane Revenues & Volume for the Period 2022 - 2032F
- Netherlands Chloroethane Market Trend Evolution
- Netherlands Chloroethane Market Drivers and Challenges
- Netherlands Chloroethane Price Trends
- Netherlands Chloroethane Porter`s Five Forces
- Netherlands Chloroethane Industry Life Cycle
- Historical Data and Forecast of Netherlands Chloroethane Market Revenues & Volume By Application for the Period 2022 - 2032F
- Historical Data and Forecast of Netherlands Chloroethane Market Revenues & Volume By Pesticide for the Period 2022 - 2032F
- Historical Data and Forecast of Netherlands Chloroethane Market Revenues & Volume By Dye for the Period 2022 - 2032F
- Historical Data and Forecast of Netherlands Chloroethane Market Revenues & Volume By Foamed Plastics for the Period 2022 - 2032F
- Historical Data and Forecast of Netherlands Chloroethane Market Revenues & Volume By Pharmaceuticals for the Period 2022 - 2032F
- Historical Data and Forecast of Netherlands Chloroethane Market Revenues & Volume By Other Chemicals for the Period 2022 - 2032F
- Historical Data and Forecast of Netherlands Chloroethane Market Revenues & Volume By Product Type for the Period 2022 - 2032F
- Historical Data and Forecast of Netherlands Chloroethane Market Revenues & Volume By Monochloroethane for the Period 2022 - 2032F
- Historical Data and Forecast of Netherlands Chloroethane Market Revenues & Volume By Dichloroethane for the Period 2022 - 2032F
- Netherlands Chloroethane Import Export Trade Statistics
- Market Opportunity Assessment By Application
- Market Opportunity Assessment By Product Type
- Netherlands Chloroethane Top Companies Market Share
- Netherlands Chloroethane Competitive Benchmarking By Technical and Operational Parameters
- Netherlands Chloroethane Company Profiles
- Netherlands Chloroethane Key Strategic Recommendations
Frequently Asked Questions About the Market Study (FAQs):
6Wresearch actively monitors the Netherlands Chloroethane Market and publishes its comprehensive annual report, highlighting emerging trends, growth drivers, revenue analysis, and forecast outlook. Our insights help businesses to make data-backed strategic decisions with ongoing market dynamics. Our analysts track relevent industries related to the Netherlands Chloroethane Market, allowing our clients with actionable intelligence and reliable forecasts tailored to emerging regional needs.
Yes, we provide customisation as per your requirements. To learn more, feel free to contact us on sales@6wresearch.com
1 Executive Summary |
2 Introduction |
2.1 Key Highlights of the Report |
2.2 Report Description |
2.3 Market Scope & Segmentation |
2.4 Research Methodology |
2.5 Assumptions |
3 Netherlands Chloroethane Market Overview |
3.1 Netherlands Country Macro Economic Indicators |
3.2 Netherlands Chloroethane Market Revenues & Volume, 2022 & 2032F |
3.3 Netherlands Chloroethane Market - Industry Life Cycle |
3.4 Netherlands Chloroethane Market - Porter's Five Forces |
3.5 Netherlands Chloroethane Market Revenues & Volume Share, By Application, 2022 & 2032F |
3.6 Netherlands Chloroethane Market Revenues & Volume Share, By Product Type, 2022 & 2032F |
4 Netherlands Chloroethane Market Dynamics |
4.1 Impact Analysis |
4.2 Market Drivers |
4.2.1 Growing demand for chloroethane in the pharmaceutical industry for the production of various drugs |
4.2.2 Increasing use of chloroethane as a solvent in the chemicals and manufacturing sector |
4.2.3 Favorable government regulations promoting the use of eco-friendly chloroethane products |
4.3 Market Restraints |
4.3.1 Fluctuating raw material prices impacting the production cost of chloroethane |
4.3.2 Strict environmental regulations governing the usage and disposal of chloroethane |
4.3.3 Intense competition from alternative chemicals and solvents in the market |
5 Netherlands Chloroethane Market Trends |
6 Netherlands Chloroethane Market Segmentations |
6.1 Netherlands Chloroethane Market, By Application |
6.1.1 Overview and Analysis |
6.1.2 Netherlands Chloroethane Market Revenues & Volume, By Pesticide, 2022 - 2032F |
6.1.3 Netherlands Chloroethane Market Revenues & Volume, By Dye, 2022 - 2032F |
6.1.4 Netherlands Chloroethane Market Revenues & Volume, By Foamed Plastics, 2022 - 2032F |
6.1.5 Netherlands Chloroethane Market Revenues & Volume, By Pharmaceuticals, 2022 - 2032F |
6.1.6 Netherlands Chloroethane Market Revenues & Volume, By Other Chemicals, 2022 - 2032F |
6.2 Netherlands Chloroethane Market, By Product Type |
6.2.1 Overview and Analysis |
6.2.2 Netherlands Chloroethane Market Revenues & Volume, By Monochloroethane, 2022 - 2032F |
6.2.3 Netherlands Chloroethane Market Revenues & Volume, By Dichloroethane, 2022 - 2032F |
7 Netherlands Chloroethane Market Import-Export Trade Statistics |
7.1 Netherlands Chloroethane Market Export to Major Countries |
7.2 Netherlands Chloroethane Market Imports from Major Countries |
8 Netherlands Chloroethane Market Key Performance Indicators |
8.1 Environmental impact indicators (e.g., carbon footprint reduction initiatives) |
8.2 Research and development investment in chloroethane product innovations |
8.3 Adoption rate of chloroethane-based products in different industries |
9 Netherlands Chloroethane Market - Opportunity Assessment |
9.1 Netherlands Chloroethane Market Opportunity Assessment, By Application, 2022 & 2032F |
9.2 Netherlands Chloroethane Market Opportunity Assessment, By Product Type, 2022 & 2032F |
10 Netherlands Chloroethane Market - Competitive Landscape |
10.1 Netherlands Chloroethane Market Revenue Share, By Companies, 2025 |
10.2 Netherlands Chloroethane Market Competitive Benchmarking, By Operating and Technical Parameters |
11 Company Profiles |
12 Recommendations | 13 Disclaimer |
Global Go To Market Strategy - 2030
Export potential enables firms to identify high-growth global markets with greater confidence by combining advanced trade intelligence with a structured quantitative methodology. The framework analyzes emerging demand trends and country-level import patterns while integrating macroeconomic and trade datasets such as GDP and population forecasts, bilateral import–export flows, tariff structures, elasticity differentials between developed and developing economies, geographic distance, and import demand projections. Using weighted trade values from 2020–2024 as the base period to project country-to-country export potential for 2030, these inputs are operationalized through calculated drivers such as gravity model parameters, tariff impact factors, and projected GDP per-capita growth. Through an analysis of hidden potentials, demand hotspots, and market conditions that are most favorable to success, this method enables firms to focus on target countries, maximize returns, and global expansion with data, backed by accuracy.
By factoring in the projected importer demand gap that is currently unmet and could be potential opportunity, it identifies the potential for the Exporter (Country) among 190 countries, against the general trade analysis, which identifies the biggest importer or exporter.
To discover high-growth global markets and optimize your business strategy:
Click Here
Pricing
- Single User License$ 1,995
- Department License$ 2,400
- Site License$ 3,120
- Global License$ 3,795

Leadership Perspectives from Industry Events
Search
Thought Leadership and Analyst Meet


Our Clients
6WResearch In News
- India Export Attractiveness Tracker 2026
- India Air Conditioner Market Set for Strong Rebound in 2026 After Weather-Led Correction and GST-Driven Recovery: 6Wresearch
- ADAS in India: How Automatic Emergency Braking, Blind Spot Detection & Driver Monitoring are Transforming Road Safety
- Doha a strategic location for EV manufacturing hub: IPA Qatar
- Demand for luxury TVs surging in the GCC, says Samsung
- Empowering Growth: The Thriving Journey of Bangladesh’s Cable Industry
Latest Reports
- Nicaragua RPG Gaming Market (2026-2032)
- New Zealand RPG Gaming Market (2026-2032)
- Netherlands RPG Gaming Market (2026-2032)
- Nauru RPG Gaming Market (2026-2032)
- Namibia RPG Gaming Market (2026-2032)
- Mozambique RPG Gaming Market (2026-2032)
- Montenegro RPG Gaming Market (2026-2032)
- Mongolia RPG Gaming Market (2026-2032)
- Monaco RPG Gaming Market (2026-2032)
- Micronesia RPG Gaming Market (2026-2032)
Industry Events and Analyst Meet

EV India Expo 2026

HIMTEX 2026

India Refining Summit 2026

India EV Show 2026

EV tech India Expo 2026
Whitepaper
- Middle East & Africa Commercial Security Market Click here to view more.
- Middle East & Africa Fire Safety Systems & Equipment Market Click here to view more.
- GCC Drone Market Click here to view more.
- Middle East Lighting Fixture Market Click here to view more.
- GCC Physical & Perimeter Security Market Click here to view more.