Netherlands Ferro Vanadium Market (2026-2032) | Forecast, Size, Growth, Segmentation, Trends, Outlook, Analysis, Share, Industry, Revenue, Companies & Value
Market Forecast By Grade (FeV40, FeV50, FeV60, FeV80), By Production Process (Reduction by Silicon, Reduction by Aluminum), By Application (Concrete Reinforcing Bars, Structural Plates, Axles, Frames, Crankshafts, Titanium Alloys, Pipeline, Others), By End-users (Building & Construction, Aerospace & Defense, Marine, Chemical Industry, Oil & Gas, Industrial Equipment, Automotive, Others) And Competitive Landscape
| Product Code: ETC4739665 | Publication Date: Nov 2023 | Updated Date: Apr 2026 | Product Type: Market Research Report | |
| Publisher: 6Wresearch | Author: Shubham Deep | No. of Pages: 60 | No. of Figures: 30 | No. of Tables: 5 |
Netherlands Ferro Vanadium Market Size (2020-2030)
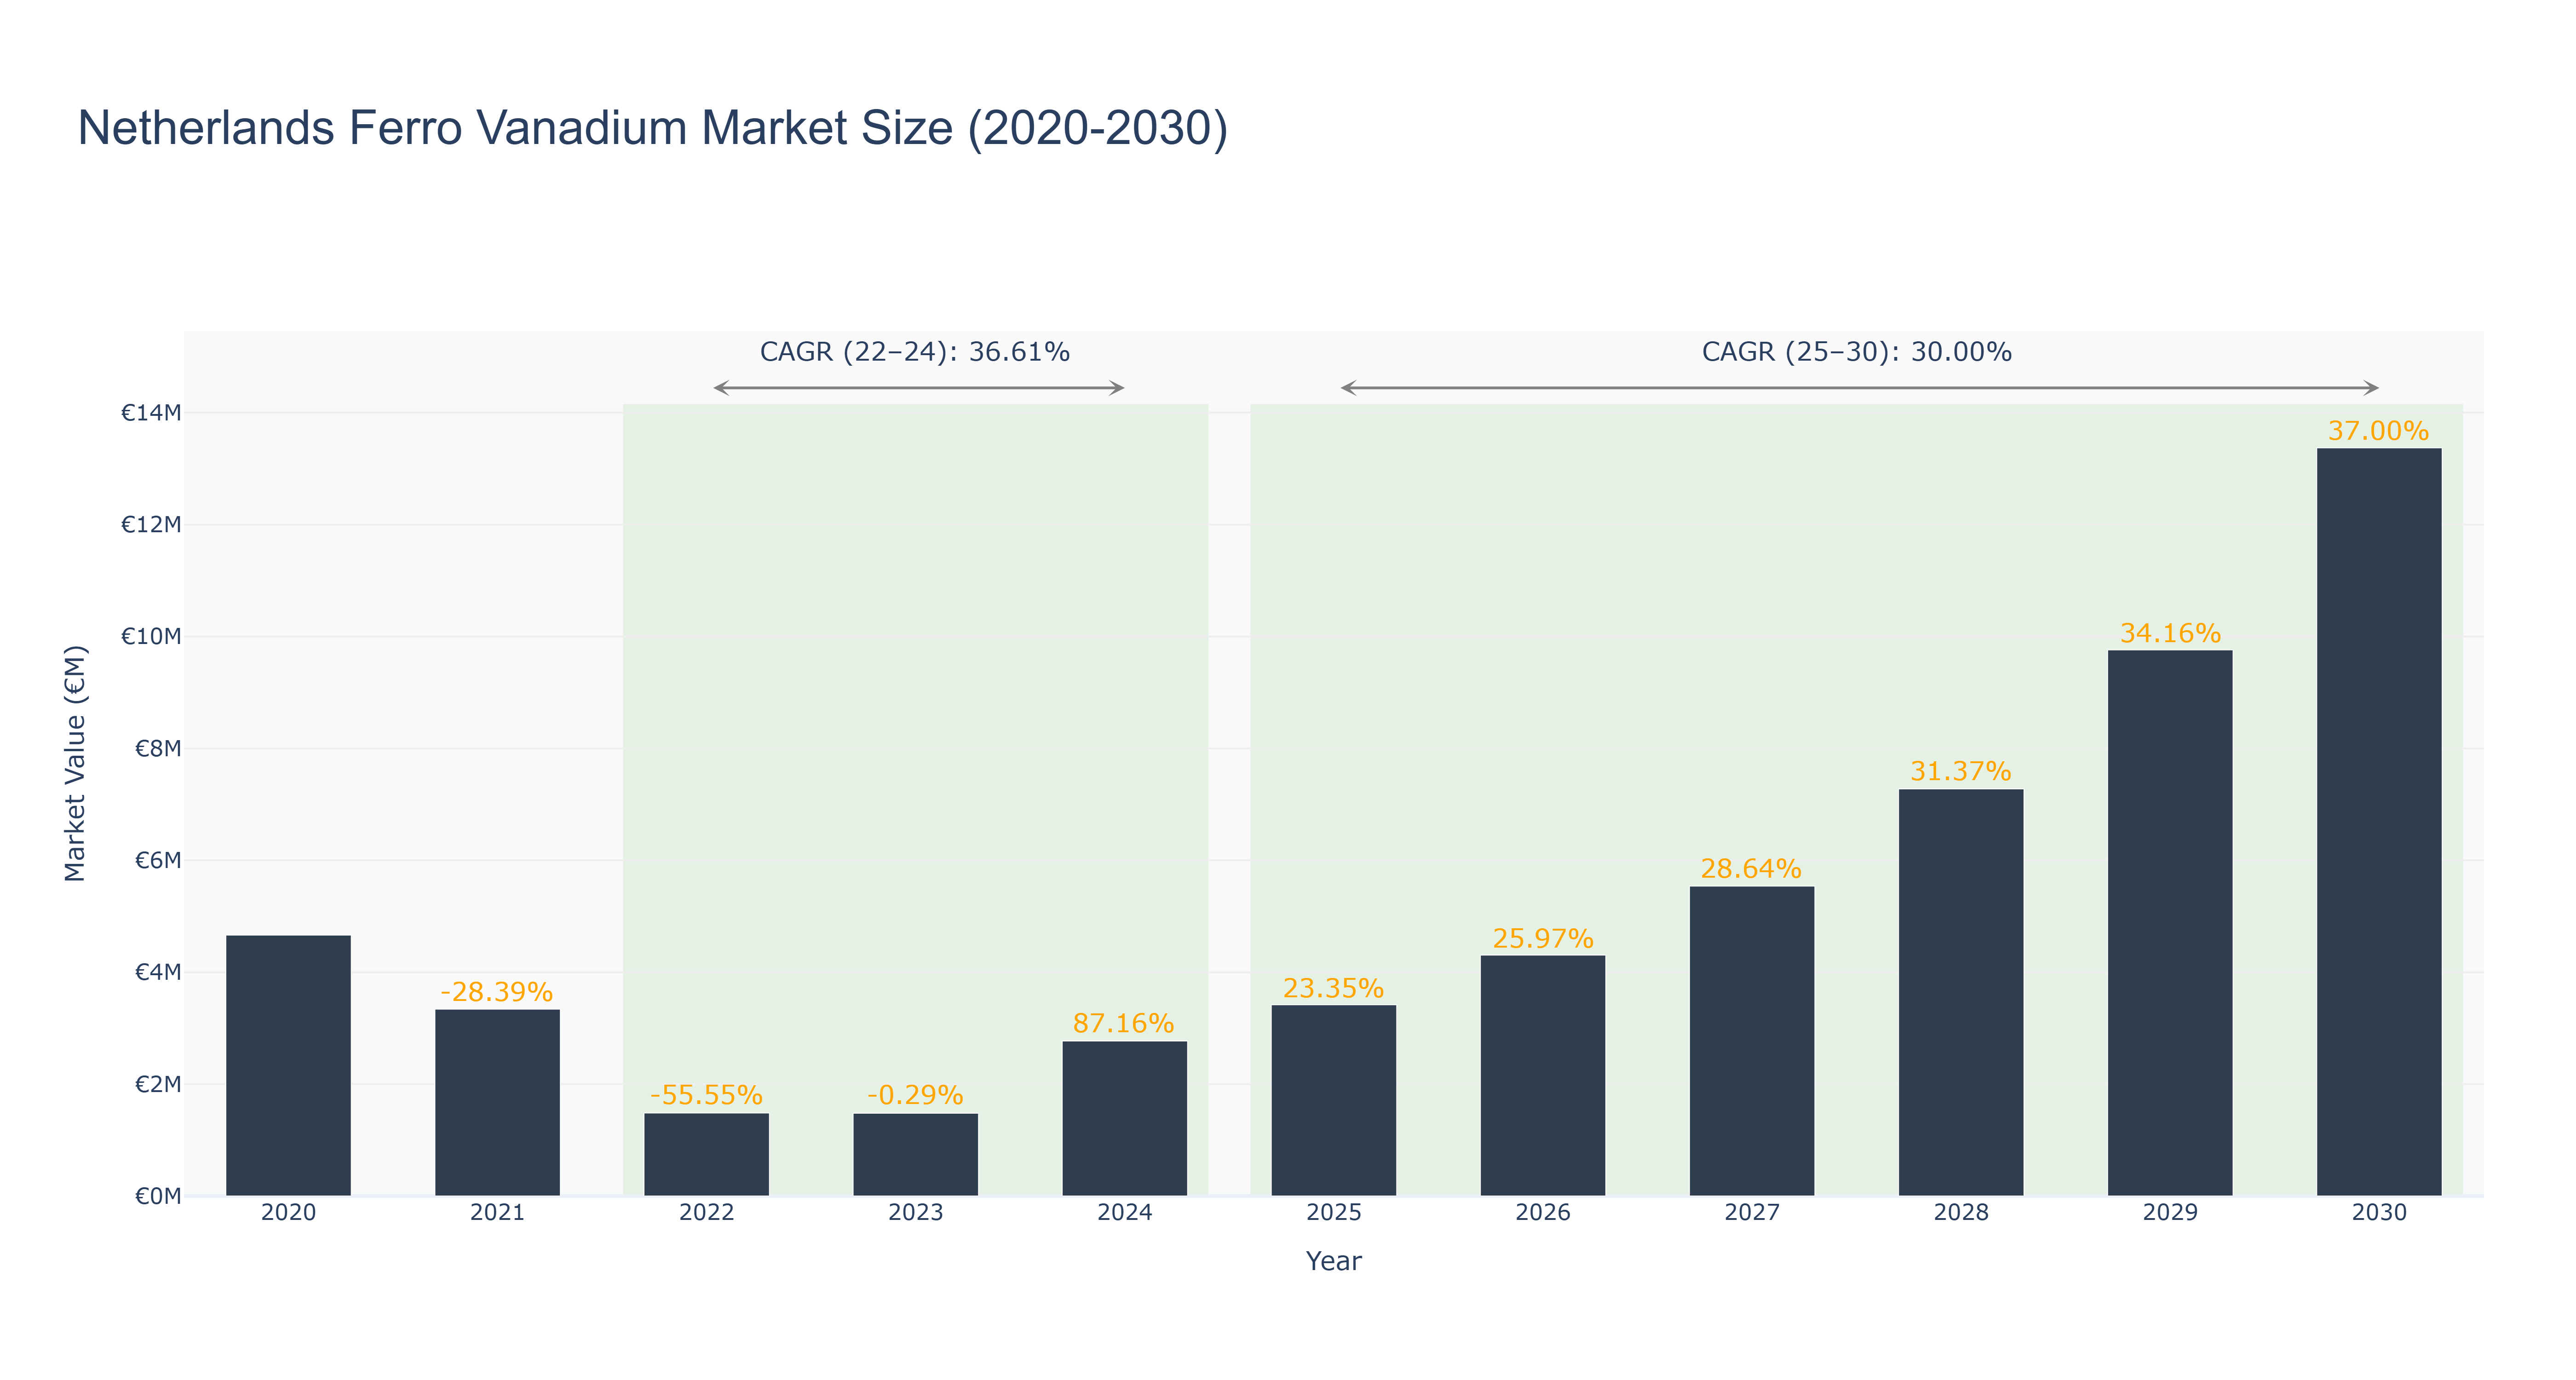
Netherlands Ferro Vanadium Market has shown a fluctuating trend in recent years. The market peaked at €13.37 million in 2030 with a steady growth rate. From 2020 to 2024, the market size decreased significantly, hitting a low of €1.48 million in 2022, before rebounding to €2.77 million in 2024. The market is forecasted to continue growing steadily from 2025 to 2030, with a CAGR of 30.0%. The decline in market size in the early 2020s can be attributed to global economic uncertainties and fluctuating demand. However, the subsequent growth can be linked to increasing industrial applications and technological advancements in the ferro vanadium sector. Moving forward, upcoming infrastructure projects in the Netherlands are expected to drive further growth in the ferro vanadium market.
Netherlands Ferro Vanadium Market: Production & Trade Performance (2019-2025)
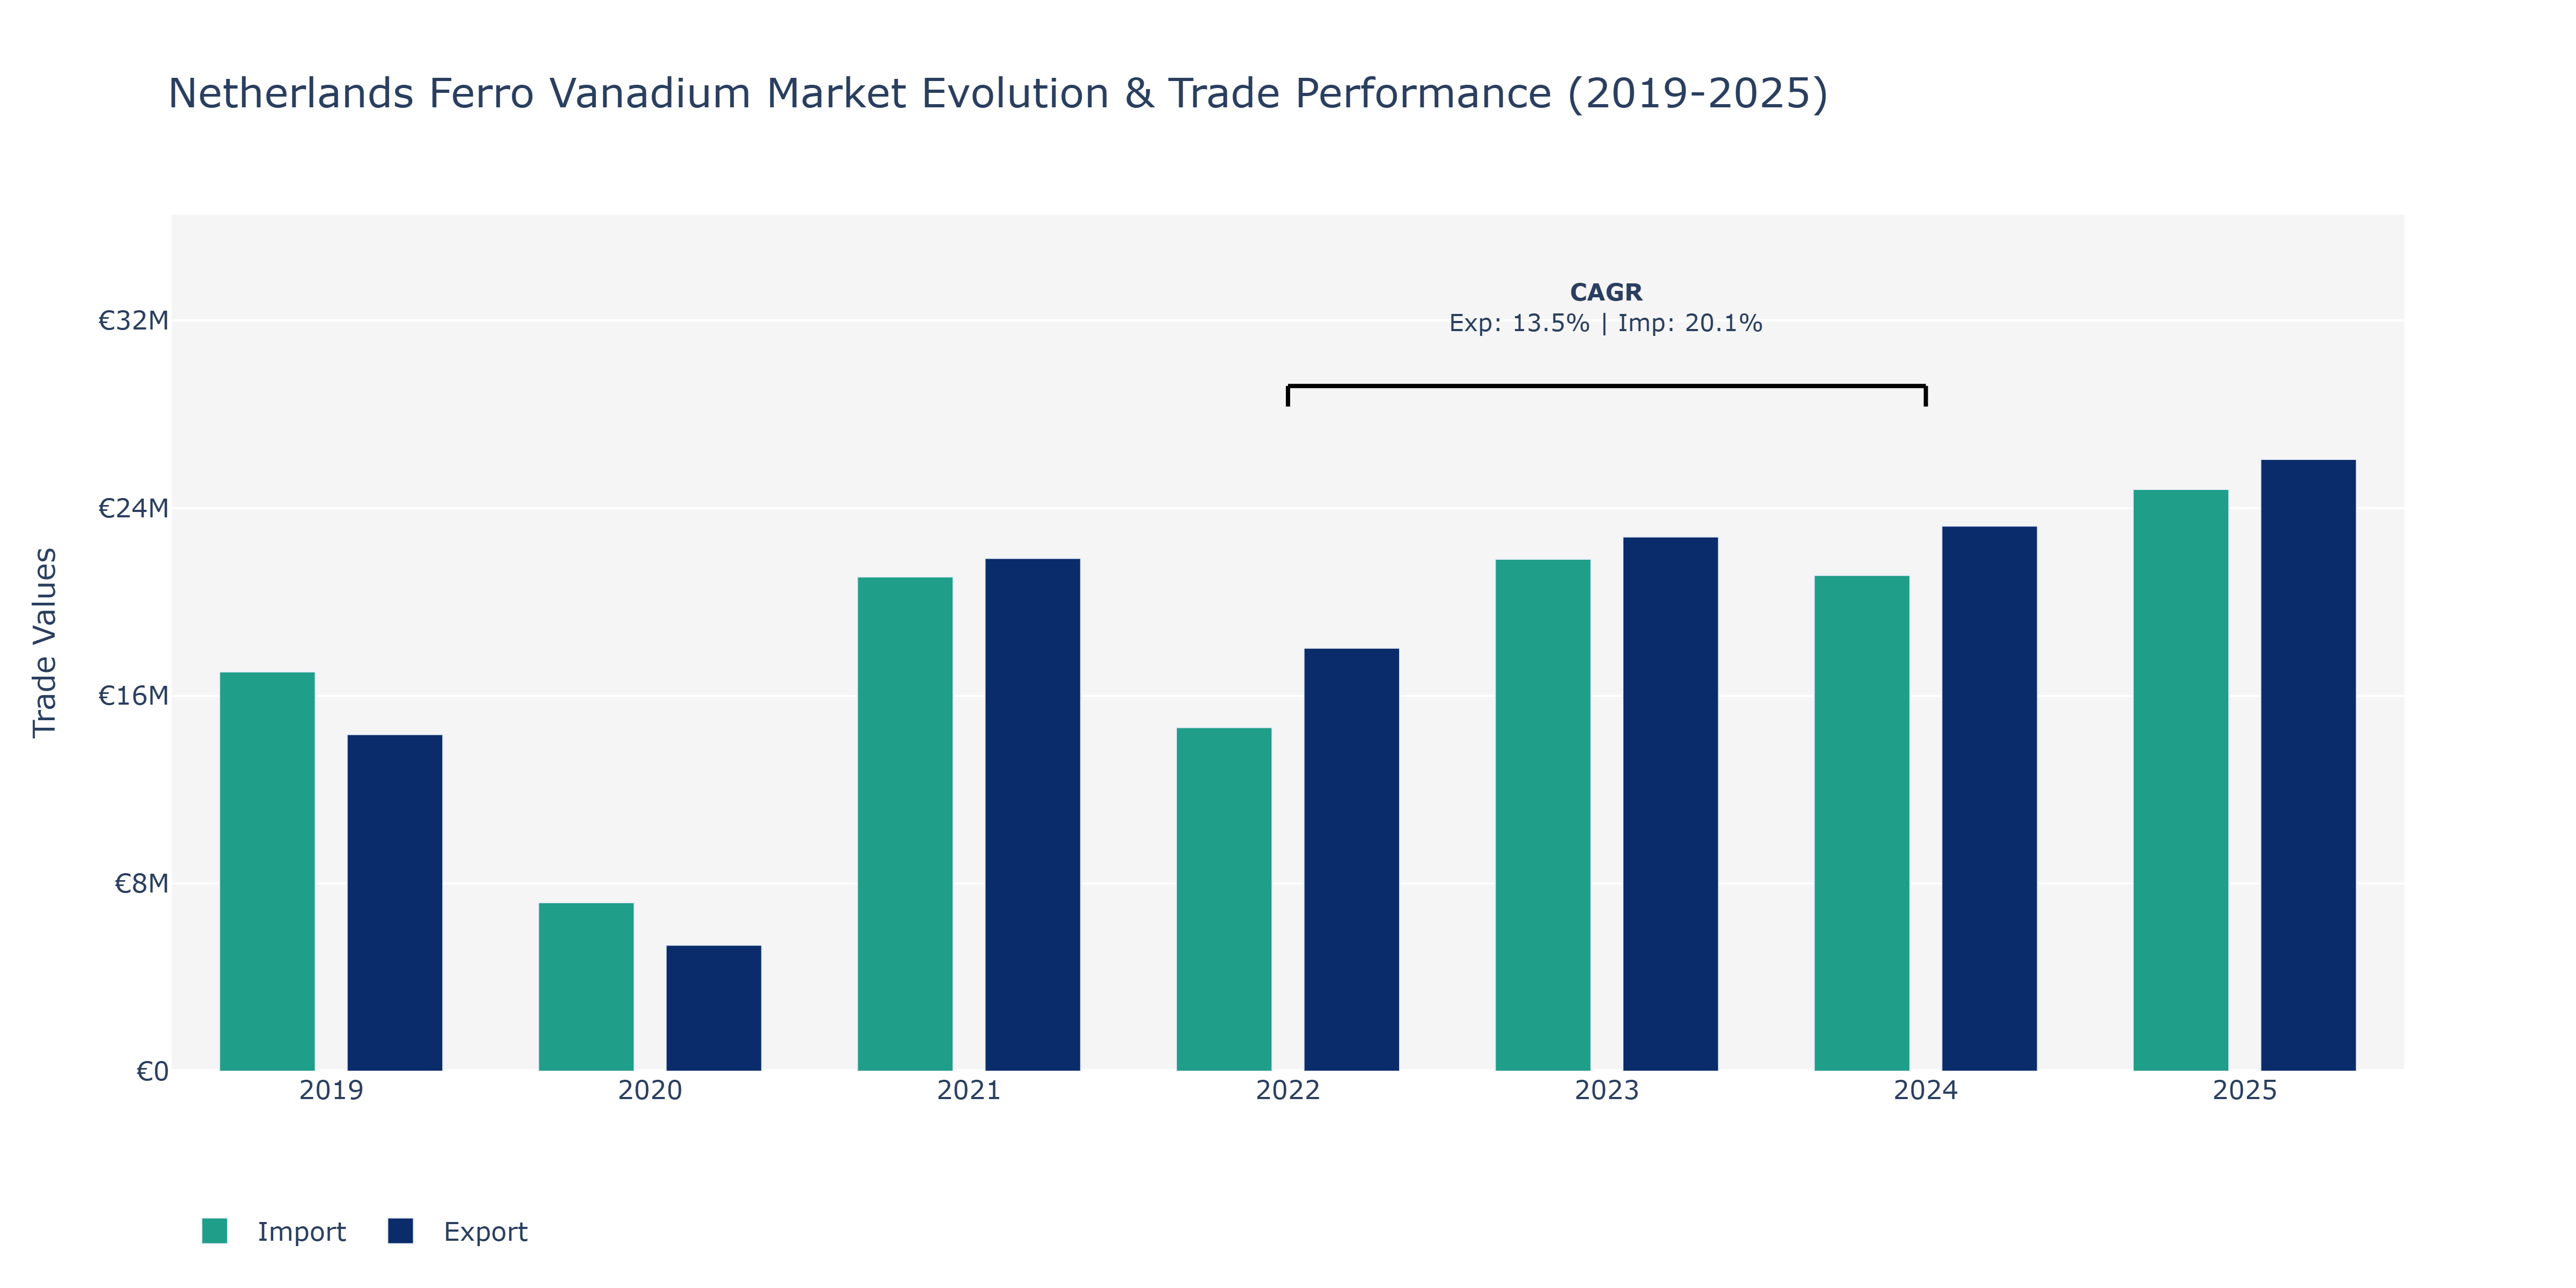
In the Netherlands Ferro Vanadium Market, from 2019 to 2025, exports and imports displayed varied trends. Exports saw a substantial increase from €14.35 million in 2019 to €26.08 million in 2025, with noticeable fluctuations in-between. On the other hand, imports peaked at €21.07 million in 2021, showing a decline in the following years but still remaining above the initial value. The peak in imports in 2021 could be attributed to increased industrial activities requiring Ferro Vanadium, possibly driven by infrastructure projects or the manufacturing sector's expansion. The fluctuations in both exports and imports might have been influenced by global market demand, price variations, and trade agreements impacting the Netherlands' position as a key player in the Ferro Vanadium market. These trends align with the growing global demand for vanadium in steel production and renewable energy installations, reflecting the Netherlands' role as a significant player in the international Ferro Vanadium trade landscape.
Key Highlights of the Report:
- Netherlands Ferro Vanadium Market Outlook
- Market Size of Netherlands Ferro Vanadium Market, 2025
- Forecast of Netherlands Ferro Vanadium Market, 2032
- Historical Data and Forecast of Netherlands Ferro Vanadium Revenues & Volume for the Period 2022 - 2032F
- Netherlands Ferro Vanadium Market Trend Evolution
- Netherlands Ferro Vanadium Market Drivers and Challenges
- Netherlands Ferro Vanadium Price Trends
- Netherlands Ferro Vanadium Porter`s Five Forces
- Netherlands Ferro Vanadium Industry Life Cycle
- Historical Data and Forecast of Netherlands Ferro Vanadium Market Revenues & Volume By Grade for the Period 2022 - 2032F
- Historical Data and Forecast of Netherlands Ferro Vanadium Market Revenues & Volume By FeV40 for the Period 2022 - 2032F
- Historical Data and Forecast of Netherlands Ferro Vanadium Market Revenues & Volume By FeV50 for the Period 2022 - 2032F
- Historical Data and Forecast of Netherlands Ferro Vanadium Market Revenues & Volume By FeV60 for the Period 2022 - 2032F
- Historical Data and Forecast of Netherlands Ferro Vanadium Market Revenues & Volume By FeV80 for the Period 2022 - 2032F
- Historical Data and Forecast of Netherlands Ferro Vanadium Market Revenues & Volume By Production Process for the Period 2022 - 2032F
- Historical Data and Forecast of Netherlands Ferro Vanadium Market Revenues & Volume By Reduction by Silicon for the Period 2022 - 2032F
- Historical Data and Forecast of Netherlands Ferro Vanadium Market Revenues & Volume By Reduction by Aluminum for the Period 2022 - 2032F
- Historical Data and Forecast of Netherlands Ferro Vanadium Market Revenues & Volume By Application for the Period 2022 - 2032F
- Historical Data and Forecast of Netherlands Ferro Vanadium Market Revenues & Volume By Concrete Reinforcing Bars for the Period 2022 - 2032F
- Historical Data and Forecast of Netherlands Ferro Vanadium Market Revenues & Volume By Structural Plates for the Period 2022 - 2032F
- Historical Data and Forecast of Netherlands Ferro Vanadium Market Revenues & Volume By Axles for the Period 2022 - 2032F
- Historical Data and Forecast of Netherlands Ferro Vanadium Market Revenues & Volume By Frames for the Period 2022 - 2032F
- Historical Data and Forecast of Netherlands Ferro Vanadium Market Revenues & Volume By Crankshafts for the Period 2022 - 2032F
- Historical Data and Forecast of Netherlands Ferro Vanadium Market Revenues & Volume By Titanium Alloys for the Period 2022 - 2032F
- Historical Data and Forecast of Netherlands Ferro Vanadium Market Revenues & Volume By Pipeline for the Period 2022 - 2032F
- Historical Data and Forecast of Netherlands Ferro Vanadium Market Revenues & Volume By Others for the Period 2022 - 2032F
- Historical Data and Forecast of Netherlands Ferro Vanadium Market Revenues & Volume By End-users for the Period 2022 - 2032F
- Historical Data and Forecast of Netherlands Ferro Vanadium Market Revenues & Volume By Building & Construction for the Period 2022 - 2032F
- Historical Data and Forecast of Netherlands Ferro Vanadium Market Revenues & Volume By Aerospace & Defense for the Period 2022 - 2032F
- Historical Data and Forecast of Netherlands Ferro Vanadium Market Revenues & Volume By Marine for the Period 2022 - 2032F
- Historical Data and Forecast of Netherlands Ferro Vanadium Market Revenues & Volume By Chemical Industry for the Period 2022 - 2032F
- Historical Data and Forecast of Netherlands Ferro Vanadium Market Revenues & Volume By Oil & Gas for the Period 2022 - 2032F
- Historical Data and Forecast of Netherlands Ferro Vanadium Market Revenues & Volume By Industrial Equipment for the Period 2022 - 2032F
- Historical Data and Forecast of Netherlands Ferro Vanadium Market Revenues & Volume By Automotive for the Period 2022 - 2032F
- Historical Data and Forecast of Netherlands Ferro Vanadium Market Revenues & Volume By Others for the Period 2022 - 2032F
- Netherlands Ferro Vanadium Import Export Trade Statistics
- Market Opportunity Assessment By Grade
- Market Opportunity Assessment By Production Process
- Market Opportunity Assessment By Application
- Market Opportunity Assessment By End-users
- Netherlands Ferro Vanadium Top Companies Market Share
- Netherlands Ferro Vanadium Competitive Benchmarking By Technical and Operational Parameters
- Netherlands Ferro Vanadium Company Profiles
- Netherlands Ferro Vanadium Key Strategic Recommendations
Frequently Asked Questions About the Market Study (FAQs):
6Wresearch actively monitors the Netherlands Ferro Vanadium Market and publishes its comprehensive annual report, highlighting emerging trends, growth drivers, revenue analysis, and forecast outlook. Our insights help businesses to make data-backed strategic decisions with ongoing market dynamics. Our analysts track relevent industries related to the Netherlands Ferro Vanadium Market, allowing our clients with actionable intelligence and reliable forecasts tailored to emerging regional needs.
Yes, we provide customisation as per your requirements. To learn more, feel free to contact us on sales@6wresearch.com
1 Executive Summary |
2 Introduction |
2.1 Key Highlights of the Report |
2.2 Report Description |
2.3 Market Scope & Segmentation |
2.4 Research Methodology |
2.5 Assumptions |
3 Netherlands Ferro Vanadium Market Overview |
3.1 Netherlands Country Macro Economic Indicators |
3.2 Netherlands Ferro Vanadium Market Revenues & Volume, 2022 & 2032F |
3.3 Netherlands Ferro Vanadium Market - Industry Life Cycle |
3.4 Netherlands Ferro Vanadium Market - Porter's Five Forces |
3.5 Netherlands Ferro Vanadium Market Revenues & Volume Share, By Grade, 2022 & 2032F |
3.6 Netherlands Ferro Vanadium Market Revenues & Volume Share, By Production Process, 2022 & 2032F |
3.7 Netherlands Ferro Vanadium Market Revenues & Volume Share, By Application, 2022 & 2032F |
3.8 Netherlands Ferro Vanadium Market Revenues & Volume Share, By End-users, 2022 & 2032F |
4 Netherlands Ferro Vanadium Market Dynamics |
4.1 Impact Analysis |
4.2 Market Drivers |
4.2.1 Increasing demand for steel and alloys in various industries, driving the need for ferro vanadium as an alloying agent. |
4.2.2 Growth in the construction and automotive sectors, where ferro vanadium is used for enhancing the strength and durability of materials. |
4.2.3 Technological advancements leading to the development of new applications for ferro vanadium, expanding its market potential. |
4.3 Market Restraints |
4.3.1 Fluctuating prices of raw materials like vanadium and iron, impacting the overall production cost of ferro vanadium. |
4.3.2 Environmental regulations and sustainability concerns affecting the mining and processing of vanadium ores. |
4.3.3 Competition from alternative alloying elements and substitutes in the market, posing a challenge to the demand for ferro vanadium. |
5 Netherlands Ferro Vanadium Market Trends |
6 Netherlands Ferro Vanadium Market Segmentations |
6.1 Netherlands Ferro Vanadium Market, By Grade |
6.1.1 Overview and Analysis |
6.1.2 Netherlands Ferro Vanadium Market Revenues & Volume, By FeV40, 2022 - 2032F |
6.1.3 Netherlands Ferro Vanadium Market Revenues & Volume, By FeV50, 2022 - 2032F |
6.1.4 Netherlands Ferro Vanadium Market Revenues & Volume, By FeV60, 2022 - 2032F |
6.1.5 Netherlands Ferro Vanadium Market Revenues & Volume, By FeV80, 2022 - 2032F |
6.2 Netherlands Ferro Vanadium Market, By Production Process |
6.2.1 Overview and Analysis |
6.2.2 Netherlands Ferro Vanadium Market Revenues & Volume, By Reduction by Silicon, 2022 - 2032F |
6.2.3 Netherlands Ferro Vanadium Market Revenues & Volume, By Reduction by Aluminum, 2022 - 2032F |
6.3 Netherlands Ferro Vanadium Market, By Application |
6.3.1 Overview and Analysis |
6.3.2 Netherlands Ferro Vanadium Market Revenues & Volume, By Concrete Reinforcing Bars, 2022 - 2032F |
6.3.3 Netherlands Ferro Vanadium Market Revenues & Volume, By Structural Plates, 2022 - 2032F |
6.3.4 Netherlands Ferro Vanadium Market Revenues & Volume, By Axles, 2022 - 2032F |
6.3.5 Netherlands Ferro Vanadium Market Revenues & Volume, By Frames, 2022 - 2032F |
6.3.6 Netherlands Ferro Vanadium Market Revenues & Volume, By Crankshafts, 2022 - 2032F |
6.3.7 Netherlands Ferro Vanadium Market Revenues & Volume, By Titanium Alloys, 2022 - 2032F |
6.3.8 Netherlands Ferro Vanadium Market Revenues & Volume, By Others, 2022 - 2032F |
6.3.9 Netherlands Ferro Vanadium Market Revenues & Volume, By Others, 2022 - 2032F |
6.4 Netherlands Ferro Vanadium Market, By End-users |
6.4.1 Overview and Analysis |
6.4.2 Netherlands Ferro Vanadium Market Revenues & Volume, By Building & Construction, 2022 - 2032F |
6.4.3 Netherlands Ferro Vanadium Market Revenues & Volume, By Aerospace & Defense, 2022 - 2032F |
6.4.4 Netherlands Ferro Vanadium Market Revenues & Volume, By Marine, 2022 - 2032F |
6.4.5 Netherlands Ferro Vanadium Market Revenues & Volume, By Chemical Industry, 2022 - 2032F |
6.4.6 Netherlands Ferro Vanadium Market Revenues & Volume, By Oil & Gas, 2022 - 2032F |
6.4.7 Netherlands Ferro Vanadium Market Revenues & Volume, By Industrial Equipment, 2022 - 2032F |
6.4.8 Netherlands Ferro Vanadium Market Revenues & Volume, By Others, 2022 - 2032F |
6.4.9 Netherlands Ferro Vanadium Market Revenues & Volume, By Others, 2022 - 2032F |
7 Netherlands Ferro Vanadium Market Import-Export Trade Statistics |
7.1 Netherlands Ferro Vanadium Market Export to Major Countries |
7.2 Netherlands Ferro Vanadium Market Imports from Major Countries |
8 Netherlands Ferro Vanadium Market Key Performance Indicators |
8.1 Vanadium spot price trends: Monitoring the price movements of vanadium can provide insights into the cost dynamics and market conditions affecting ferro vanadium production. |
8.2 Capacity utilization rates of ferro vanadium manufacturers: Tracking the utilization rates of production facilities can indicate the level of demand and market competitiveness. |
8.3 Research and development investment in vanadium technologies: Assessing the level of RD investments in vanadium-related technologies can gauge future growth opportunities and market innovation. |
9 Netherlands Ferro Vanadium Market - Opportunity Assessment |
9.1 Netherlands Ferro Vanadium Market Opportunity Assessment, By Grade, 2022 & 2032F |
9.2 Netherlands Ferro Vanadium Market Opportunity Assessment, By Production Process, 2022 & 2032F |
9.3 Netherlands Ferro Vanadium Market Opportunity Assessment, By Application, 2022 & 2032F |
9.4 Netherlands Ferro Vanadium Market Opportunity Assessment, By End-users, 2022 & 2032F |
10 Netherlands Ferro Vanadium Market - Competitive Landscape |
10.1 Netherlands Ferro Vanadium Market Revenue Share, By Companies, 2025 |
10.2 Netherlands Ferro Vanadium Market Competitive Benchmarking, By Operating and Technical Parameters |
11 Company Profiles |
12 Recommendations | 13 Disclaimer |
Global Go To Market Strategy - 2030
Export potential enables firms to identify high-growth global markets with greater confidence by combining advanced trade intelligence with a structured quantitative methodology. The framework analyzes emerging demand trends and country-level import patterns while integrating macroeconomic and trade datasets such as GDP and population forecasts, bilateral import–export flows, tariff structures, elasticity differentials between developed and developing economies, geographic distance, and import demand projections. Using weighted trade values from 2020–2024 as the base period to project country-to-country export potential for 2030, these inputs are operationalized through calculated drivers such as gravity model parameters, tariff impact factors, and projected GDP per-capita growth. Through an analysis of hidden potentials, demand hotspots, and market conditions that are most favorable to success, this method enables firms to focus on target countries, maximize returns, and global expansion with data, backed by accuracy.
By factoring in the projected importer demand gap that is currently unmet and could be potential opportunity, it identifies the potential for the Exporter (Country) among 190 countries, against the general trade analysis, which identifies the biggest importer or exporter.
To discover high-growth global markets and optimize your business strategy:
Click Here
Pricing
- Single User License$ 1,995
- Department License$ 2,400
- Site License$ 3,120
- Global License$ 3,795

Leadership Perspectives from Industry Events
Search
Thought Leadership and Analyst Meet


Our Clients
6WResearch In News
- India Export Attractiveness Tracker 2026
- India Air Conditioner Market Set for Strong Rebound in 2026 After Weather-Led Correction and GST-Driven Recovery: 6Wresearch
- ADAS in India: How Automatic Emergency Braking, Blind Spot Detection & Driver Monitoring are Transforming Road Safety
- Doha a strategic location for EV manufacturing hub: IPA Qatar
- Demand for luxury TVs surging in the GCC, says Samsung
- Empowering Growth: The Thriving Journey of Bangladesh’s Cable Industry
Latest Reports
- Nicaragua RPG Gaming Market (2026-2032)
- New Zealand RPG Gaming Market (2026-2032)
- Netherlands RPG Gaming Market (2026-2032)
- Nauru RPG Gaming Market (2026-2032)
- Namibia RPG Gaming Market (2026-2032)
- Mozambique RPG Gaming Market (2026-2032)
- Montenegro RPG Gaming Market (2026-2032)
- Mongolia RPG Gaming Market (2026-2032)
- Monaco RPG Gaming Market (2026-2032)
- Micronesia RPG Gaming Market (2026-2032)
Industry Events and Analyst Meet

EV India Expo 2026

HIMTEX 2026

India Refining Summit 2026

India EV Show 2026

EV tech India Expo 2026
Whitepaper
- Middle East & Africa Commercial Security Market Click here to view more.
- Middle East & Africa Fire Safety Systems & Equipment Market Click here to view more.
- GCC Drone Market Click here to view more.
- Middle East Lighting Fixture Market Click here to view more.
- GCC Physical & Perimeter Security Market Click here to view more.