Netherlands Hastelloy Market (2026-2032) | Share, Competitive, Segments, Drivers, Challenges, Restraints, Segmentation, Analysis, Forecast, Demand, Supply, Companies, Value, Strategic Insights, Strategy, Trends, Investment Trends, Outlook, Industry, Opportunities, Size, Pricing Analysis, Growth, Competition, Revenue, Consumer Insights
Market Forecast By Application (Aerospace, Oil and Gas, Chemical Processing, Marine, Power Generation), By Form (Sheets, Bars, Wires, Pipes, Fittings), By End use (Aerospace Manufacturing, Petrochemical Industry, Pharmaceuticals, Energy Sector, Marine Engineering), By Grade Type (Hastelloy C-276, Hastelloy C-22, Hastelloy B-2, Hastelloy X, Hastelloy S) And Competitive Landscape
| Product Code: ETC12342732 | Publication Date: Apr 2025 | Updated Date: Apr 2026 | Product Type: Market Research Report | |
| Publisher: 6Wresearch | Author: Sachin Kumar Rai | No. of Pages: 65 | No. of Figures: 34 | No. of Tables: 19 |
Netherlands Hastelloy Market Size (2020-2030)
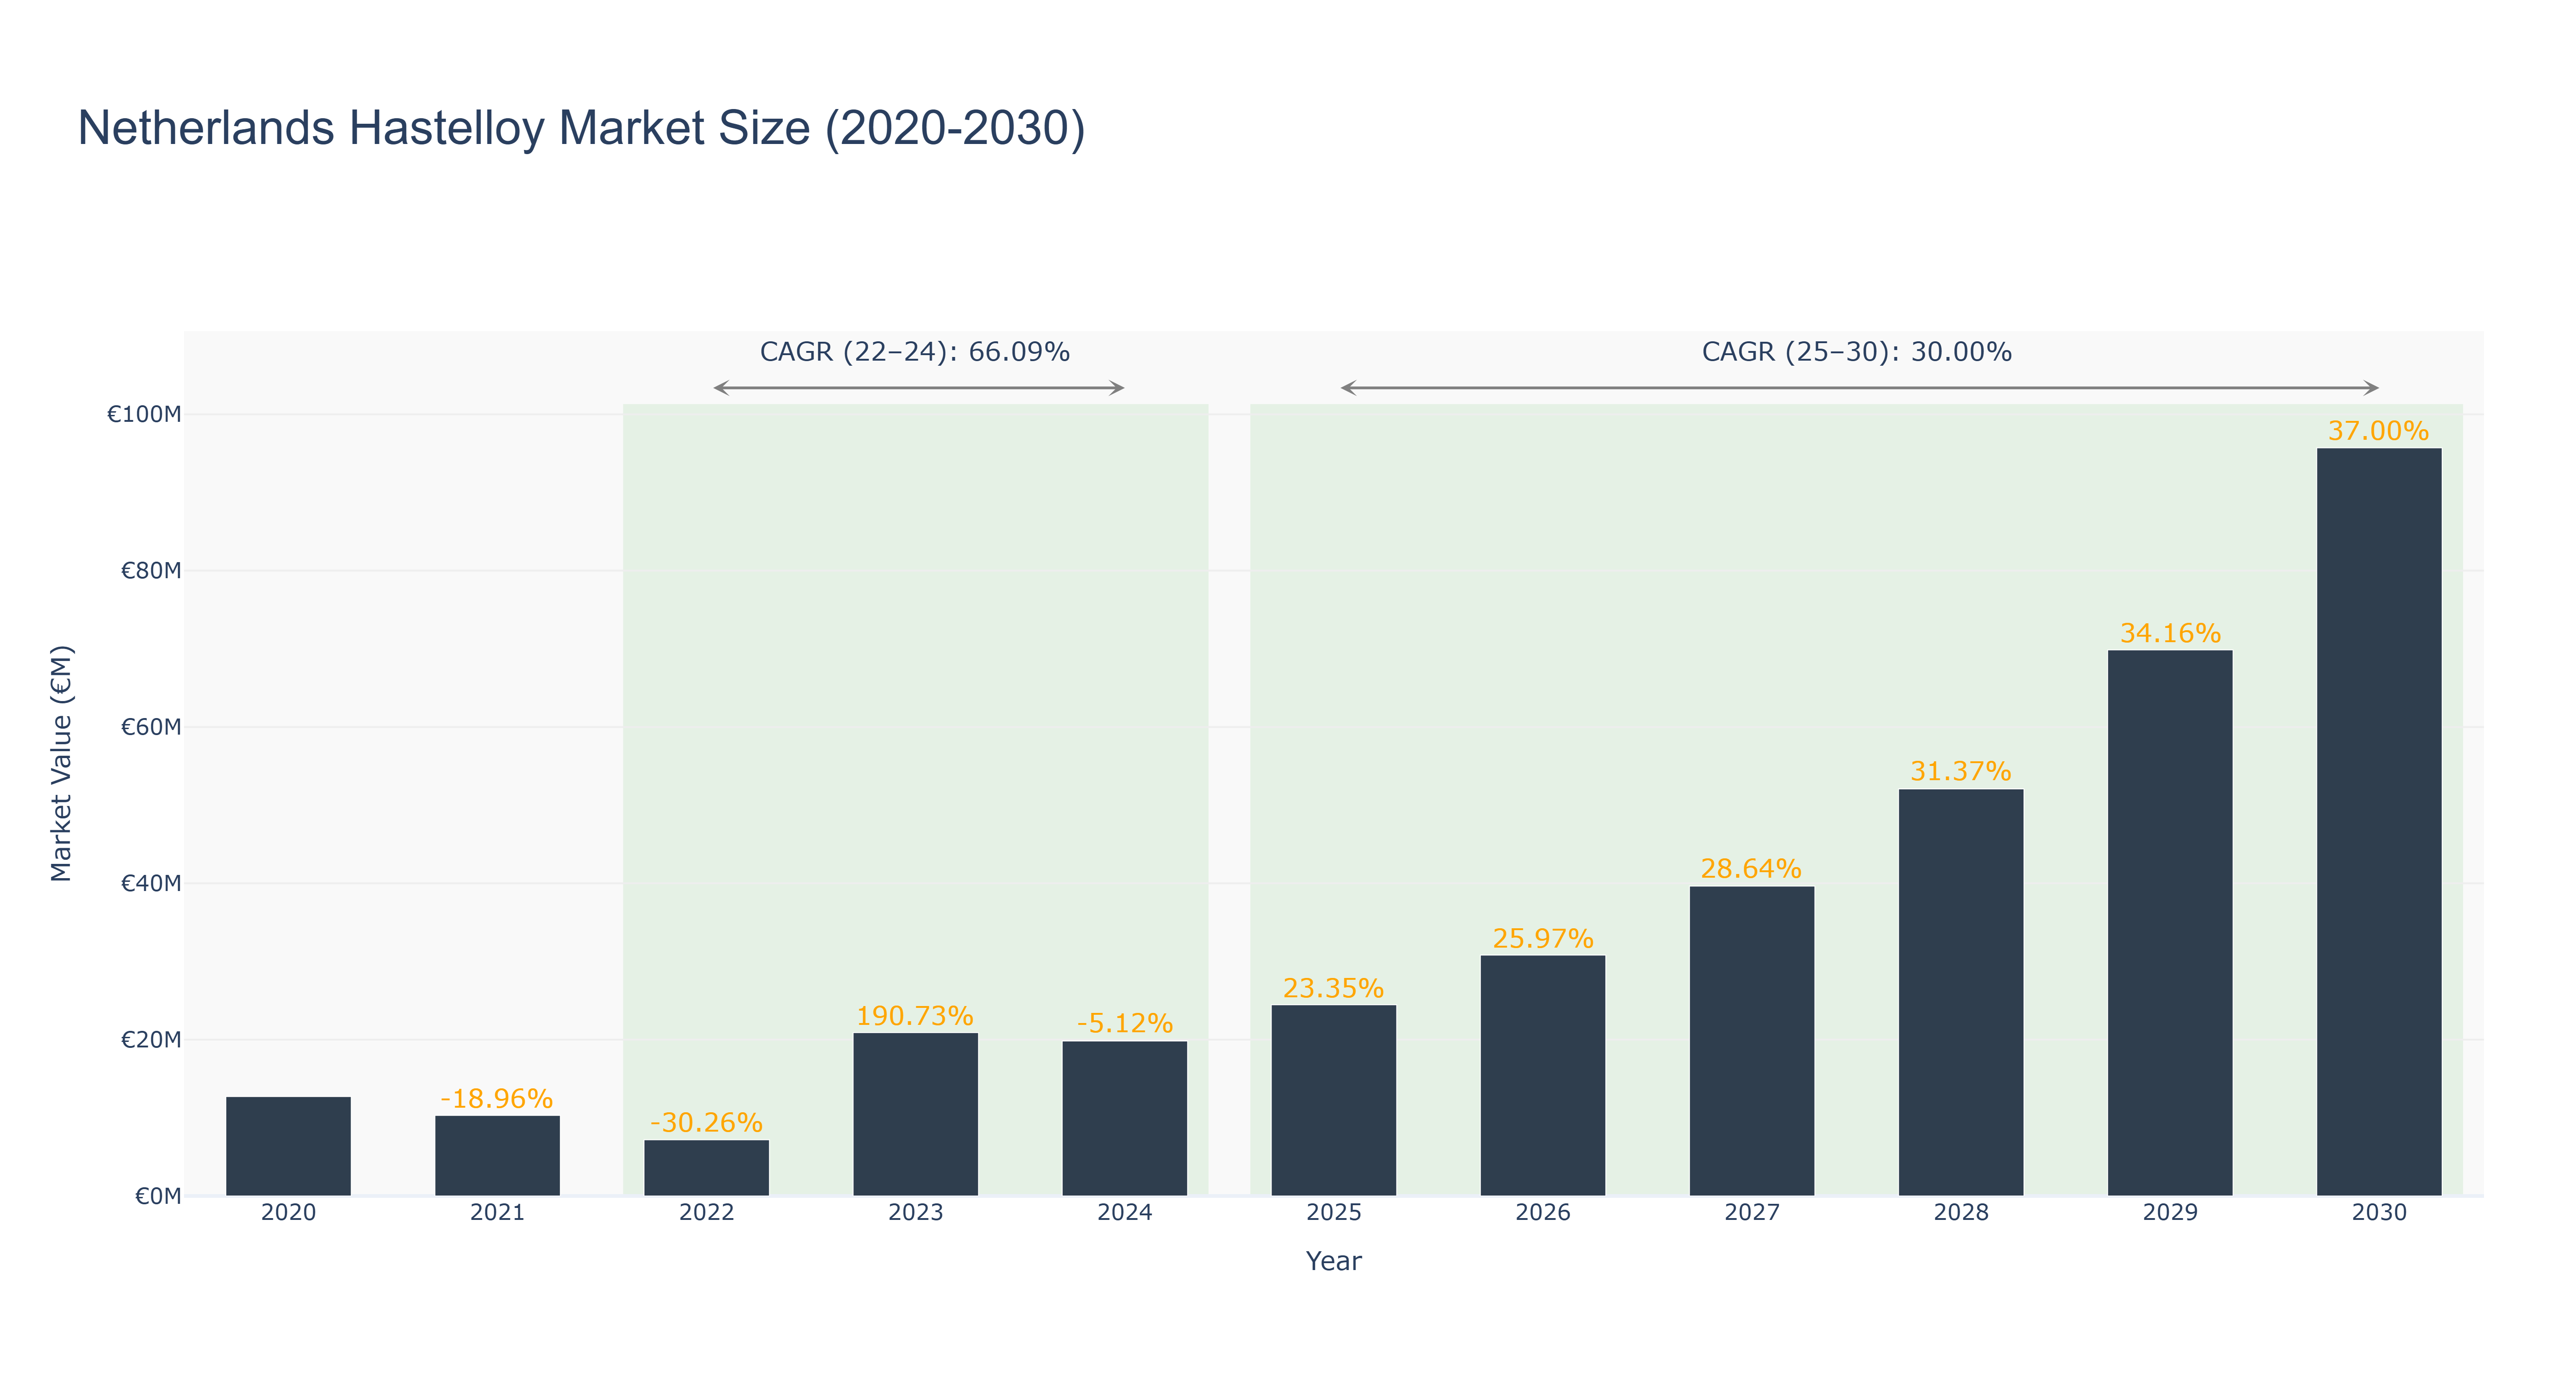
The Netherlands Hastelloy Market experienced significant fluctuations from 2020 to 2024, peaking at €12.72 million in 2020 before declining to €7.19 million in 2022, representing a sharp contraction of -30.26%. However, the market rebounded dramatically in 2023, reaching €20.90 million, driven largely by increased demand in aerospace and chemical processing industries. This resulted in a remarkable CAGR of 66.09% from 2022 to 2024. Looking ahead, the forecasted period (2025-2030) anticipates continued growth, with market size projected to reach €95.72 million by 2030, corresponding to a CAGR of 30.00%. This growth is underpinned by advancements in manufacturing technologies and increasing applications of Hastelloy in high-performance sectors. As sustainability and innovation become paramount, the market is likely to benefit from ongoing investments in green technologies and the expansion of renewable energy projects within the region.
Netherlands Hastelloy Market: Production & Trade Performance (2019-2025)
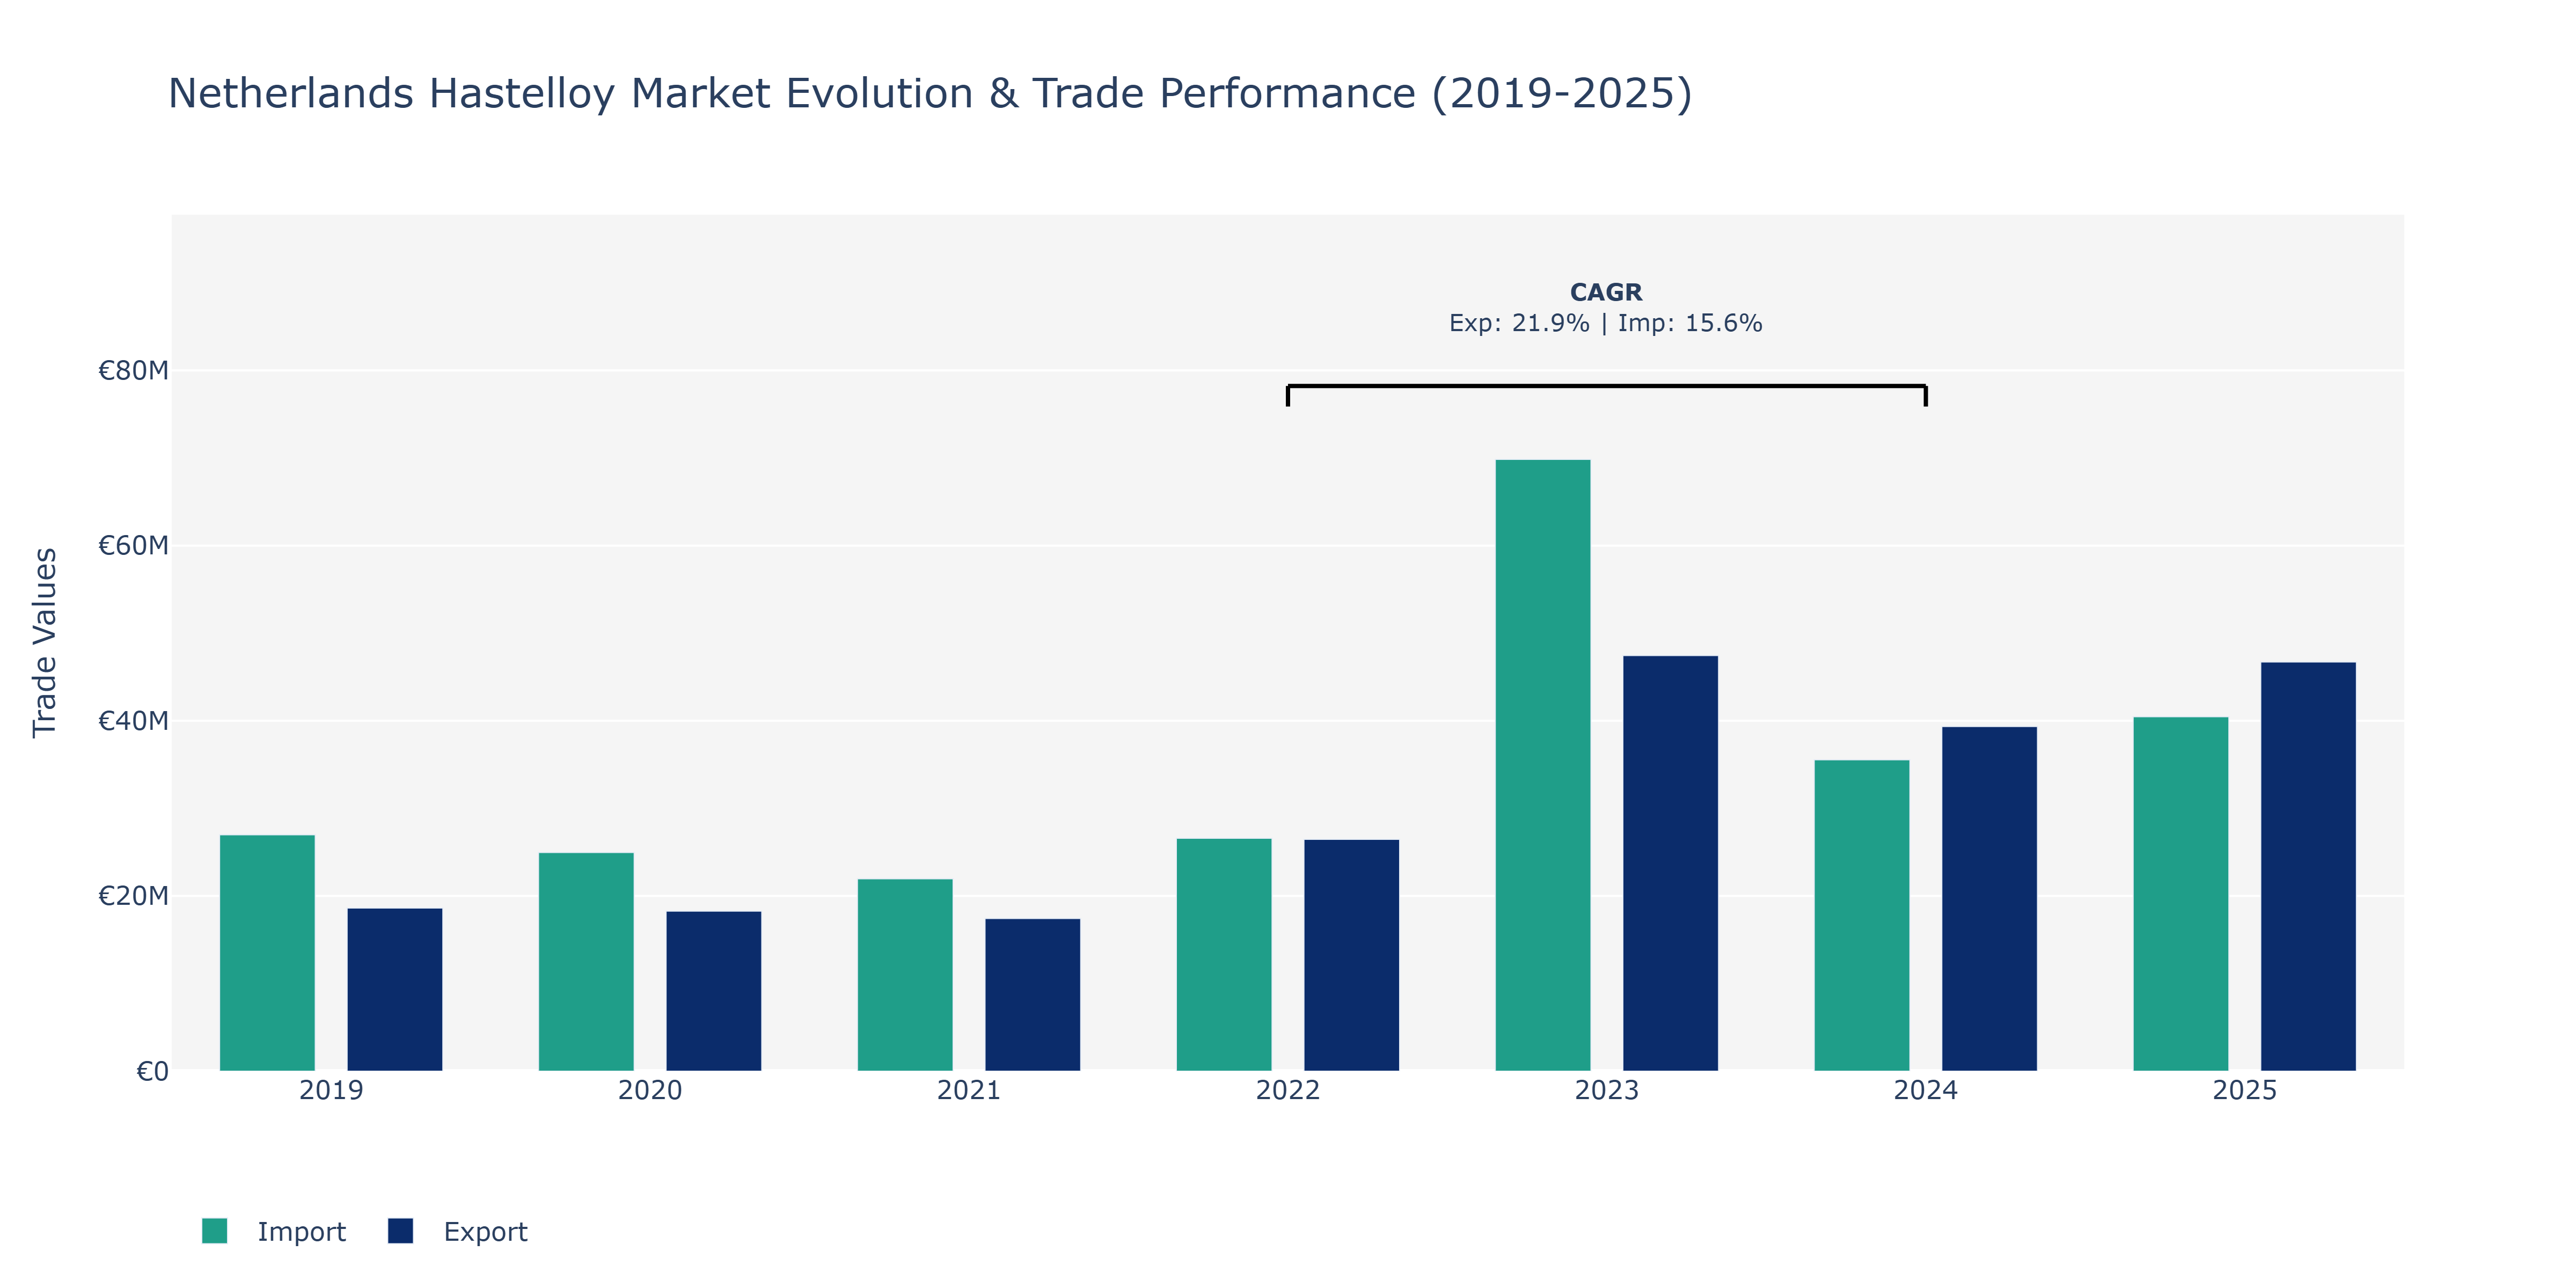
The Netherlands Hastelloy Market witnessed fluctuations in both Exports and Imports from 2019 to 2025. In 2019, Exports stood at around €18.63 million and Imports at approximately €26.99 million. By 2021, Exports decreased to €17.42 million while Imports dropped to €21.96 million. The market saw a substantial increase in Exports in 2023, reaching €47.46 million, while Imports peaked at €69.84 million the same year. The year 2025 showed a slight decline in Exports to around €46.71 million, and Imports decreased to approximately €40.47 million. The market's dynamics could be attributed to technological advancements in the aerospace and chemical industries, driving the demand for Hastelloy products, influencing the trade volumes. Additionally, the global economic recovery post-pandemic might have impacted the market positively, leading to varying import and Export value.
Key Highlights of the Report:
- Netherlands Hastelloy Market Outlook
- Market Size of Netherlands Hastelloy Market, 2025
- Forecast of Netherlands Hastelloy Market, 2032
- Historical Data and Forecast of Netherlands Hastelloy Revenues & Volume for the Period 2022 - 2032F
- Netherlands Hastelloy Market Trend Evolution
- Netherlands Hastelloy Market Drivers and Challenges
- Netherlands Hastelloy Price Trends
- Netherlands Hastelloy Porter's Five Forces
- Netherlands Hastelloy Industry Life Cycle
- Historical Data and Forecast of Netherlands Hastelloy Market Revenues & Volume By Application for the Period 2022 - 2032F
- Historical Data and Forecast of Netherlands Hastelloy Market Revenues & Volume By Aerospace for the Period 2022 - 2032F
- Historical Data and Forecast of Netherlands Hastelloy Market Revenues & Volume By Oil and Gas for the Period 2022 - 2032F
- Historical Data and Forecast of Netherlands Hastelloy Market Revenues & Volume By Chemical Processing for the Period 2022 - 2032F
- Historical Data and Forecast of Netherlands Hastelloy Market Revenues & Volume By Marine for the Period 2022 - 2032F
- Historical Data and Forecast of Netherlands Hastelloy Market Revenues & Volume By Power Generation for the Period 2022 - 2032F
- Historical Data and Forecast of Netherlands Hastelloy Market Revenues & Volume By Form for the Period 2022 - 2032F
- Historical Data and Forecast of Netherlands Hastelloy Market Revenues & Volume By Sheets for the Period 2022 - 2032F
- Historical Data and Forecast of Netherlands Hastelloy Market Revenues & Volume By Bars for the Period 2022 - 2032F
- Historical Data and Forecast of Netherlands Hastelloy Market Revenues & Volume By Wires for the Period 2022 - 2032F
- Historical Data and Forecast of Netherlands Hastelloy Market Revenues & Volume By Pipes for the Period 2022 - 2032F
- Historical Data and Forecast of Netherlands Hastelloy Market Revenues & Volume By Fittings for the Period 2022 - 2032F
- Historical Data and Forecast of Netherlands Hastelloy Market Revenues & Volume By End use for the Period 2022 - 2032F
- Historical Data and Forecast of Netherlands Hastelloy Market Revenues & Volume By Aerospace Manufacturing for the Period 2022 - 2032F
- Historical Data and Forecast of Netherlands Hastelloy Market Revenues & Volume By Petrochemical Industry for the Period 2022 - 2032F
- Historical Data and Forecast of Netherlands Hastelloy Market Revenues & Volume By Pharmaceuticals for the Period 2022 - 2032F
- Historical Data and Forecast of Netherlands Hastelloy Market Revenues & Volume By Energy Sector for the Period 2022 - 2032F
- Historical Data and Forecast of Netherlands Hastelloy Market Revenues & Volume By Marine Engineering for the Period 2022 - 2032F
- Historical Data and Forecast of Netherlands Hastelloy Market Revenues & Volume By Grade Type for the Period 2022 - 2032F
- Historical Data and Forecast of Netherlands Hastelloy Market Revenues & Volume By Hastelloy C-276 for the Period 2022 - 2032F
- Historical Data and Forecast of Netherlands Hastelloy Market Revenues & Volume By Hastelloy C-22 for the Period 2022 - 2032F
- Historical Data and Forecast of Netherlands Hastelloy Market Revenues & Volume By Hastelloy B-2 for the Period 2022 - 2032F
- Historical Data and Forecast of Netherlands Hastelloy Market Revenues & Volume By Hastelloy X for the Period 2022 - 2032F
- Historical Data and Forecast of Netherlands Hastelloy Market Revenues & Volume By Hastelloy S for the Period 2022 - 2032F
- Netherlands Hastelloy Import Export Trade Statistics
- Market Opportunity Assessment By Application
- Market Opportunity Assessment By Form
- Market Opportunity Assessment By End use
- Market Opportunity Assessment By Grade Type
- Netherlands Hastelloy Top Companies Market Share
- Netherlands Hastelloy Competitive Benchmarking By Technical and Operational Parameters
- Netherlands Hastelloy Company Profiles
- Netherlands Hastelloy Key Strategic Recommendations
Frequently Asked Questions About the Market Study (FAQs):
6Wresearch actively monitors the Netherlands Hastelloy Market and publishes its comprehensive annual report, highlighting emerging trends, growth drivers, revenue analysis, and forecast outlook. Our insights help businesses to make data-backed strategic decisions with ongoing market dynamics. Our analysts track relevent industries related to the Netherlands Hastelloy Market, allowing our clients with actionable intelligence and reliable forecasts tailored to emerging regional needs.
Yes, we provide customisation as per your requirements. To learn more, feel free to contact us on sales@6wresearch.com
1 Executive Summary |
2 Introduction |
2.1 Key Highlights of the Report |
2.2 Report Description |
2.3 Market Scope & Segmentation |
2.4 Research Methodology |
2.5 Assumptions |
3 Netherlands Hastelloy Market Overview |
3.1 Netherlands Country Macro Economic Indicators |
3.2 Netherlands Hastelloy Market Revenues & Volume, 2022 & 2032F |
3.3 Netherlands Hastelloy Market - Industry Life Cycle |
3.4 Netherlands Hastelloy Market - Porter's Five Forces |
3.5 Netherlands Hastelloy Market Revenues & Volume Share, By Application, 2022 & 2032F |
3.6 Netherlands Hastelloy Market Revenues & Volume Share, By Form, 2022 & 2032F |
3.7 Netherlands Hastelloy Market Revenues & Volume Share, By End use, 2022 & 2032F |
3.8 Netherlands Hastelloy Market Revenues & Volume Share, By Grade Type, 2022 & 2032F |
4 Netherlands Hastelloy Market Dynamics |
4.1 Impact Analysis |
4.2 Market Drivers |
4.2.1 Increasing demand for corrosion-resistant materials in industries such as chemical processing, oil gas, and pharmaceuticals. |
4.2.2 Growing emphasis on sustainable and environmentally friendly manufacturing processes. |
4.2.3 Technological advancements leading to the development of new and improved hastelloy grades. |
4.3 Market Restraints |
4.3.1 Fluctuations in raw material prices impacting the overall cost of hastelloy production. |
4.3.2 Intense competition from alternative materials like stainless steel and titanium. |
4.3.3 Economic uncertainties affecting investments in infrastructure projects that drive demand for hastelloy. |
5 Netherlands Hastelloy Market Trends |
6 Netherlands Hastelloy Market, By Types |
6.1 Netherlands Hastelloy Market, By Application |
6.1.1 Overview and Analysis |
6.1.2 Netherlands Hastelloy Market Revenues & Volume, By Application, 2022 - 2032F |
6.1.3 Netherlands Hastelloy Market Revenues & Volume, By Aerospace, 2022 - 2032F |
6.1.4 Netherlands Hastelloy Market Revenues & Volume, By Oil and Gas, 2022 - 2032F |
6.1.5 Netherlands Hastelloy Market Revenues & Volume, By Chemical Processing, 2022 - 2032F |
6.1.6 Netherlands Hastelloy Market Revenues & Volume, By Marine, 2022 - 2032F |
6.1.7 Netherlands Hastelloy Market Revenues & Volume, By Power Generation, 2022 - 2032F |
6.2 Netherlands Hastelloy Market, By Form |
6.2.1 Overview and Analysis |
6.2.2 Netherlands Hastelloy Market Revenues & Volume, By Sheets, 2022 - 2032F |
6.2.3 Netherlands Hastelloy Market Revenues & Volume, By Bars, 2022 - 2032F |
6.2.4 Netherlands Hastelloy Market Revenues & Volume, By Wires, 2022 - 2032F |
6.2.5 Netherlands Hastelloy Market Revenues & Volume, By Pipes, 2022 - 2032F |
6.2.6 Netherlands Hastelloy Market Revenues & Volume, By Fittings, 2022 - 2032F |
6.3 Netherlands Hastelloy Market, By End use |
6.3.1 Overview and Analysis |
6.3.2 Netherlands Hastelloy Market Revenues & Volume, By Aerospace Manufacturing, 2022 - 2032F |
6.3.3 Netherlands Hastelloy Market Revenues & Volume, By Petrochemical Industry, 2022 - 2032F |
6.3.4 Netherlands Hastelloy Market Revenues & Volume, By Pharmaceuticals, 2022 - 2032F |
6.3.5 Netherlands Hastelloy Market Revenues & Volume, By Energy Sector, 2022 - 2032F |
6.3.6 Netherlands Hastelloy Market Revenues & Volume, By Marine Engineering, 2022 - 2032F |
6.4 Netherlands Hastelloy Market, By Grade Type |
6.4.1 Overview and Analysis |
6.4.2 Netherlands Hastelloy Market Revenues & Volume, By Hastelloy C-276, 2022 - 2032F |
6.4.3 Netherlands Hastelloy Market Revenues & Volume, By Hastelloy C-22, 2022 - 2032F |
6.4.4 Netherlands Hastelloy Market Revenues & Volume, By Hastelloy B-2, 2022 - 2032F |
6.4.5 Netherlands Hastelloy Market Revenues & Volume, By Hastelloy X, 2022 - 2032F |
6.4.6 Netherlands Hastelloy Market Revenues & Volume, By Hastelloy S, 2022 - 2032F |
7 Netherlands Hastelloy Market Import-Export Trade Statistics |
7.1 Netherlands Hastelloy Market Export to Major Countries |
7.2 Netherlands Hastelloy Market Imports from Major Countries |
8 Netherlands Hastelloy Market Key Performance Indicators |
8.1 Average lead time for hastelloy product delivery. |
8.2 Number of new hastelloy grades introduced in the market. |
8.3 Percentage of hastelloy sales attributed to emerging industries like renewable energy and aerospace. |
8.4 Customer satisfaction scores related to hastelloy product quality and performance. |
8.5 Adoption rate of hastelloy in critical applications requiring high corrosion resistance. |
9 Netherlands Hastelloy Market - Opportunity Assessment |
9.1 Netherlands Hastelloy Market Opportunity Assessment, By Application, 2022 & 2032F |
9.2 Netherlands Hastelloy Market Opportunity Assessment, By Form, 2022 & 2032F |
9.3 Netherlands Hastelloy Market Opportunity Assessment, By End use, 2022 & 2032F |
9.4 Netherlands Hastelloy Market Opportunity Assessment, By Grade Type, 2022 & 2032F |
10 Netherlands Hastelloy Market - Competitive Landscape |
10.1 Netherlands Hastelloy Market Revenue Share, By Companies, 2025 |
10.2 Netherlands Hastelloy Market Competitive Benchmarking, By Operating and Technical Parameters |
11 Company Profiles |
12 Recommendations |
13 Disclaimer |
Global Go To Market Strategy - 2030
Export potential enables firms to identify high-growth global markets with greater confidence by combining advanced trade intelligence with a structured quantitative methodology. The framework analyzes emerging demand trends and country-level import patterns while integrating macroeconomic and trade datasets such as GDP and population forecasts, bilateral import–export flows, tariff structures, elasticity differentials between developed and developing economies, geographic distance, and import demand projections. Using weighted trade values from 2020–2024 as the base period to project country-to-country export potential for 2030, these inputs are operationalized through calculated drivers such as gravity model parameters, tariff impact factors, and projected GDP per-capita growth. Through an analysis of hidden potentials, demand hotspots, and market conditions that are most favorable to success, this method enables firms to focus on target countries, maximize returns, and global expansion with data, backed by accuracy.
By factoring in the projected importer demand gap that is currently unmet and could be potential opportunity, it identifies the potential for the Exporter (Country) among 190 countries, against the general trade analysis, which identifies the biggest importer or exporter.
To discover high-growth global markets and optimize your business strategy:
Click Here
Pricing
- Single User License$ 1,995
- Department License$ 2,400
- Site License$ 3,120
- Global License$ 3,795

Leadership Perspectives from Industry Events
Search
Thought Leadership and Analyst Meet


Our Clients
6WResearch In News
- India Export Attractiveness Tracker 2026
- India Air Conditioner Market Set for Strong Rebound in 2026 After Weather-Led Correction and GST-Driven Recovery: 6Wresearch
- ADAS in India: How Automatic Emergency Braking, Blind Spot Detection & Driver Monitoring are Transforming Road Safety
- Doha a strategic location for EV manufacturing hub: IPA Qatar
- Demand for luxury TVs surging in the GCC, says Samsung
- Empowering Growth: The Thriving Journey of Bangladesh’s Cable Industry
Latest Reports
- Nicaragua RPG Gaming Market (2026-2032)
- New Zealand RPG Gaming Market (2026-2032)
- Netherlands RPG Gaming Market (2026-2032)
- Nauru RPG Gaming Market (2026-2032)
- Namibia RPG Gaming Market (2026-2032)
- Mozambique RPG Gaming Market (2026-2032)
- Montenegro RPG Gaming Market (2026-2032)
- Mongolia RPG Gaming Market (2026-2032)
- Monaco RPG Gaming Market (2026-2032)
- Micronesia RPG Gaming Market (2026-2032)
Industry Events and Analyst Meet

EV India Expo 2026

HIMTEX 2026

India Refining Summit 2026

India EV Show 2026

EV tech India Expo 2026
Whitepaper
- Middle East & Africa Commercial Security Market Click here to view more.
- Middle East & Africa Fire Safety Systems & Equipment Market Click here to view more.
- GCC Drone Market Click here to view more.
- Middle East Lighting Fixture Market Click here to view more.
- GCC Physical & Perimeter Security Market Click here to view more.