Netherlands Kinetic Tiles Market (2025-2031) | Restraints, Value, Forecast, Consumer Insights, Competition, Pricing Analysis, Industry, Supply, Competitive, Size, Segments, Challenges, Companies, Segmentation, Growth, Opportunities, Revenue, Drivers, Demand, Strategy, Investment Trends, Share, Outlook, Analysis, Strategic Insights, Trends
Market Forecast By Application (Smart Buildings, Public Infrastructure, Sports Facilities), By Type (Piezoelectric Tiles, Electromagnetic Tiles), By End User (Commercial Sector, Residential Sector, Industrial Sector), By Technology (Kinetic Energy Harvesting, Piezoelectric Technology) And Competitive Landscape
| Product Code: ETC12893196 | Publication Date: Apr 2025 | Updated Date: Nov 2025 | Product Type: Market Research Report | |
| Publisher: 6Wresearch | Author: Summon Dutta | No. of Pages: 65 | No. of Figures: 34 | No. of Tables: 19 |
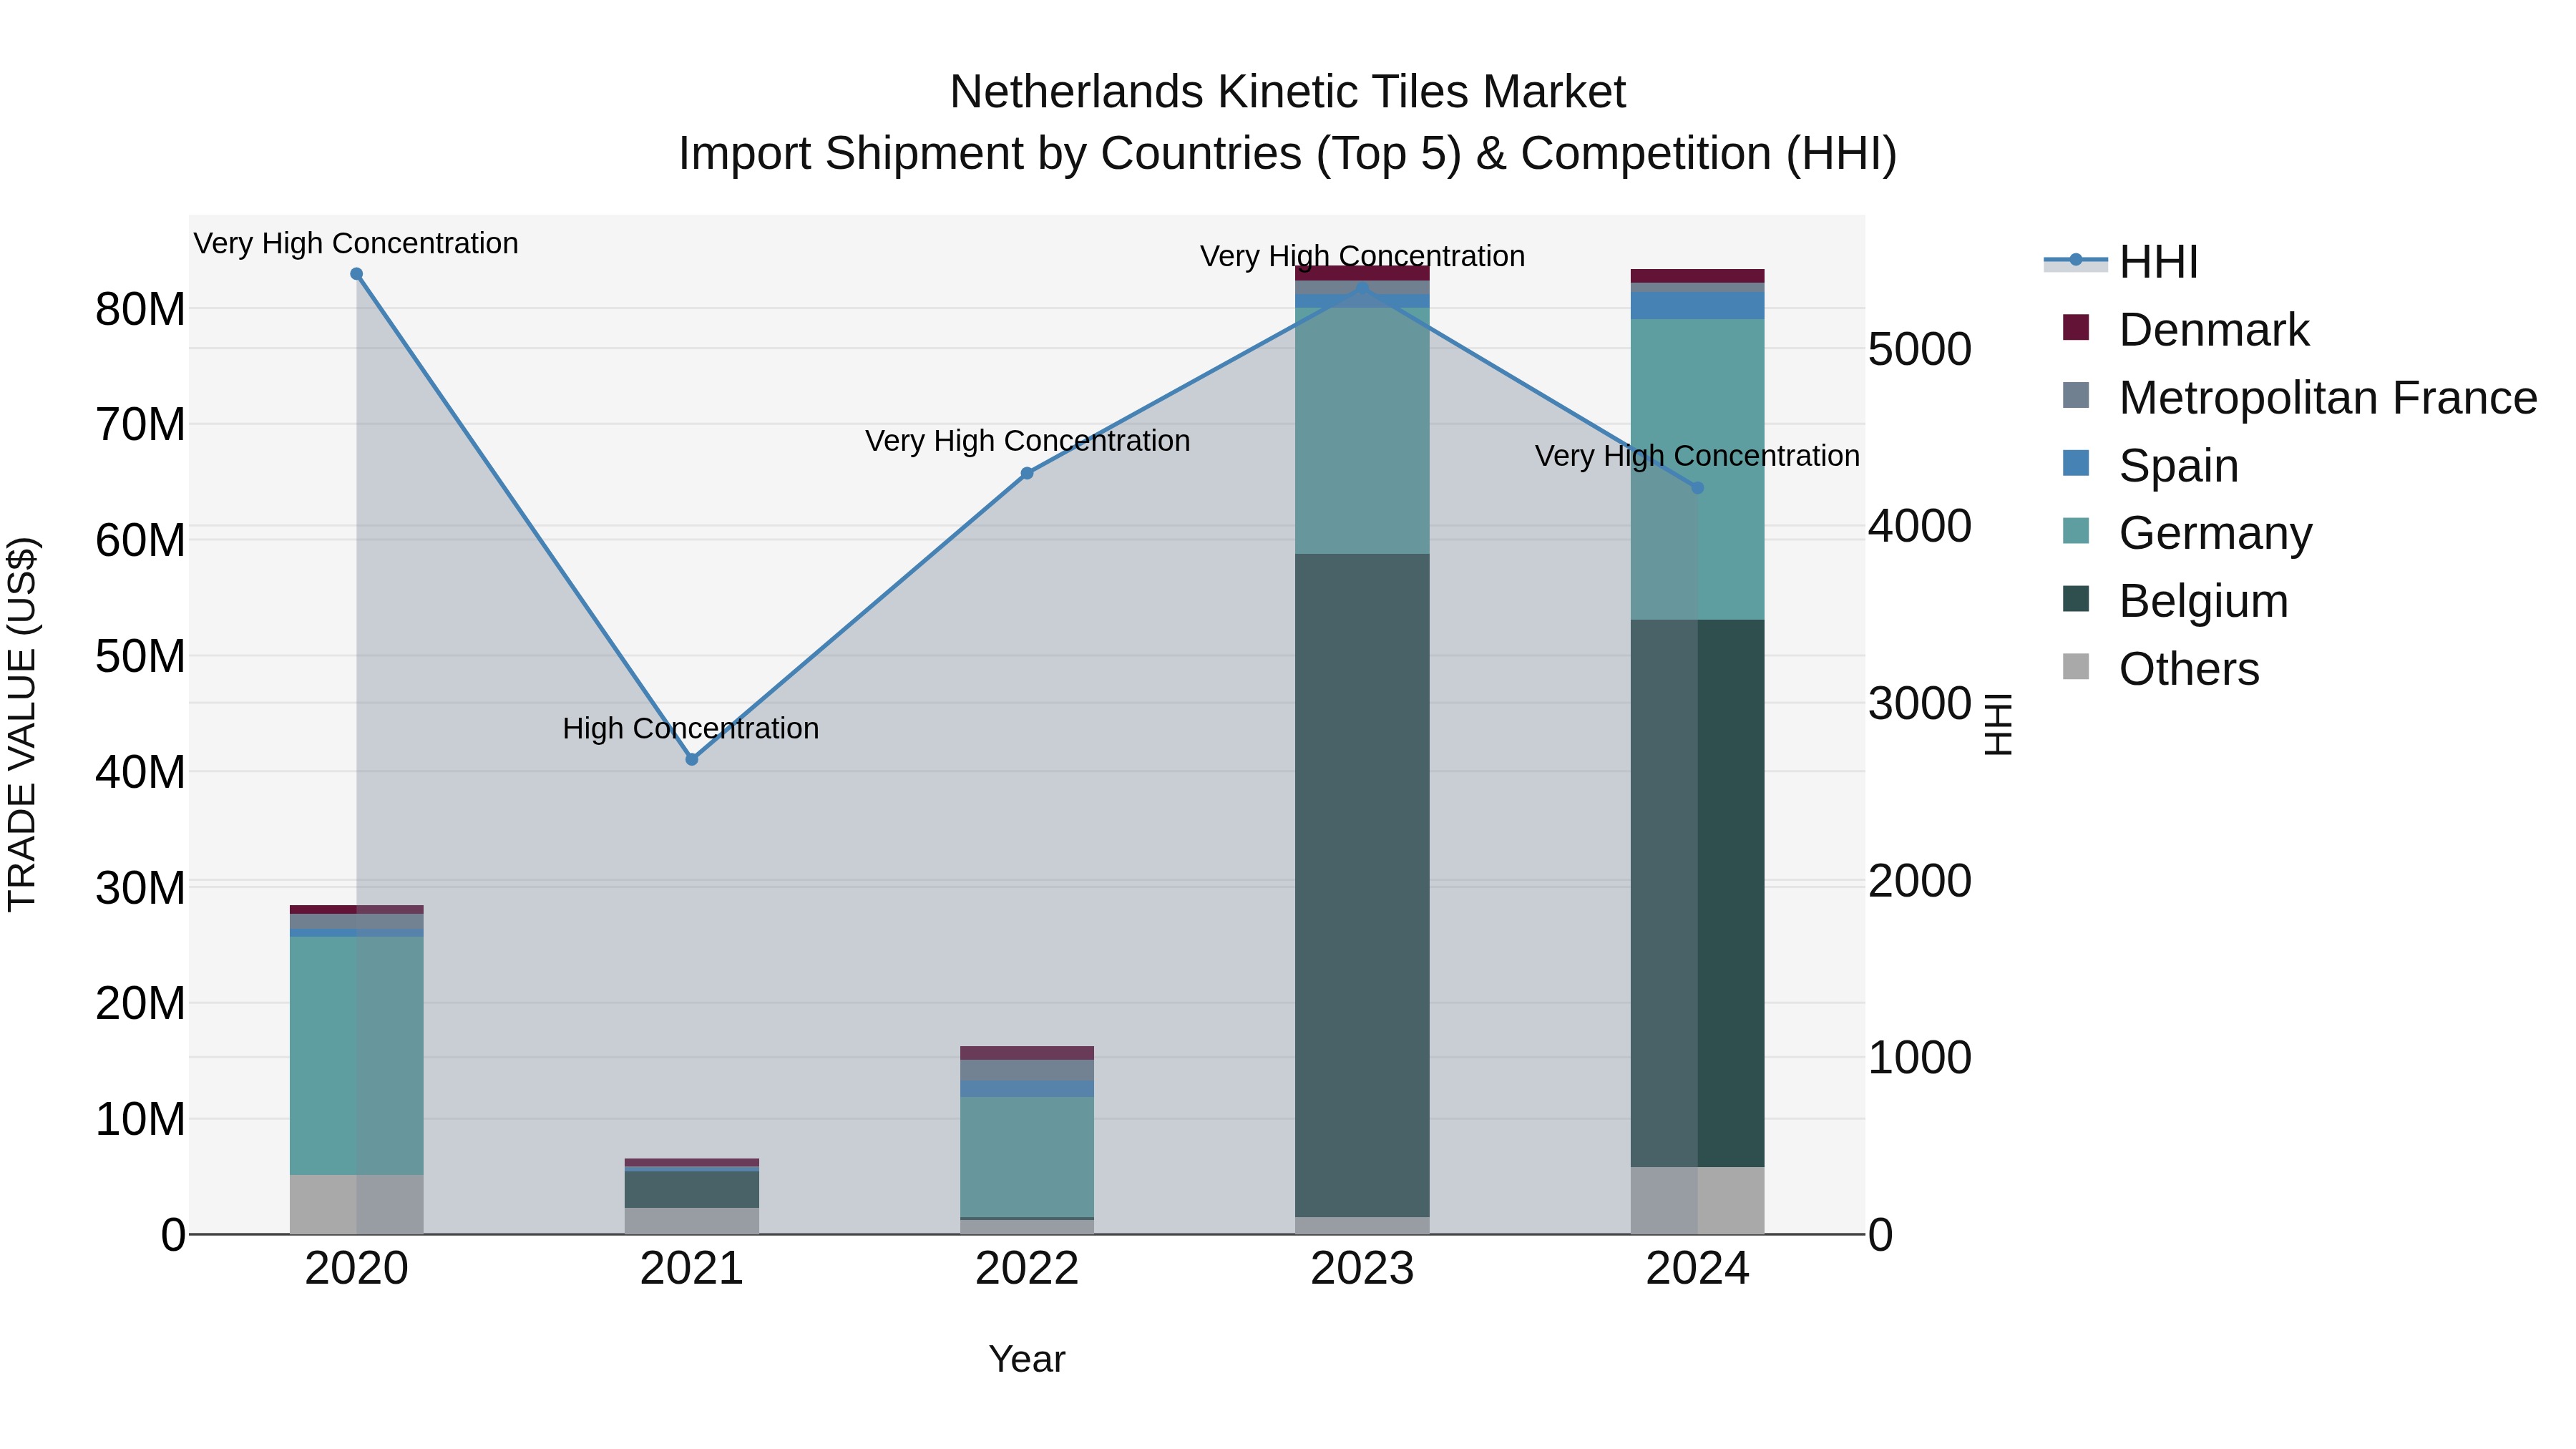
Netherlands Kinetic Tiles Market Top 5 Importing Countries and Market Competition (HHI) Analysis
In 2024, the Netherlands continued to see a significant influx of kinetic tiles imports, primarily from neighboring countries such as Belgium, Germany, and Poland, as well as Spain and Italy. Despite the diversity in exporting countries, the market remained highly concentrated, with a very high HHI indicating a dominant presence of key players. The impressive compound annual growth rate (CAGR) of 30.87% from 2020 to 2024 highlights the growing demand for kinetic tiles in the Netherlands. However, a slight decline in growth rate from 2023 to 2024 suggests a potential stabilization or adjustment phase in the market.
Netherlands Kinetic Tiles Market Overview
The Netherlands kinetic tiles market is experiencing steady growth driven by increasing focus on sustainable infrastructure and renewable energy sources. Kinetic tiles, which harness energy from footsteps and convert it into electricity, are gaining popularity as a clean energy solution in urban areas. The government`s initiatives to promote renewable energy and smart city development are also contributing to the market growth. Key players in the Netherlands kinetic tiles market include Pavegen and Energy Floors, among others, who are innovating to improve efficiency and durability of kinetic tiles. With a strong emphasis on sustainability and environmental consciousness in the country, the demand for kinetic tiles is expected to continue to rise, particularly in high-traffic urban areas and public spaces.
Netherlands Kinetic Tiles Market Trends
The Netherlands kinetic tiles market is experiencing a growing trend towards sustainable energy solutions and smart infrastructure. Kinetic tiles, which generate electricity through the movement of people, are being increasingly adopted in public spaces, pedestrian walkways, and transportation hubs. This is driven by the country`s focus on renewable energy and sustainability goals, as well as the increasing awareness of the potential of kinetic energy as a clean power source. Additionally, advancements in technology have made kinetic tiles more efficient and cost-effective, further fueling their popularity in urban environments. The market is also witnessing collaborations between technology companies, urban planners, and government bodies to integrate kinetic tiles into smart city initiatives, indicating a strong potential for growth in the coming years.
Netherlands Kinetic Tiles Market Challenges
In the Netherlands kinetic tiles market, some challenges include high initial costs of installation, limited awareness among consumers about the technology, and the need for significant infrastructure changes to accommodate these tiles. The upfront investment required for kinetic tiles can be a barrier for many potential users, especially in a market where cost-effectiveness and return on investment are key considerations. Additionally, the lack of awareness about the benefits and functionality of kinetic tiles among the general population hinders their adoption. Furthermore, integrating kinetic tiles into existing infrastructure, such as roads or sidewalks, requires careful planning and coordination, which can pose logistical challenges. Overcoming these obstacles will require concerted efforts from industry stakeholders to educate consumers, reduce costs, and streamline installation processes.
Netherlands Kinetic Tiles Market Investment Opportunities
In the Netherlands, the kinetic tiles market offers promising investment opportunities due to the increasing focus on sustainable energy solutions and smart infrastructure. Kinetic tiles generate electricity through the movement of pedestrians, making them an innovative and eco-friendly way to harness energy in urban areas. Investing in companies involved in the development, manufacturing, and installation of kinetic tiles can be lucrative as urban spaces continue to prioritize sustainability and renewable energy sources. Additionally, with the Netherlands being known for its commitment to green initiatives, there is a growing demand for innovative technologies like kinetic tiles, presenting a favorable environment for investors looking to capitalize on the sustainable energy sector.
Netherlands Kinetic Tiles Market Government Policy
The Netherlands government has been actively promoting sustainable energy initiatives, including the use of kinetic tiles for renewable energy generation. Various policies and incentives are in place to support the development and implementation of kinetic tiles in public spaces and infrastructure projects. These policies include subsidies, tax incentives, and regulations that encourage the integration of innovative energy solutions like kinetic tiles. Additionally, the government has set ambitious targets for increasing renewable energy production, which further drives the demand for technologies such as kinetic tiles. Overall, the Netherlands government`s support and favorable policies create a conducive environment for the growth of the kinetic tiles market in the country.
Netherlands Kinetic Tiles Market Future Outlook
The Netherlands kinetic tiles market is poised for significant growth in the coming years due to increasing emphasis on sustainable infrastructure and smart city initiatives. Kinetic tiles, which harvest energy from footsteps, are gaining popularity as a clean energy solution in urban areas. The Dutch government`s commitment to reducing carbon emissions and promoting renewable energy sources will drive the demand for kinetic tiles in public spaces, sidewalks, and commercial buildings. Technological advancements, such as improved durability and efficiency of kinetic tiles, are also expected to fuel market growth. With a strong focus on innovation and sustainability, the Netherlands is likely to see a surge in installations of kinetic tiles, contributing to the country`s transition towards a greener future.
Key Highlights of the Report:
- Netherlands Kinetic Tiles Market Outlook
- Market Size of Netherlands Kinetic Tiles Market,2024
- Forecast of Netherlands Kinetic Tiles Market, 2031
- Historical Data and Forecast of Netherlands Kinetic Tiles Revenues & Volume for the Period 2021-2031
- Netherlands Kinetic Tiles Market Trend Evolution
- Netherlands Kinetic Tiles Market Drivers and Challenges
- Netherlands Kinetic Tiles Price Trends
- Netherlands Kinetic Tiles Porter's Five Forces
- Netherlands Kinetic Tiles Industry Life Cycle
- Historical Data and Forecast of Netherlands Kinetic Tiles Market Revenues & Volume By Application for the Period 2021-2031
- Historical Data and Forecast of Netherlands Kinetic Tiles Market Revenues & Volume By Smart Buildings for the Period 2021-2031
- Historical Data and Forecast of Netherlands Kinetic Tiles Market Revenues & Volume By Public Infrastructure for the Period 2021-2031
- Historical Data and Forecast of Netherlands Kinetic Tiles Market Revenues & Volume By Sports Facilities for the Period 2021-2031
- Historical Data and Forecast of Netherlands Kinetic Tiles Market Revenues & Volume By Type for the Period 2021-2031
- Historical Data and Forecast of Netherlands Kinetic Tiles Market Revenues & Volume By Piezoelectric Tiles for the Period 2021-2031
- Historical Data and Forecast of Netherlands Kinetic Tiles Market Revenues & Volume By Electromagnetic Tiles for the Period 2021-2031
- Historical Data and Forecast of Netherlands Kinetic Tiles Market Revenues & Volume By End User for the Period 2021-2031
- Historical Data and Forecast of Netherlands Kinetic Tiles Market Revenues & Volume By Commercial Sector for the Period 2021-2031
- Historical Data and Forecast of Netherlands Kinetic Tiles Market Revenues & Volume By Residential Sector for the Period 2021-2031
- Historical Data and Forecast of Netherlands Kinetic Tiles Market Revenues & Volume By Industrial Sector for the Period 2021-2031
- Historical Data and Forecast of Netherlands Kinetic Tiles Market Revenues & Volume By Technology for the Period 2021-2031
- Historical Data and Forecast of Netherlands Kinetic Tiles Market Revenues & Volume By Kinetic Energy Harvesting for the Period 2021-2031
- Historical Data and Forecast of Netherlands Kinetic Tiles Market Revenues & Volume By Piezoelectric Technology for the Period 2021-2031
- Netherlands Kinetic Tiles Import Export Trade Statistics
- Market Opportunity Assessment By Application
- Market Opportunity Assessment By Type
- Market Opportunity Assessment By End User
- Market Opportunity Assessment By Technology
- Netherlands Kinetic Tiles Top Companies Market Share
- Netherlands Kinetic Tiles Competitive Benchmarking By Technical and Operational Parameters
- Netherlands Kinetic Tiles Company Profiles
- Netherlands Kinetic Tiles Key Strategic Recommendations
Frequently Asked Questions About the Market Study (FAQs):
6Wresearch actively monitors the Netherlands Kinetic Tiles Market and publishes its comprehensive annual report, highlighting emerging trends, growth drivers, revenue analysis, and forecast outlook. Our insights help businesses to make data-backed strategic decisions with ongoing market dynamics. Our analysts track relevent industries related to the Netherlands Kinetic Tiles Market, allowing our clients with actionable intelligence and reliable forecasts tailored to emerging regional needs.
Yes, we provide customisation as per your requirements. To learn more, feel free to contact us on sales@6wresearch.com
1 Executive Summary |
2 Introduction |
2.1 Key Highlights of the Report |
2.2 Report Description |
2.3 Market Scope & Segmentation |
2.4 Research Methodology |
2.5 Assumptions |
3 Netherlands Kinetic Tiles Market Overview |
3.1 Netherlands Country Macro Economic Indicators |
3.2 Netherlands Kinetic Tiles Market Revenues & Volume, 2021 & 2031F |
3.3 Netherlands Kinetic Tiles Market - Industry Life Cycle |
3.4 Netherlands Kinetic Tiles Market - Porter's Five Forces |
3.5 Netherlands Kinetic Tiles Market Revenues & Volume Share, By Application, 2021 & 2031F |
3.6 Netherlands Kinetic Tiles Market Revenues & Volume Share, By Type, 2021 & 2031F |
3.7 Netherlands Kinetic Tiles Market Revenues & Volume Share, By End User, 2021 & 2031F |
3.8 Netherlands Kinetic Tiles Market Revenues & Volume Share, By Technology, 2021 & 2031F |
4 Netherlands Kinetic Tiles Market Dynamics |
4.1 Impact Analysis |
4.2 Market Drivers |
4.2.1 Increasing focus on sustainable energy solutions in the Netherlands |
4.2.2 Growing awareness about the benefits of kinetic tiles in generating clean energy |
4.2.3 Government initiatives and subsidies to promote renewable energy sources |
4.3 Market Restraints |
4.3.1 High initial installation costs of kinetic tiles |
4.3.2 Limited technological advancements leading to efficiency and durability concerns |
4.3.3 Lack of widespread adoption and awareness among consumers and businesses |
5 Netherlands Kinetic Tiles Market Trends |
6 Netherlands Kinetic Tiles Market, By Types |
6.1 Netherlands Kinetic Tiles Market, By Application |
6.1.1 Overview and Analysis |
6.1.2 Netherlands Kinetic Tiles Market Revenues & Volume, By Application, 2021 - 2031F |
6.1.3 Netherlands Kinetic Tiles Market Revenues & Volume, By Smart Buildings, 2021 - 2031F |
6.1.4 Netherlands Kinetic Tiles Market Revenues & Volume, By Public Infrastructure, 2021 - 2031F |
6.1.5 Netherlands Kinetic Tiles Market Revenues & Volume, By Sports Facilities, 2021 - 2031F |
6.2 Netherlands Kinetic Tiles Market, By Type |
6.2.1 Overview and Analysis |
6.2.2 Netherlands Kinetic Tiles Market Revenues & Volume, By Piezoelectric Tiles, 2021 - 2031F |
6.2.3 Netherlands Kinetic Tiles Market Revenues & Volume, By Electromagnetic Tiles, 2021 - 2031F |
6.3 Netherlands Kinetic Tiles Market, By End User |
6.3.1 Overview and Analysis |
6.3.2 Netherlands Kinetic Tiles Market Revenues & Volume, By Commercial Sector, 2021 - 2031F |
6.3.3 Netherlands Kinetic Tiles Market Revenues & Volume, By Residential Sector, 2021 - 2031F |
6.3.4 Netherlands Kinetic Tiles Market Revenues & Volume, By Industrial Sector, 2021 - 2031F |
6.4 Netherlands Kinetic Tiles Market, By Technology |
6.4.1 Overview and Analysis |
6.4.2 Netherlands Kinetic Tiles Market Revenues & Volume, By Kinetic Energy Harvesting, 2021 - 2031F |
6.4.3 Netherlands Kinetic Tiles Market Revenues & Volume, By Piezoelectric Technology, 2021 - 2031F |
7 Netherlands Kinetic Tiles Market Import-Export Trade Statistics |
7.1 Netherlands Kinetic Tiles Market Export to Major Countries |
7.2 Netherlands Kinetic Tiles Market Imports from Major Countries |
8 Netherlands Kinetic Tiles Market Key Performance Indicators |
8.1 Energy generation efficiency of kinetic tiles |
8.2 Number of government projects incorporating kinetic tiles |
8.3 Percentage increase in investments in renewable energy solutions in the Netherlands |
9 Netherlands Kinetic Tiles Market - Opportunity Assessment |
9.1 Netherlands Kinetic Tiles Market Opportunity Assessment, By Application, 2021 & 2031F |
9.2 Netherlands Kinetic Tiles Market Opportunity Assessment, By Type, 2021 & 2031F |
9.3 Netherlands Kinetic Tiles Market Opportunity Assessment, By End User, 2021 & 2031F |
9.4 Netherlands Kinetic Tiles Market Opportunity Assessment, By Technology, 2021 & 2031F |
10 Netherlands Kinetic Tiles Market - Competitive Landscape |
10.1 Netherlands Kinetic Tiles Market Revenue Share, By Companies, 2024 |
10.2 Netherlands Kinetic Tiles Market Competitive Benchmarking, By Operating and Technical Parameters |
11 Company Profiles |
12 Recommendations |
13 Disclaimer |
Global Go To Market Strategy - 2030
Export potential enables firms to identify high-growth global markets with greater confidence by combining advanced trade intelligence with a structured quantitative methodology. The framework analyzes emerging demand trends and country-level import patterns while integrating macroeconomic and trade datasets such as GDP and population forecasts, bilateral import–export flows, tariff structures, elasticity differentials between developed and developing economies, geographic distance, and import demand projections. Using weighted trade values from 2020–2024 as the base period to project country-to-country export potential for 2030, these inputs are operationalized through calculated drivers such as gravity model parameters, tariff impact factors, and projected GDP per-capita growth. Through an analysis of hidden potentials, demand hotspots, and market conditions that are most favorable to success, this method enables firms to focus on target countries, maximize returns, and global expansion with data, backed by accuracy.
By factoring in the projected importer demand gap that is currently unmet and could be potential opportunity, it identifies the potential for the Exporter (Country) among 190 countries, against the general trade analysis, which identifies the biggest importer or exporter.
To discover high-growth global markets and optimize your business strategy:
Click Here
Pricing
- Single User License$ 1,995
- Department License$ 2,400
- Site License$ 3,120
- Global License$ 3,795

Leadership Perspectives from Industry Events
Search
Thought Leadership and Analyst Meet


Our Clients
6WResearch In News
- India Export Attractiveness Tracker 2026
- India Air Conditioner Market Set for Strong Rebound in 2026 After Weather-Led Correction and GST-Driven Recovery: 6Wresearch
- ADAS in India: How Automatic Emergency Braking, Blind Spot Detection & Driver Monitoring are Transforming Road Safety
- Doha a strategic location for EV manufacturing hub: IPA Qatar
- Demand for luxury TVs surging in the GCC, says Samsung
- Empowering Growth: The Thriving Journey of Bangladesh’s Cable Industry
Latest Reports
- Nicaragua RPG Gaming Market (2026-2032)
- New Zealand RPG Gaming Market (2026-2032)
- Netherlands RPG Gaming Market (2026-2032)
- Nauru RPG Gaming Market (2026-2032)
- Namibia RPG Gaming Market (2026-2032)
- Mozambique RPG Gaming Market (2026-2032)
- Montenegro RPG Gaming Market (2026-2032)
- Mongolia RPG Gaming Market (2026-2032)
- Monaco RPG Gaming Market (2026-2032)
- Micronesia RPG Gaming Market (2026-2032)
Industry Events and Analyst Meet

EV India Expo 2026

HIMTEX 2026

India Refining Summit 2026

India EV Show 2026

EV tech India Expo 2026
Whitepaper
- Middle East & Africa Commercial Security Market Click here to view more.
- Middle East & Africa Fire Safety Systems & Equipment Market Click here to view more.
- GCC Drone Market Click here to view more.
- Middle East Lighting Fixture Market Click here to view more.
- GCC Physical & Perimeter Security Market Click here to view more.