Netherlands Power Plant Uranium Market (2026-2032) | Drivers, Segmentation, Demand, Competition, Share, Value, Competitive, Supply, Strategy, Outlook, Trends, Forecast, Segments, Pricing Analysis, Revenue, Analysis, Strategic Insights, Investment Trends, Growth, Companies, Opportunities, Industry, Size, Challenges, Restraints, Consumer Insights
Market Forecast By Type (Natural Uranium, Enriched Uranium, Depleted Uranium, Uranium Oxide (U3O8), Others), By Processing Stage (Mining & Extraction, Refining & Enrichment, Waste Processing, Fuel Fabrication, Storage & Disposal), By Reactor Type (Pressurized Water Reactor (PWR), Boiling Water Reactor (BWR), Fast Breeder Reactor (FBR), Heavy Water Reactor (HWR), Molten Salt Reactor (MSR)), By End-Use (Nuclear Power, Energy Utilities, Research, Defense Applications, Aerospace) And Competitive Landscape
| Product Code: ETC10165452 | Publication Date: Apr 2025 | Updated Date: Apr 2026 | Product Type: Market Research Report | |
| Publisher: 6Wresearch | Author: Bhawna Singh | No. of Pages: 65 | No. of Figures: 34 | No. of Tables: 19 |
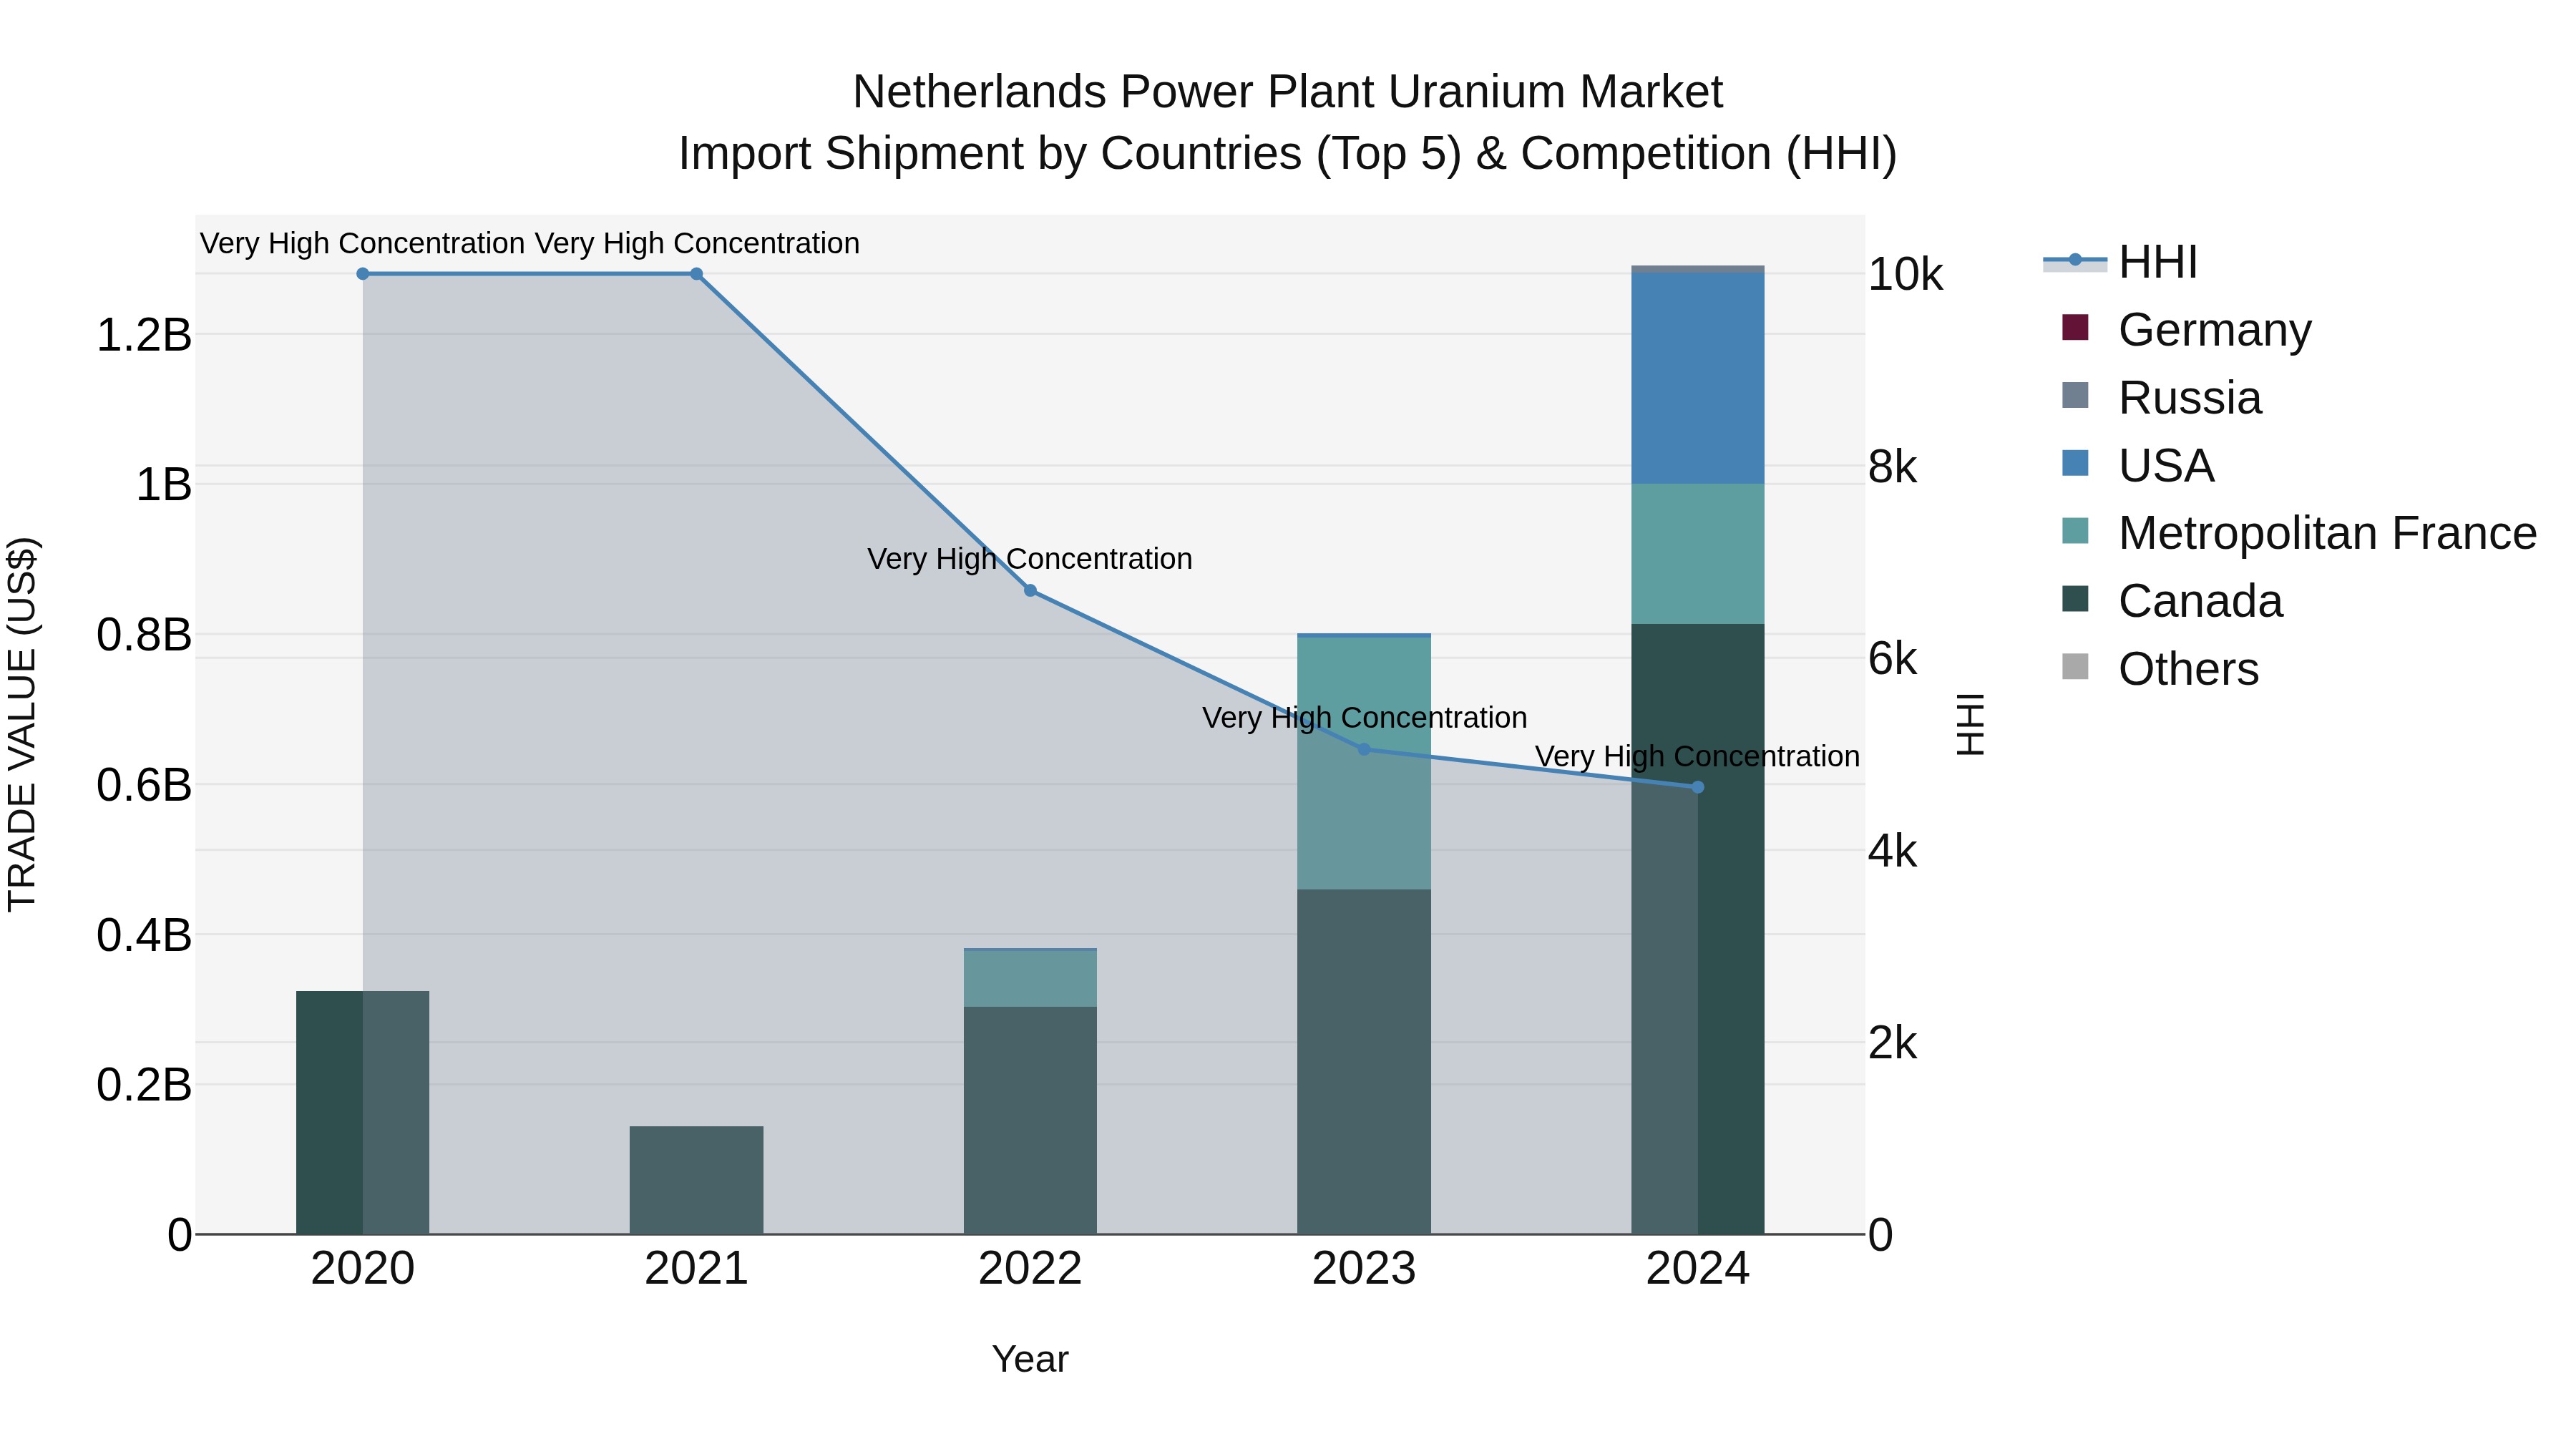
Netherlands Power Plant Uranium Market Top 5 Importing Countries and Market Competition (HHI) Analysis
The Netherlands power plant uranium import shipments in 2024 continued to showcase a high concentration of suppliers, with top countries such as Canada, USA, Metropolitan France, Russia, and Croatia dominating the market. The industry saw an impressive Compound Annual Growth Rate (CAGR) of 41.22% from 2020 to 2024, indicating robust expansion. Furthermore, the growth rate in 2024 spiked significantly by 61.16% compared to the previous year, reflecting a sharp upward trend in uranium imports for the Dutch power sector. This data underscores the growing importance of these key uranium exporting countries in meeting the Netherlands` energy needs.
Key Highlights of the Report:
- Netherlands Power Plant Uranium Market Outlook
- Market Size of Netherlands Power Plant Uranium Market, 2025
- Forecast of Netherlands Power Plant Uranium Market, 2032
- Historical Data and Forecast of Netherlands Power Plant Uranium Revenues & Volume for the Period 2022 - 2032F
- Netherlands Power Plant Uranium Market Trend Evolution
- Netherlands Power Plant Uranium Market Drivers and Challenges
- Netherlands Power Plant Uranium Price Trends
- Netherlands Power Plant Uranium Porter's Five Forces
- Netherlands Power Plant Uranium Industry Life Cycle
- Historical Data and Forecast of Netherlands Power Plant Uranium Market Revenues & Volume By Type for the Period 2022 - 2032F
- Historical Data and Forecast of Netherlands Power Plant Uranium Market Revenues & Volume By Natural Uranium for the Period 2022 - 2032F
- Historical Data and Forecast of Netherlands Power Plant Uranium Market Revenues & Volume By Enriched Uranium for the Period 2022 - 2032F
- Historical Data and Forecast of Netherlands Power Plant Uranium Market Revenues & Volume By Depleted Uranium for the Period 2022 - 2032F
- Historical Data and Forecast of Netherlands Power Plant Uranium Market Revenues & Volume By Uranium Oxide (U3O8) for the Period 2022 - 2032F
- Historical Data and Forecast of Netherlands Power Plant Uranium Market Revenues & Volume By Others for the Period 2022 - 2032F
- Historical Data and Forecast of Netherlands Power Plant Uranium Market Revenues & Volume By Processing Stage for the Period 2022 - 2032F
- Historical Data and Forecast of Netherlands Power Plant Uranium Market Revenues & Volume By Mining & Extraction for the Period 2022 - 2032F
- Historical Data and Forecast of Netherlands Power Plant Uranium Market Revenues & Volume By Refining & Enrichment for the Period 2022 - 2032F
- Historical Data and Forecast of Netherlands Power Plant Uranium Market Revenues & Volume By Waste Processing for the Period 2022 - 2032F
- Historical Data and Forecast of Netherlands Power Plant Uranium Market Revenues & Volume By Fuel Fabrication for the Period 2022 - 2032F
- Historical Data and Forecast of Netherlands Power Plant Uranium Market Revenues & Volume By Storage & Disposal for the Period 2022 - 2032F
- Historical Data and Forecast of Netherlands Power Plant Uranium Market Revenues & Volume By Reactor Type for the Period 2022 - 2032F
- Historical Data and Forecast of Netherlands Power Plant Uranium Market Revenues & Volume By Pressurized Water Reactor (PWR) for the Period 2022 - 2032F
- Historical Data and Forecast of Netherlands Power Plant Uranium Market Revenues & Volume By Boiling Water Reactor (BWR) for the Period 2022 - 2032F
- Historical Data and Forecast of Netherlands Power Plant Uranium Market Revenues & Volume By Fast Breeder Reactor (FBR) for the Period 2022 - 2032F
- Historical Data and Forecast of Netherlands Power Plant Uranium Market Revenues & Volume By Heavy Water Reactor (HWR) for the Period 2022 - 2032F
- Historical Data and Forecast of Netherlands Power Plant Uranium Market Revenues & Volume By Molten Salt Reactor (MSR) for the Period 2022 - 2032F
- Historical Data and Forecast of Netherlands Power Plant Uranium Market Revenues & Volume By End-Use for the Period 2022 - 2032F
- Historical Data and Forecast of Netherlands Power Plant Uranium Market Revenues & Volume By Nuclear Power for the Period 2022 - 2032F
- Historical Data and Forecast of Netherlands Power Plant Uranium Market Revenues & Volume By Energy Utilities for the Period 2022 - 2032F
- Historical Data and Forecast of Netherlands Power Plant Uranium Market Revenues & Volume By Research for the Period 2022 - 2032F
- Historical Data and Forecast of Netherlands Power Plant Uranium Market Revenues & Volume By Defense Applications for the Period 2022 - 2032F
- Historical Data and Forecast of Netherlands Power Plant Uranium Market Revenues & Volume By Aerospace for the Period 2022 - 2032F
- Netherlands Power Plant Uranium Import Export Trade Statistics
- Market Opportunity Assessment By Type
- Market Opportunity Assessment By Processing Stage
- Market Opportunity Assessment By Reactor Type
- Market Opportunity Assessment By End-Use
- Netherlands Power Plant Uranium Top Companies Market Share
- Netherlands Power Plant Uranium Competitive Benchmarking By Technical and Operational Parameters
- Netherlands Power Plant Uranium Company Profiles
- Netherlands Power Plant Uranium Key Strategic Recommendations
Frequently Asked Questions About the Market Study (FAQs):
6Wresearch actively monitors the Netherlands Power Plant Uranium Market and publishes its comprehensive annual report, highlighting emerging trends, growth drivers, revenue analysis, and forecast outlook. Our insights help businesses to make data-backed strategic decisions with ongoing market dynamics. Our analysts track relevent industries related to the Netherlands Power Plant Uranium Market, allowing our clients with actionable intelligence and reliable forecasts tailored to emerging regional needs.
Yes, we provide customisation as per your requirements. To learn more, feel free to contact us on sales@6wresearch.com
1 Executive Summary |
2 Introduction |
2.1 Key Highlights of the Report |
2.2 Report Description |
2.3 Market Scope & Segmentation |
2.4 Research Methodology |
2.5 Assumptions |
3 Netherlands Power Plant Uranium Market Overview |
3.1 Netherlands Country Macro Economic Indicators |
3.2 Netherlands Power Plant Uranium Market Revenues & Volume, 2022 & 2032F |
3.3 Netherlands Power Plant Uranium Market - Industry Life Cycle |
3.4 Netherlands Power Plant Uranium Market - Porter's Five Forces |
3.5 Netherlands Power Plant Uranium Market Revenues & Volume Share, By Type, 2022 & 2032F |
3.6 Netherlands Power Plant Uranium Market Revenues & Volume Share, By Processing Stage, 2022 & 2032F |
3.7 Netherlands Power Plant Uranium Market Revenues & Volume Share, By Reactor Type, 2022 & 2032F |
3.8 Netherlands Power Plant Uranium Market Revenues & Volume Share, By End-Use, 2022 & 2032F |
4 Netherlands Power Plant Uranium Market Dynamics |
4.1 Impact Analysis |
4.2 Market Drivers |
4.2.1 Increasing energy demand in the Netherlands |
4.2.2 Government support and incentives for nuclear power generation |
4.2.3 Focus on reducing carbon emissions and transitioning to cleaner energy sources |
4.3 Market Restraints |
4.3.1 Stringent regulations and licensing requirements for nuclear power plants |
4.3.2 Public concerns about nuclear energy safety and waste management |
4.3.3 Competition from alternative energy sources such as renewables |
5 Netherlands Power Plant Uranium Market Trends |
6 Netherlands Power Plant Uranium Market, By Types |
6.1 Netherlands Power Plant Uranium Market, By Type |
6.1.1 Overview and Analysis |
6.1.2 Netherlands Power Plant Uranium Market Revenues & Volume, By Type, 2022 - 2032F |
6.1.3 Netherlands Power Plant Uranium Market Revenues & Volume, By Natural Uranium, 2022 - 2032F |
6.1.4 Netherlands Power Plant Uranium Market Revenues & Volume, By Enriched Uranium, 2022 - 2032F |
6.1.5 Netherlands Power Plant Uranium Market Revenues & Volume, By Depleted Uranium, 2022 - 2032F |
6.1.6 Netherlands Power Plant Uranium Market Revenues & Volume, By Uranium Oxide (U3O8), 2022 - 2032F |
6.1.7 Netherlands Power Plant Uranium Market Revenues & Volume, By Others, 2022 - 2032F |
6.2 Netherlands Power Plant Uranium Market, By Processing Stage |
6.2.1 Overview and Analysis |
6.2.2 Netherlands Power Plant Uranium Market Revenues & Volume, By Mining & Extraction, 2022 - 2032F |
6.2.3 Netherlands Power Plant Uranium Market Revenues & Volume, By Refining & Enrichment, 2022 - 2032F |
6.2.4 Netherlands Power Plant Uranium Market Revenues & Volume, By Waste Processing, 2022 - 2032F |
6.2.5 Netherlands Power Plant Uranium Market Revenues & Volume, By Fuel Fabrication, 2022 - 2032F |
6.2.6 Netherlands Power Plant Uranium Market Revenues & Volume, By Storage & Disposal, 2022 - 2032F |
6.3 Netherlands Power Plant Uranium Market, By Reactor Type |
6.3.1 Overview and Analysis |
6.3.2 Netherlands Power Plant Uranium Market Revenues & Volume, By Pressurized Water Reactor (PWR), 2022 - 2032F |
6.3.3 Netherlands Power Plant Uranium Market Revenues & Volume, By Boiling Water Reactor (BWR), 2022 - 2032F |
6.3.4 Netherlands Power Plant Uranium Market Revenues & Volume, By Fast Breeder Reactor (FBR), 2022 - 2032F |
6.3.5 Netherlands Power Plant Uranium Market Revenues & Volume, By Heavy Water Reactor (HWR), 2022 - 2032F |
6.3.6 Netherlands Power Plant Uranium Market Revenues & Volume, By Molten Salt Reactor (MSR), 2022 - 2032F |
6.4 Netherlands Power Plant Uranium Market, By End-Use |
6.4.1 Overview and Analysis |
6.4.2 Netherlands Power Plant Uranium Market Revenues & Volume, By Nuclear Power, 2022 - 2032F |
6.4.3 Netherlands Power Plant Uranium Market Revenues & Volume, By Energy Utilities, 2022 - 2032F |
6.4.4 Netherlands Power Plant Uranium Market Revenues & Volume, By Research, 2022 - 2032F |
6.4.5 Netherlands Power Plant Uranium Market Revenues & Volume, By Defense Applications, 2022 - 2032F |
6.4.6 Netherlands Power Plant Uranium Market Revenues & Volume, By Aerospace, 2022 - 2032F |
7 Netherlands Power Plant Uranium Market Import-Export Trade Statistics |
7.1 Netherlands Power Plant Uranium Market Export to Major Countries |
7.2 Netherlands Power Plant Uranium Market Imports from Major Countries |
8 Netherlands Power Plant Uranium Market Key Performance Indicators |
8.1 Average capacity factor of nuclear power plants in the Netherlands |
8.2 Investment in nuclear power infrastructure and technology |
8.3 Regulatory approvals for new nuclear power projects |
8.4 Uranium market price trends |
8.5 Number of nuclear power plant outages due to maintenance or safety issues |
9 Netherlands Power Plant Uranium Market - Opportunity Assessment |
9.1 Netherlands Power Plant Uranium Market Opportunity Assessment, By Type, 2022 & 2032F |
9.2 Netherlands Power Plant Uranium Market Opportunity Assessment, By Processing Stage, 2022 & 2032F |
9.3 Netherlands Power Plant Uranium Market Opportunity Assessment, By Reactor Type, 2022 & 2032F |
9.4 Netherlands Power Plant Uranium Market Opportunity Assessment, By End-Use, 2022 & 2032F |
10 Netherlands Power Plant Uranium Market - Competitive Landscape |
10.1 Netherlands Power Plant Uranium Market Revenue Share, By Companies, 2025 |
10.2 Netherlands Power Plant Uranium Market Competitive Benchmarking, By Operating and Technical Parameters |
11 Company Profiles |
12 Recommendations |
13 Disclaimer |
Export potential assessment - trade Analytics for 2030
Export potential enables firms to identify high-growth global markets with greater confidence by combining advanced trade intelligence with a structured quantitative methodology. The framework analyzes emerging demand trends and country-level import patterns while integrating macroeconomic and trade datasets such as GDP and population forecasts, bilateral import–export flows, tariff structures, elasticity differentials between developed and developing economies, geographic distance, and import demand projections. Using weighted trade values from 2020–2024 as the base period to project country-to-country export potential for 2030, these inputs are operationalized through calculated drivers such as gravity model parameters, tariff impact factors, and projected GDP per-capita growth. Through an analysis of hidden potentials, demand hotspots, and market conditions that are most favorable to success, this method enables firms to focus on target countries, maximize returns, and global expansion with data, backed by accuracy.
By factoring in the projected importer demand gap that is currently unmet and could be potential opportunity, it identifies the potential for the Exporter (Country) among 190 countries, against the general trade analysis, which identifies the biggest importer or exporter.
To discover high-growth global markets and optimize your business strategy:
Click Here
Pricing
- Single User License$ 1,995
- Department License$ 2,400
- Site License$ 3,120
- Global License$ 3,795

Search
Thought Leadership and Analyst Meet


Our Clients
Latest Reports
- India Ultrasonic Smart Water Meter Market (2026-2032) | Outlook, Competition, Drivers, Trends, Demand, Competitive, Strategic Insights, Companies, Challenges, Strategy, Consumer Insights, Analysis, Opportunities, Growth, Size, Share, Industry, Revenue, Segments, Value, Segmentation, Supply, Forecast, Restraints,
- India Electromagnetic Bulk Flow Meter Market (2026-2032) | Analysis, Challenges, Strategic Insights, Supply, Forecast, Growth, Share, Consumer Insights, Competitive, Value, Outlook, Size & Demand,
- India Battery Powered Bulk Flow Meter Market (2026-2032) | Outlook, Analysis, Competitive Landscape, Growth, Size, Trends, Value, Revenue, Companies, Segmentation, Share & Forecast
- Bosnia and Herzegovina Fuel-Efficient Winglets Market (2026-2032) | Growth, Competition, Strategy, Restraints, Trends, Challenges, segmentation, Value, Outlook, Investment Opportunities, Analysis, Revenue, Companies, Insights, Pricing, Size, Drivers, Demand, Share, Forecast
- Canada Cloud CFD Market (2026-2032) | Size & Revenue, Industry, Growth, Competitive Landscape, Forecast, Segmentation, Value, Outlook, Trends, Share, Analysis, Companies
- Taiwan Food Delivery Platform Market (2026-2032) | Companies, Outlook, Analysis, Trends, Value, Revenue, Segmentation, Share, Forecast, Competitive Landscape, Growth, Size & Forecast
- United Kingdom (UK) Long-term Care Insurance Market (2026-2032) | Growth, Share, Consumer Insights, Drivers, Opportunities, Competition, Pricing Analysis, Segments, Restraints, Companies, Competitive, Value, Outlook, Size, Demand, Analysis, Challenges, Strategic Insights, Investment Trends, Revenue, Trends, Supply, Forecast
- United Kingdom (UK) Long Term Care Market (2026-2032) | Companies, Outlook, Analysis, Trends, Value, Revenue, Segmentation, Share, Forecast, Competitive Landscape, Growth, Size & Forecast
- Iraq Insulation and Waterproofing Market (2026-2032) | Outlook, Drivers, Growth, Size, Share, Industry, Revenue, Trends, Demand, Competitive, Strategic Insights, Opportunities, Segments, Companies, Challenges, Strategy, Consumer Insights, Analysis, Investment Trends, Value, Segmentation, Forecast, Restraints
- India Switchgear Market Outlook (2026-2032) | Size, Share, Trends, Growth, Revenue, Forecast, Analysis, Value, Outlook
Industry Events and Analyst Meet

HIMTEX 2026

India Refining Summit 2026

India EV Show 2026

EV tech India Expo 2026

Auto Tech Asia 2026
Whitepaper
- Middle East & Africa Commercial Security Market Click here to view more.
- Middle East & Africa Fire Safety Systems & Equipment Market Click here to view more.
- GCC Drone Market Click here to view more.
- Middle East Lighting Fixture Market Click here to view more.
- GCC Physical & Perimeter Security Market Click here to view more.
6WResearch In News
- Doha a strategic location for EV manufacturing hub: IPA Qatar
- Demand for luxury TVs surging in the GCC, says Samsung
- Empowering Growth: The Thriving Journey of Bangladesh’s Cable Industry
- Demand for luxury TVs surging in the GCC, says Samsung
- Video call with a traditional healer? Once unthinkable, it’s now common in South Africa
- Intelligent Buildings To Smooth GCC’s Path To Net Zero