Niger Optical Spectrum Analyzer Market (2026-2032) | Industry, Value, Trends, Share, Companies, Segmentation, Growth, Outlook, Analysis, Competitive Landscape, Forecast, Size & Revenue
Market Forecast By Product Type (Portable, Benchtop, Handheld), By Mode Type (Spectrometer Mode, Wavelength Meter Mode), By End Use (IT & Telecommunication, Medical & Healthcare, Energy & Utilities, Automotive, Institutions, Aerospace & Defence, Semiconductors & Electronics) And Competitive Landscape
| Product Code: ETC8609549 | Publication Date: Sep 2024 | Updated Date: Apr 2026 | Product Type: Market Research Report | |
| Publisher: 6Wresearch | Author: Shubham Padhi | No. of Pages: 75 | No. of Figures: 35 | No. of Tables: 20 |
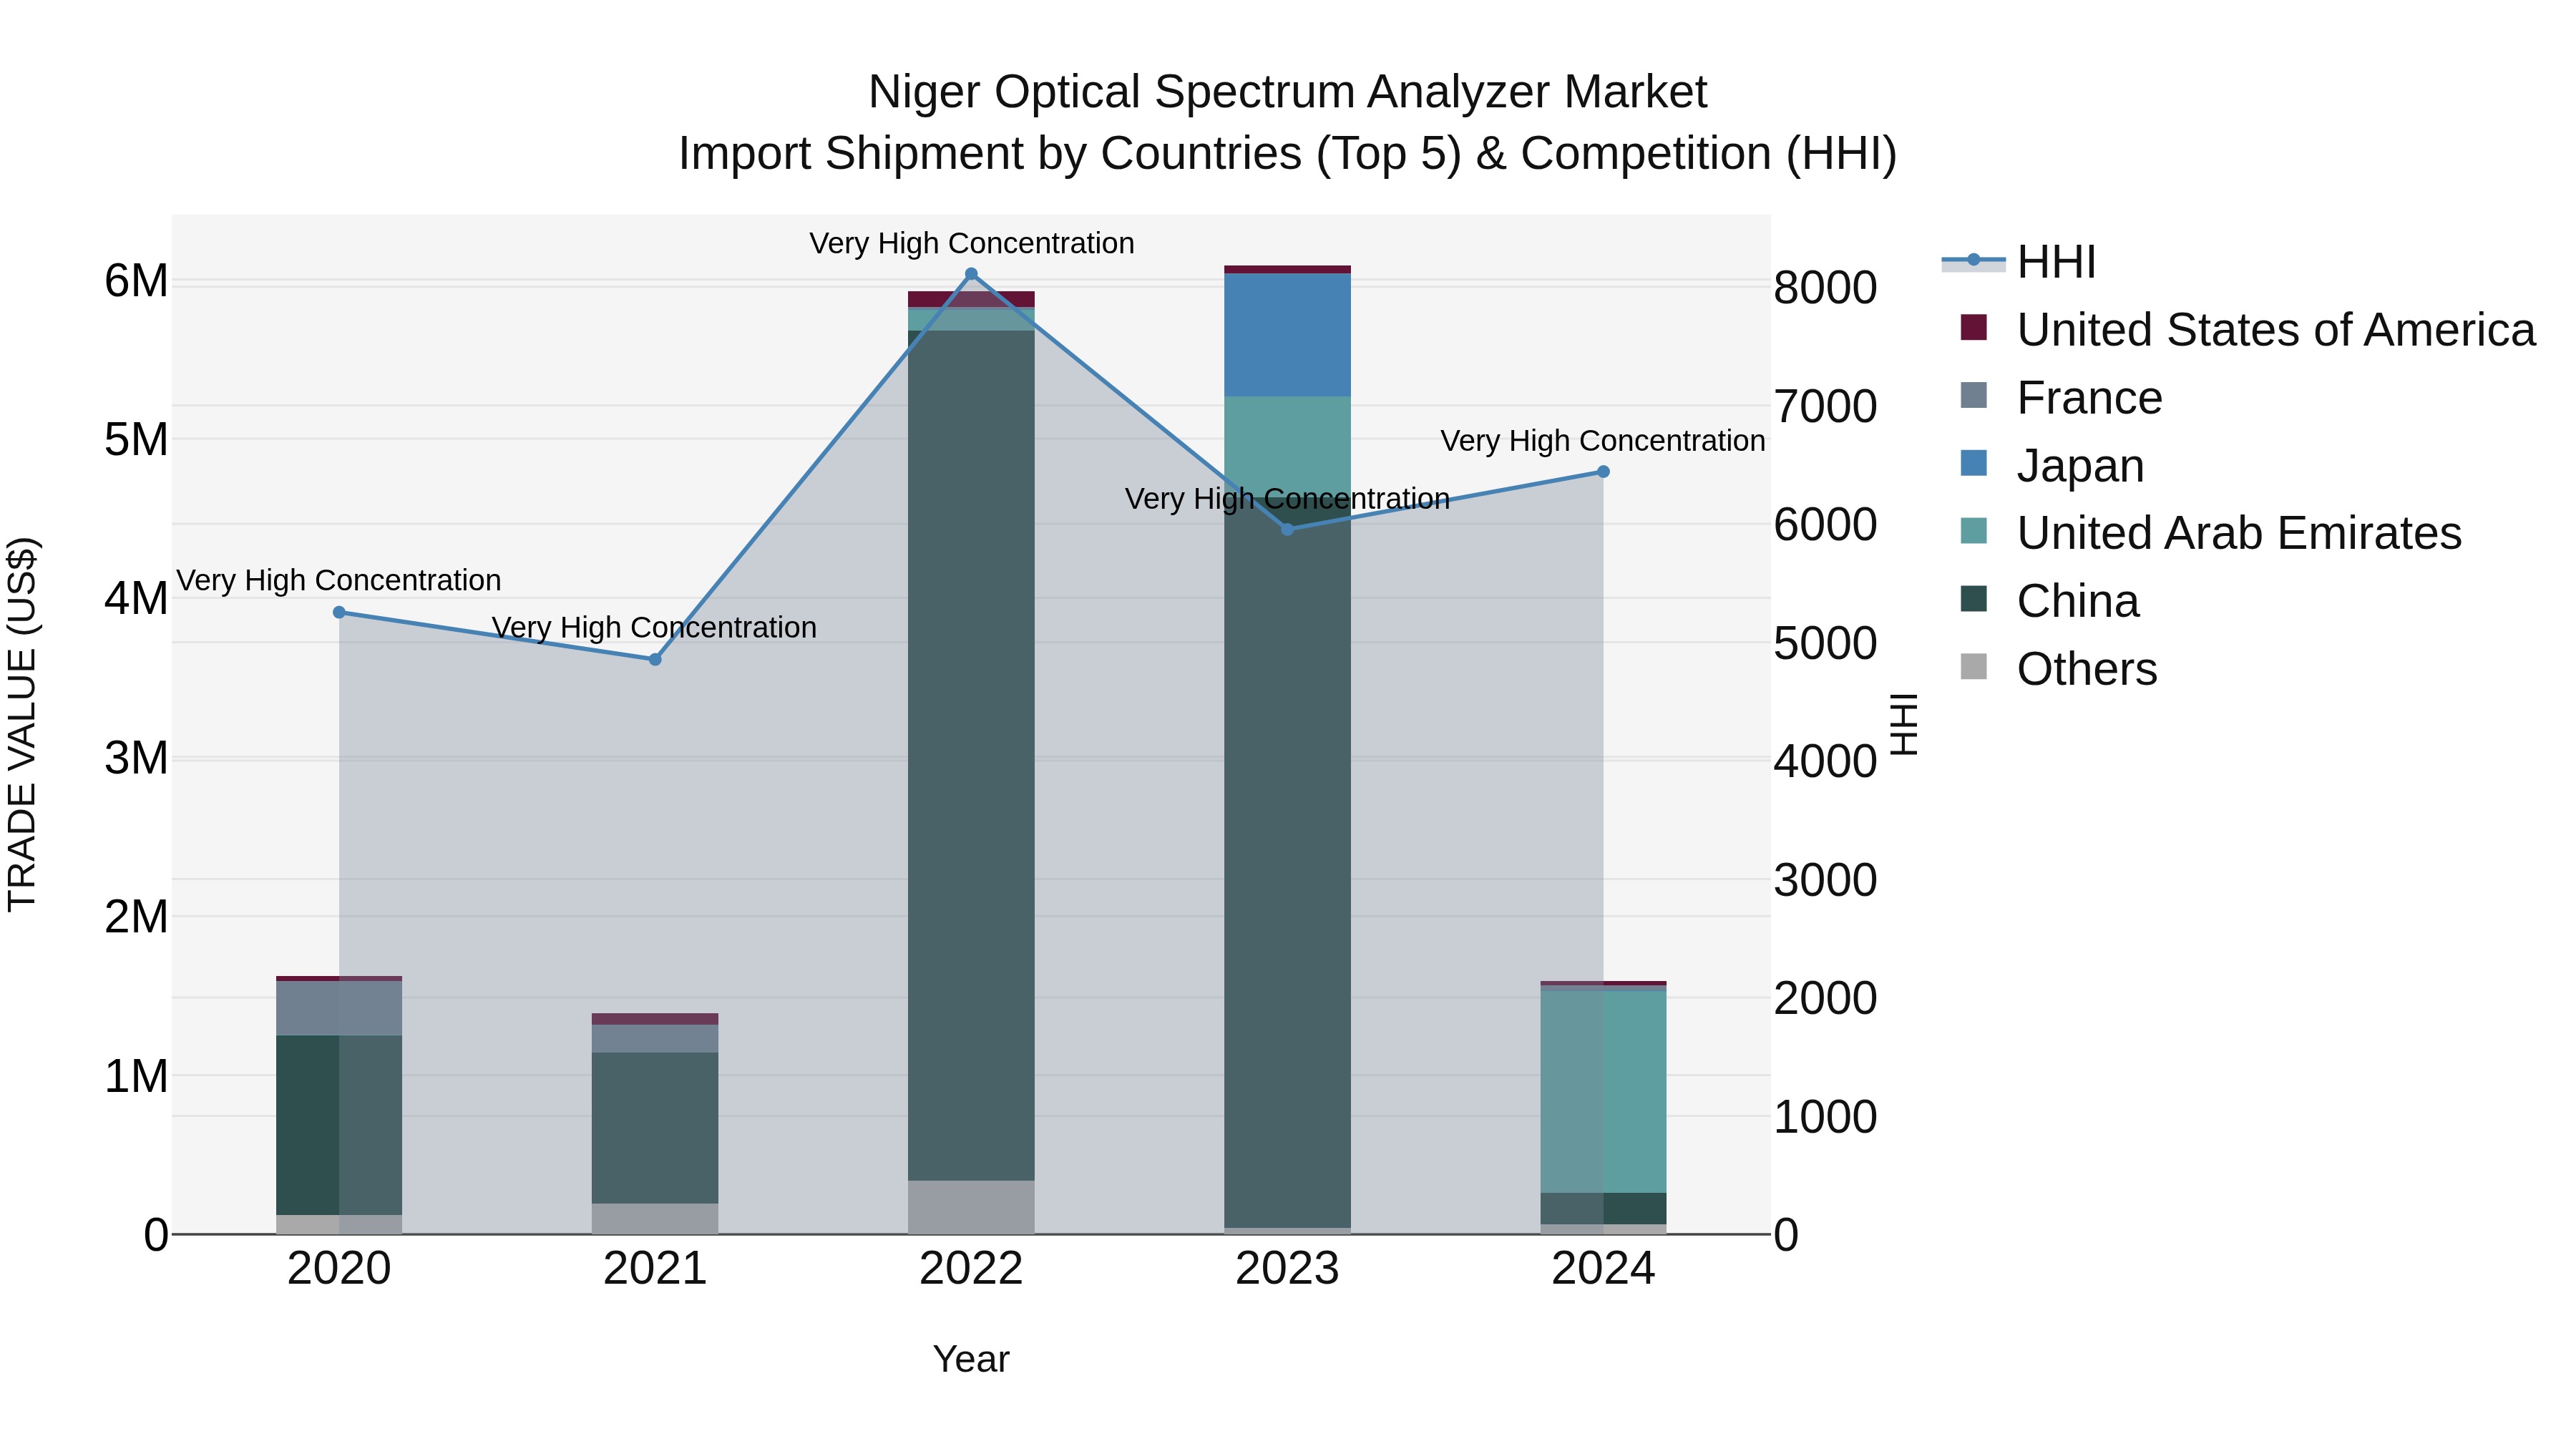
Niger Optical Spectrum Analyzer Market: Top 5 Importing Countries and Market Competition (HHI) Analysis
The optical spectrum analyzer import shipments to Niger in 2024 were dominated by countries like the United Arab Emirates, China, France, the United States of America, and India. Despite a high concentration level indicated by the HHI, the market experienced a declining trend with a CAGR of -0.52% from 2020 to 2024. The growth rate plummeted significantly by -73.88% from 2023 to 2024, reflecting challenges and fluctuations in the market dynamics. Keeping a close watch on these trends will be crucial for stakeholders in the optical spectrum analyzer industry.
Key Highlights of the Report:
- Niger Optical Spectrum Analyzer Market Outlook
- Market Size of Niger Optical Spectrum Analyzer Market, 2025
- Forecast of Niger Optical Spectrum Analyzer Market, 2032
- Historical Data and Forecast of Niger Optical Spectrum Analyzer Revenues & Volume for the Period 2022 - 2032
- Niger Optical Spectrum Analyzer Market Trend Evolution
- Niger Optical Spectrum Analyzer Market Drivers and Challenges
- Niger Optical Spectrum Analyzer Price Trends
- Niger Optical Spectrum Analyzer Porter's Five Forces
- Niger Optical Spectrum Analyzer Industry Life Cycle
- Historical Data and Forecast of Niger Optical Spectrum Analyzer Market Revenues & Volume By Product Type for the Period 2022 - 2032
- Historical Data and Forecast of Niger Optical Spectrum Analyzer Market Revenues & Volume By Portable for the Period 2022 - 2032
- Historical Data and Forecast of Niger Optical Spectrum Analyzer Market Revenues & Volume By Benchtop for the Period 2022 - 2032
- Historical Data and Forecast of Niger Optical Spectrum Analyzer Market Revenues & Volume By Handheld for the Period 2022 - 2032
- Historical Data and Forecast of Niger Optical Spectrum Analyzer Market Revenues & Volume By Mode Type for the Period 2022 - 2032
- Historical Data and Forecast of Niger Optical Spectrum Analyzer Market Revenues & Volume By Spectrometer Mode for the Period 2022 - 2032
- Historical Data and Forecast of Niger Optical Spectrum Analyzer Market Revenues & Volume By Wavelength Meter Mode for the Period 2022 - 2032
- Historical Data and Forecast of Niger Optical Spectrum Analyzer Market Revenues & Volume By End Use for the Period 2022 - 2032
- Historical Data and Forecast of Niger Optical Spectrum Analyzer Market Revenues & Volume By IT & Telecommunication for the Period 2022 - 2032
- Historical Data and Forecast of Niger Optical Spectrum Analyzer Market Revenues & Volume By Medical & Healthcare for the Period 2022 - 2032
- Historical Data and Forecast of Niger Optical Spectrum Analyzer Market Revenues & Volume By Energy & Utilities for the Period 2022 - 2032
- Historical Data and Forecast of Niger Optical Spectrum Analyzer Market Revenues & Volume By Automotive for the Period 2022 - 2032
- Historical Data and Forecast of Niger Optical Spectrum Analyzer Market Revenues & Volume By Institutions for the Period 2022 - 2032
- Historical Data and Forecast of Niger Optical Spectrum Analyzer Market Revenues & Volume By Aerospace & Defence for the Period 2022 - 2032
- Historical Data and Forecast of Niger Optical Spectrum Analyzer Market Revenues & Volume By Semiconductors & Electronics for the Period 2022 - 2032
- Niger Optical Spectrum Analyzer Import Export Trade Statistics
- Market Opportunity Assessment By Product Type
- Market Opportunity Assessment By Mode Type
- Market Opportunity Assessment By End Use
- Niger Optical Spectrum Analyzer Top Companies Market Share
- Niger Optical Spectrum Analyzer Competitive Benchmarking By Technical and Operational Parameters
- Niger Optical Spectrum Analyzer Company Profiles
- Niger Optical Spectrum Analyzer Key Strategic Recommendations
Frequently Asked Questions About the Market Study (FAQs):
6Wresearch actively monitors the Niger Optical Spectrum Analyzer Market and publishes its comprehensive annual report, highlighting emerging trends, growth drivers, revenue analysis, and forecast outlook. Our insights help businesses to make data-backed strategic decisions with ongoing market dynamics. Our analysts track relevent industries related to the Niger Optical Spectrum Analyzer Market, allowing our clients with actionable intelligence and reliable forecasts tailored to emerging regional needs.
Yes, we provide customisation as per your requirements. To learn more, feel free to contact us on sales@6wresearch.com
1 Executive Summary |
2 Introduction |
2.1 Key Highlights of the Report |
2.2 Report Description |
2.3 Market Scope & Segmentation |
2.4 Research Methodology |
2.5 Assumptions |
3 Niger Optical Spectrum Analyzer Market Overview |
3.1 Niger Country Macro Economic Indicators |
3.2 Niger Optical Spectrum Analyzer Market Revenues & Volume, 2022 & 2032F |
3.3 Niger Optical Spectrum Analyzer Market - Industry Life Cycle |
3.4 Niger Optical Spectrum Analyzer Market - Porter's Five Forces |
3.5 Niger Optical Spectrum Analyzer Market Revenues & Volume Share, By Product Type, 2022 & 2032F |
3.6 Niger Optical Spectrum Analyzer Market Revenues & Volume Share, By Mode Type, 2022 & 2032F |
3.7 Niger Optical Spectrum Analyzer Market Revenues & Volume Share, By End Use, 2022 & 2032F |
4 Niger Optical Spectrum Analyzer Market Dynamics |
4.1 Impact Analysis |
4.2 Market Drivers |
4.2.1 Increasing demand for high-speed internet and data transmission technologies driving the adoption of optical spectrum analyzers in Niger. |
4.2.2 Growth in the telecommunications sector, particularly with the expansion of 4G and upcoming 5G networks, fueling the need for advanced testing equipment like optical spectrum analyzers. |
4.2.3 Government initiatives and investments in expanding the country's digital infrastructure propelling the market for optical spectrum analyzers. |
4.3 Market Restraints |
4.3.1 High initial costs associated with optical spectrum analyzers may hinder market penetration, especially among smaller enterprises. |
4.3.2 Limited awareness and technical expertise among end-users could impede the adoption of optical spectrum analyzers in Niger. |
4.3.3 Lack of skilled professionals to operate and maintain optical spectrum analyzers leading to potential challenges in the market. |
5 Niger Optical Spectrum Analyzer Market Trends |
6 Niger Optical Spectrum Analyzer Market, By Types |
6.1 Niger Optical Spectrum Analyzer Market, By Product Type |
6.1.1 Overview and Analysis |
6.1.2 Niger Optical Spectrum Analyzer Market Revenues & Volume, By Product Type, 2022 - 2032F |
6.1.3 Niger Optical Spectrum Analyzer Market Revenues & Volume, By Portable, 2022 - 2032F |
6.1.4 Niger Optical Spectrum Analyzer Market Revenues & Volume, By Benchtop, 2022 - 2032F |
6.1.5 Niger Optical Spectrum Analyzer Market Revenues & Volume, By Handheld, 2022 - 2032F |
6.2 Niger Optical Spectrum Analyzer Market, By Mode Type |
6.2.1 Overview and Analysis |
6.2.2 Niger Optical Spectrum Analyzer Market Revenues & Volume, By Spectrometer Mode, 2022 - 2032F |
6.2.3 Niger Optical Spectrum Analyzer Market Revenues & Volume, By Wavelength Meter Mode, 2022 - 2032F |
6.3 Niger Optical Spectrum Analyzer Market, By End Use |
6.3.1 Overview and Analysis |
6.3.2 Niger Optical Spectrum Analyzer Market Revenues & Volume, By IT & Telecommunication, 2022 - 2032F |
6.3.3 Niger Optical Spectrum Analyzer Market Revenues & Volume, By Medical & Healthcare, 2022 - 2032F |
6.3.4 Niger Optical Spectrum Analyzer Market Revenues & Volume, By Energy & Utilities, 2022 - 2032F |
6.3.5 Niger Optical Spectrum Analyzer Market Revenues & Volume, By Automotive, 2022 - 2032F |
6.3.6 Niger Optical Spectrum Analyzer Market Revenues & Volume, By Institutions, 2022 - 2032F |
6.3.7 Niger Optical Spectrum Analyzer Market Revenues & Volume, By Aerospace & Defence, 2022 - 2032F |
7 Niger Optical Spectrum Analyzer Market Import-Export Trade Statistics |
7.1 Niger Optical Spectrum Analyzer Market Export to Major Countries |
7.2 Niger Optical Spectrum Analyzer Market Imports from Major Countries |
8 Niger Optical Spectrum Analyzer Market Key Performance Indicators |
8.1 Average time taken for troubleshooting and resolving issues using optical spectrum analyzers. |
8.2 Percentage increase in the number of optical spectrum analyzer certifications among professionals in Niger. |
8.3 Adoption rate of optical spectrum analyzers in emerging industries such as healthcare, manufacturing, and research institutions. |
8.4 Rate of return on investment for companies utilizing optical spectrum analyzers for testing and quality assurance purposes. |
8.5 Frequency of software updates and technological advancements in optical spectrum analyzers impacting market growth. |
9 Niger Optical Spectrum Analyzer Market - Opportunity Assessment |
9.1 Niger Optical Spectrum Analyzer Market Opportunity Assessment, By Product Type, 2022 & 2032F |
9.2 Niger Optical Spectrum Analyzer Market Opportunity Assessment, By Mode Type, 2022 & 2032F |
9.3 Niger Optical Spectrum Analyzer Market Opportunity Assessment, By End Use, 2022 & 2032F |
10 Niger Optical Spectrum Analyzer Market - Competitive Landscape |
10.1 Niger Optical Spectrum Analyzer Market Revenue Share, By Companies, 2025 |
10.2 Niger Optical Spectrum Analyzer Market Competitive Benchmarking, By Operating and Technical Parameters |
11 Company Profiles |
12 Recommendations |
13 Disclaimer |
Global Go To Market Strategy - 2030
Export potential enables firms to identify high-growth global markets with greater confidence by combining advanced trade intelligence with a structured quantitative methodology. The framework analyzes emerging demand trends and country-level import patterns while integrating macroeconomic and trade datasets such as GDP and population forecasts, bilateral import–export flows, tariff structures, elasticity differentials between developed and developing economies, geographic distance, and import demand projections. Using weighted trade values from 2020–2024 as the base period to project country-to-country export potential for 2030, these inputs are operationalized through calculated drivers such as gravity model parameters, tariff impact factors, and projected GDP per-capita growth. Through an analysis of hidden potentials, demand hotspots, and market conditions that are most favorable to success, this method enables firms to focus on target countries, maximize returns, and global expansion with data, backed by accuracy.
By factoring in the projected importer demand gap that is currently unmet and could be potential opportunity, it identifies the potential for the Exporter (Country) among 190 countries, against the general trade analysis, which identifies the biggest importer or exporter.
To discover high-growth global markets and optimize your business strategy:
Click Here
Pricing
- Single User License$ 1,995
- Department License$ 2,400
- Site License$ 3,120
- Global License$ 3,795

Leadership Perspectives from Industry Events
Search
Thought Leadership and Analyst Meet


Our Clients
6WResearch In News
- India Export Attractiveness Tracker 2026
- India Air Conditioner Market Set for Strong Rebound in 2026 After Weather-Led Correction and GST-Driven Recovery: 6Wresearch
- ADAS in India: How Automatic Emergency Braking, Blind Spot Detection & Driver Monitoring are Transforming Road Safety
- Doha a strategic location for EV manufacturing hub: IPA Qatar
- Demand for luxury TVs surging in the GCC, says Samsung
- Empowering Growth: The Thriving Journey of Bangladesh’s Cable Industry
Latest Reports
- Nicaragua RPG Gaming Market (2026-2032)
- New Zealand RPG Gaming Market (2026-2032)
- Netherlands RPG Gaming Market (2026-2032)
- Nauru RPG Gaming Market (2026-2032)
- Namibia RPG Gaming Market (2026-2032)
- Mozambique RPG Gaming Market (2026-2032)
- Montenegro RPG Gaming Market (2026-2032)
- Mongolia RPG Gaming Market (2026-2032)
- Monaco RPG Gaming Market (2026-2032)
- Micronesia RPG Gaming Market (2026-2032)
Industry Events and Analyst Meet

EV India Expo 2026

HIMTEX 2026

India Refining Summit 2026

India EV Show 2026

EV tech India Expo 2026
Whitepaper
- Middle East & Africa Commercial Security Market Click here to view more.
- Middle East & Africa Fire Safety Systems & Equipment Market Click here to view more.
- GCC Drone Market Click here to view more.
- Middle East Lighting Fixture Market Click here to view more.
- GCC Physical & Perimeter Security Market Click here to view more.