Oman 3D Holographic Display and Services Market (2026-2032) Outlook | Share, Companies, Analysis, Revenue, Size, Industry, Value, Forecast, Growth & Trends
Market Forecast By End-users (Media and Entertainment, Consumer Electronics, Healthcare, Automotive, Retail, Others) And Competitive Landscape
| Product Code: ETC066782 | Publication Date: Aug 2021 | Updated Date: Jun 2026 | Product Type: Report | |
| Publisher: 6Wresearch | Author: Bhawna Singh | No. of Pages: 70 | No. of Figures: 35 | No. of Tables: 5 |
Oman 3D Holographic Display and Services Market Size, Share & Growth Rate
The Oman 3D Holographic Display and Services Market was estimated at USD 391 Million in 2025 and is projected to reach USD 534 Million by 2032, growing at a CAGR of 4.6% from 2026 to 2032. This growth trajectory is primarily fueled by the increasing demand for immersive visual experiences across various sectors, including advertising, education, and healthcare. As companies recognize the power of holographic displays for enhancing customer engagement, the market is seeing a rapid shift towards integrating these advanced technologies into their marketing and operational strategies.
Oman 3D Holographic Display and Services Market Growth Rate Analysis (2021-2032)
The Oman 3D Holographic Display and Services Market has exhibited stable growth over recent years, with an annual increase of 5.5% in 2021, 2022, and 2023, reflecting robust consumer demand and investments in advanced display technologies. As businesses embrace digitalization and innovative marketing solutions, this trend is anticipated to continue, albeit with a slight dip to 5.0% in 2025 due to potential market saturation. However, growth rebounds to 5.2% in 2026 and fluctuates between 5.0% and 5.5% through 2032. Factors such as enhanced infrastructure, evolving industrial applications, and favorable government policies underpin this resilience, positioning Oman as a competitive player in the regional tech landscape.
Oman 3D Holographic Display and Services Market Year-wise Growth Rate and Key Drivers
This graph highlights how the Oman 3D Holographic Display and Services Market has steadily grown over the past five years, supported by major growth factors.
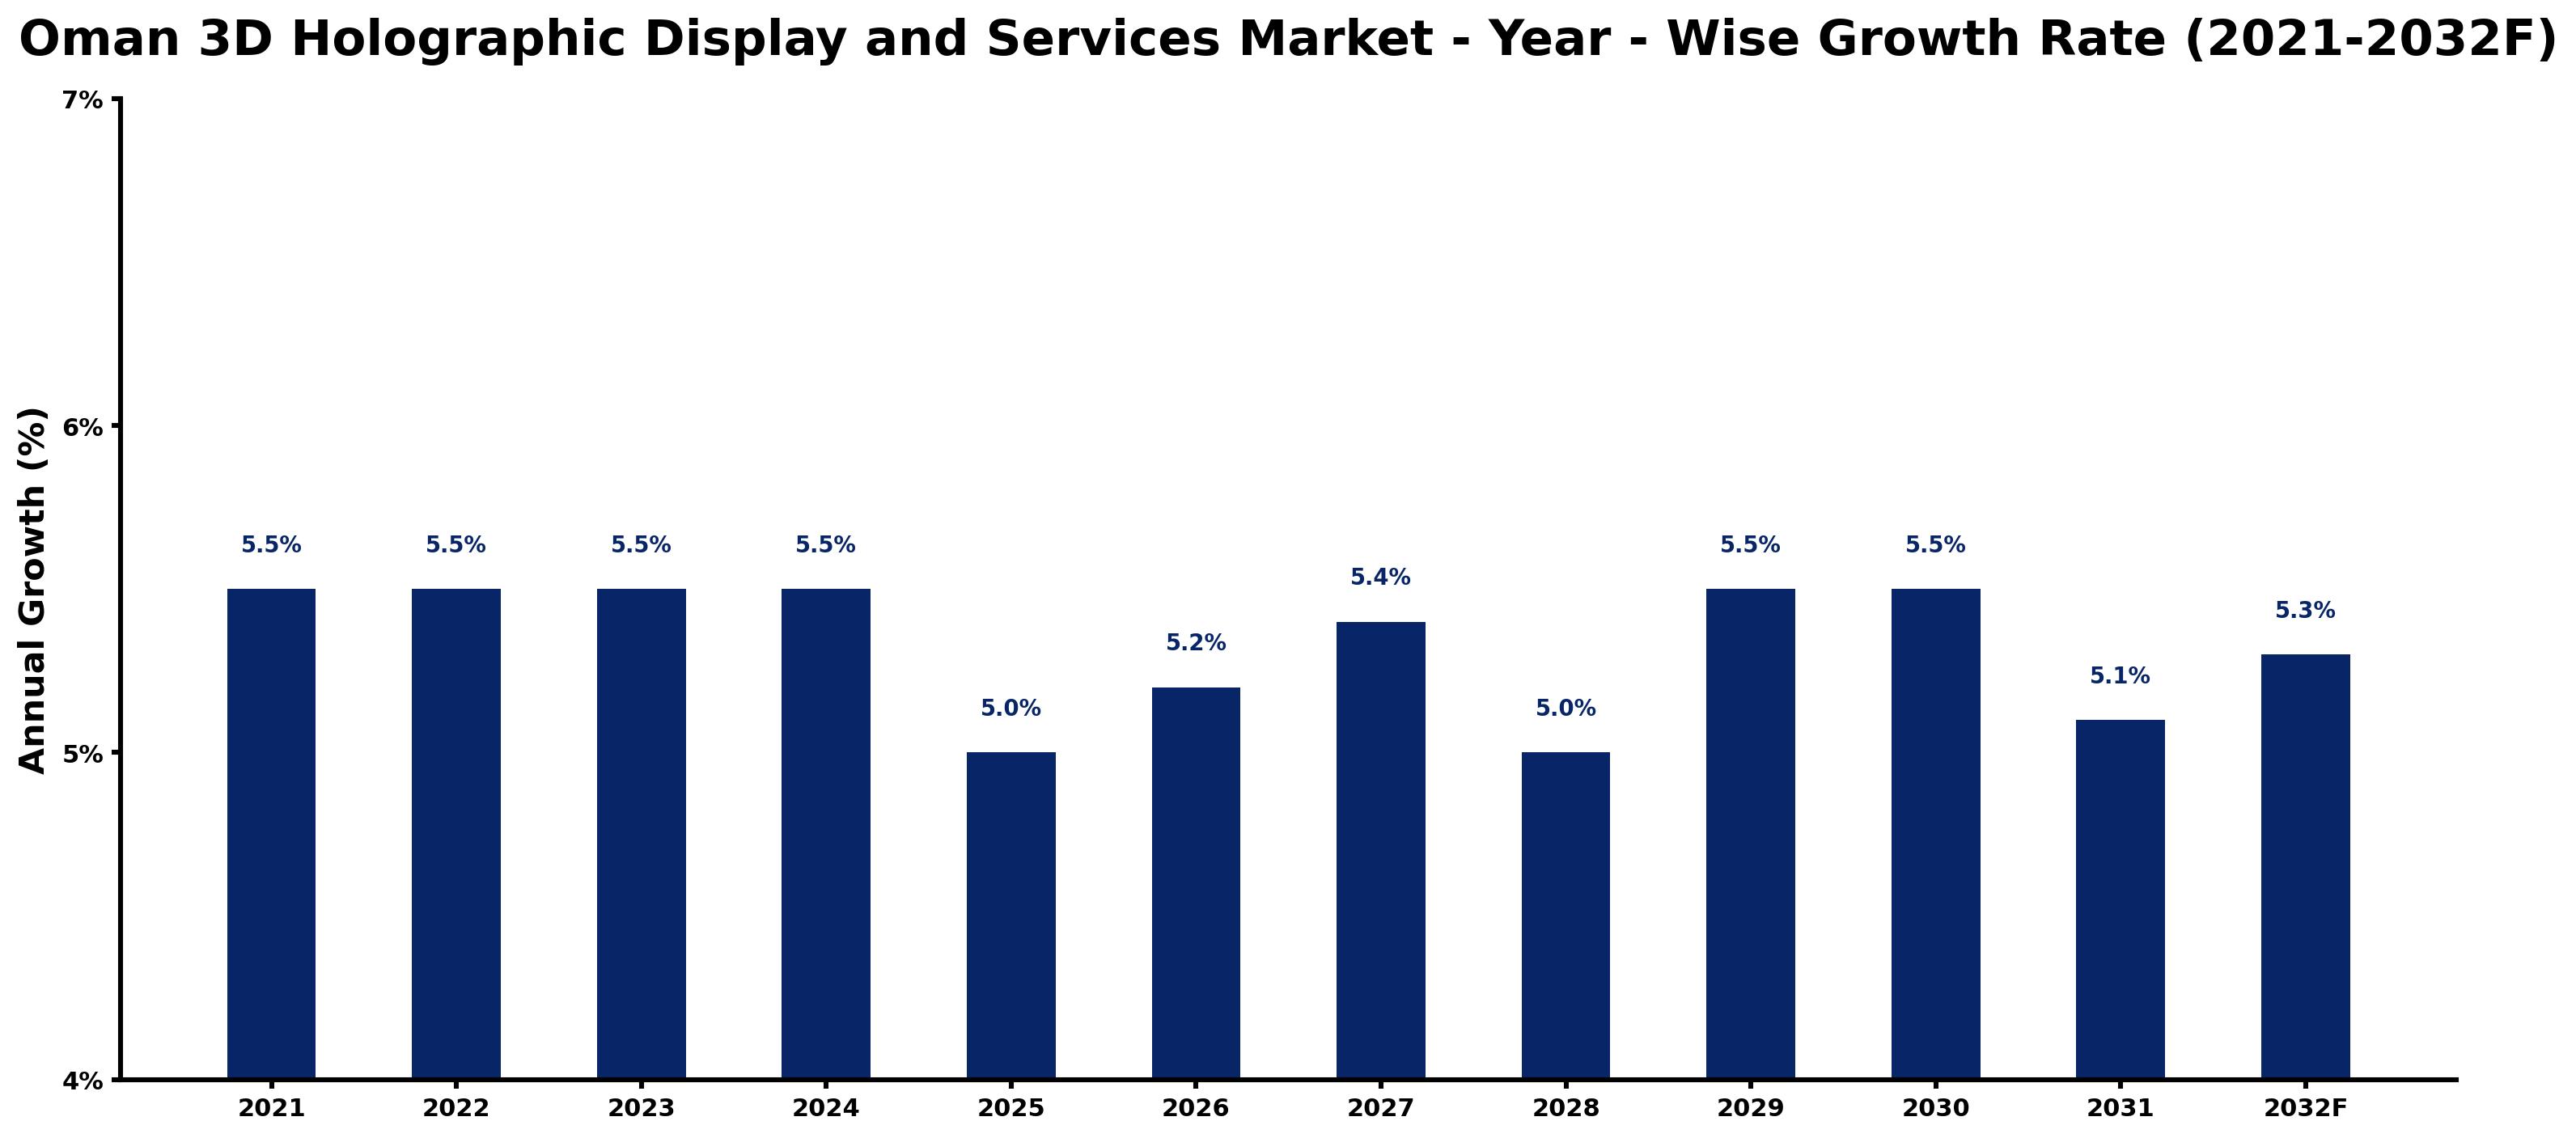
The table below presents the year‑wise growth rates along with the key drivers influencing the market
| Year | Growth Rate | Major Drivers |
| 2021 | 5.5% | Rapid growth in telecom and data center sectors |
| 2022 | 5.5% | Growing renewable energy integration projects |
| 2023 | 5.5% | Increasing smart city development projects |
| 2024 | 5.5% | Rapid growth in telecom and data center sectors |
| 2025 | 5.0% | Growing renewable energy integration projects |
| 2026 | 5.2% | Increasing smart city development projects |
| 2027 | 5.4% | Government infrastructure modernization initiatives |
| 2028 | 5.0% | Growing urbanization and commercial development |
| 2029 | 5.5% | Government infrastructure modernization initiatives |
| 2030 | 5.5% | Increasing smart city development projects |
| 2031 | 5.1% | Rising electricity demand across industries |
| 2032 | 5.3% | Increasing adoption of advanced technologies |
Note - Market size estimations and growth projections presented in this report are based on 6Wresearch’s advanced forecasting approach, validated with industry datasets as of June 2026.
Oman 3D Holographic Display and Services Market Synopsis
The adoption of 3D holographic displays in Oman is transforming the way businesses present their products and services, leading to higher consumer engagement and satisfaction. Companies are leveraging this technology for innovative marketing campaigns, virtual events, and interactive training sessions, which significantly enhance audience interaction.
Moreover, as the technology becomes more affordable, smaller businesses are beginning to utilize holographic displays, expanding the market reach beyond large enterprises. The ongoing digital transformation in Oman further underscores the potential for growth in holographic solutions, positioning it as a crucial player in the future of visual technology.
Oman 3D Holographic Display and Services Market Key Takeaways
- The market is poised for substantial growth due to the increasing demand for immersive visual experiences across multiple sectors.
- Technological advancements are making holographic displays more accessible and affordable for a wider range of businesses.
- Holographic content creation and technical support services are gaining importance as the market evolves.
- Ongoing government initiatives aim to support the development and adoption of 3D holographic technologies.
- The integration of augmented reality and virtual reality applications is expected to further drive market expansion.
Evaluation of Restraints in Oman 3D Holographic Display and Services Market
Despite the promising growth outlook, the Oman 3D holographic display and services market faces several challenges. A lack of awareness and understanding among potential users is a significant barrier to adoption. Moreover, the initial investment costs for implementing these advanced displays can be prohibitive for smaller businesses. Additionally, the industry grapples with a shortage of skilled professionals who can create and manage holographic content effectively. Regulatory challenges related to intellectual property and content licensing may further complicate market dynamics, necessitating strategic efforts to address these constraints.
Oman 3D Holographic Display and Services Market Trends
The trends shaping the Oman 3D holographic display and services market include a growing preference for smaller, more user-friendly displays, which enable a broader range of companies to adopt this technology. The integration of holographic displays into educational settings is becoming increasingly common, as institutions aim to enhance learning experiences through interactive content. Additionally, companies are investing in holographic telepresence and live event holograms, which are gaining traction in sectors such as entertainment and corporate training, further highlighting the expanding applications of this technology.
Oman 3D Holographic Display and Services Market Opportunities
The market presents significant investment opportunities, particularly in the areas of manufacturing and distribution of holographic display technologies. There is a notable demand for related services such as content creation and software development, which can capitalize on the growing trend towards immersive and interactive experiences. With the government’s push for economic diversification and the promotion of technology adoption, investors can explore partnerships with local firms to drive innovation in the sector, ultimately leading to enhanced market potential and profitability.
Government Initiatives in the Oman 3D Holographic Display and Services Market
The government of Oman is proactively supporting the growth of the 3D holographic display and services market through a range of initiatives. These include financial incentives and subsidies aimed at encouraging innovation and development within the sector. Additionally, the government is fostering collaboration between industry players and academic institutions to enhance research and training capabilities. Regulatory frameworks are being established to ensure quality standards and consumer protection, further enhancing the market's attractiveness for investors and businesses.
Future Insights of the Oman 3D Holographic Display and Services Market
The Oman 3D Holographic Display and Services Market is set for remarkable progress from 2026 to 2032. With increasing adoption across sectors like healthcare, education, and retail, the demand for sophisticated display solutions is expected to escalate. As digital transformation continues, businesses will likely prioritize immersive marketing tactics that leverage holographic displays to create memorable customer experiences. Moreover, as technology advances and costs decrease, broader access to these solutions will fuel further growth and innovation in the market.
Oman 3D Holographic Display and Services Market Latest Developments (May 2025 - June 2026)
Recent developments in the Oman 3D holographic display and services market indicate a growing emphasis on innovative use cases and applications. Companies are increasingly exploring the integration of augmented and virtual reality elements into their holographic displays, enhancing user interaction. Additionally, partnerships and collaborations aimed at improving content creation capabilities are on the rise, as businesses seek to provide high-quality holographic experiences. The overall market sentiment is optimistic, with many stakeholders keen to capitalize on emerging technologies.
Oman 3D Holographic Display and Services Market - Key Attractiveness of the Report
- 10 Years of Market Numbers
- Historical Data Starting from 2022 to 2025
- Base Year: 2025
- Forecast Data until 2032
- Key Performance Indicators Impacting the Market
- Major Upcoming Developments and Projects
Key Highlights of the Report:
- Oman 3D Holographic Display and Services Market Outlook
- Market Size of Oman 3D Holographic Display and Services Market, 2025
- Forecast of Oman 3D Holographic Display and Services Market, 2032
- Historical Data and Forecast of Oman 3D Holographic Display and Services Revenues & Volume for the Period 2022-2032F
- Oman 3D Holographic Display and Services Market Trend Evolution
- Oman 3D Holographic Display and Services Market Drivers and Challenges
- Oman 3D Holographic Display and Services Price Trends
- Oman 3D Holographic Display and Services Porter's Five Forces
- Oman 3D Holographic Display and Services Industry Life Cycle
- Historical Data and Forecast of Oman 3D Holographic Display and Services Market Revenues & Volume By End-users for the Period 2022-2032F
- Historical Data and Forecast of Oman 3D Holographic Display and Services Market Revenues & Volume By Media and Entertainment for the Period 2022-2032F
- Historical Data and Forecast of Oman 3D Holographic Display and Services Market Revenues & Volume By Consumer Electronics for the Period 2022-2032F
- Historical Data and Forecast of Oman 3D Holographic Display and Services Market Revenues & Volume By Healthcare for the Period 2022-2032F
- Historical Data and Forecast of Oman 3D Holographic Display and Services Market Revenues & Volume By Automotive for the Period 2022-2032F
- Historical Data and Forecast of Oman 3D Holographic Display and Services Market Revenues & Volume By Retail for the Period 2022-2032F
- Historical Data and Forecast of Oman 3D Holographic Display and Services Market Revenues & Volume By Others for the Period 2022-2032F
- Oman 3D Holographic Display and Services Import Export Trade Statistics
- Market Opportunity Assessment By End-users
- Oman 3D Holographic Display and Services Top Companies Market Share
- Oman 3D Holographic Display and Services Competitive Benchmarking By Technical and Operational Parameters
- Oman 3D Holographic Display and Services Company Profiles
- Oman 3D Holographic Display and Services Key Strategic Recommendations
Oman 3D Holographic Display and Services Market - Frequently Asked Questions
The growth is primarily driven by increasing adoption across various sectors such as advertising, education, and healthcare, with businesses leveraging immersive technologies to enhance engagement.
The Oman 3D Holographic Display and Services Market is estimated at USD 391 Million in 2025 and is projected to reach USD 534 Million by 2032, with a CAGR of 4.6% from 2026 to 2032.
The Omani government is providing support through financial incentives, encouraging R&D, and fostering partnerships between industry and academia to enhance capabilities in the holographic sector.
Emerging applications include virtual product demonstrations, holographic telepresence, and interactive educational experiences, which are expanding the use cases for the technology.
Stakeholders are focusing on educational initiatives to raise awareness, strategic partnerships to drive innovation, and investments in training programs to cultivate a skilled workforce.
6Wresearch actively monitors the Oman 3D Holographic Display and Services Market and publishes its comprehensive annual report, highlighting emerging trends, growth drivers, revenue analysis, and forecast outlook. Our insights help businesses to make data-backed strategic decisions with ongoing market dynamics. Our analysts track relevent industries related to the Oman 3D Holographic Display and Services Market, allowing our clients with actionable intelligence and reliable forecasts tailored to emerging regional needs.
Yes, we provide customisation as per your requirements. To learn more, feel free to contact us on sales@6wresearch.com
1 Executive Summary |
2 Introduction |
2.1 Key Highlights of the Report |
2.2 Report Description |
2.3 Market Scope & Segmentation |
2.4 Research Methodology |
2.5 Assumptions |
3 Oman 3D Holographic Display and Services Market Overview |
3.1 Oman Country Macro Economic Indicators |
3.2 Oman 3D Holographic Display and Services Market Revenues & Volume, 2022 & 2032F |
3.3 Oman 3D Holographic Display and Services Market - Industry Life Cycle |
3.4 Oman 3D Holographic Display and Services Market - Porter's Five Forces |
3.5 Oman 3D Holographic Display and Services Market Revenues & Volume Share, By End-users, 2022 & 2032F |
4 Oman 3D Holographic Display and Services Market Dynamics |
4.1 Impact Analysis |
4.2 Market Drivers |
4.3 Market Restraints |
5 Oman 3D Holographic Display and Services Market Trends |
6 Oman 3D Holographic Display and Services Market, By Types |
6.1 Oman 3D Holographic Display and Services Market, By End-users |
6.1.1 Overview and Analysis |
6.1.2 Oman 3D Holographic Display and Services Market Revenues & Volume, By End-users, 2022-2032F |
6.1.3 Oman 3D Holographic Display and Services Market Revenues & Volume, By Media and Entertainment, 2022-2032F |
6.1.4 Oman 3D Holographic Display and Services Market Revenues & Volume, By Consumer Electronics, 2022-2032F |
6.1.5 Oman 3D Holographic Display and Services Market Revenues & Volume, By Healthcare, 2022-2032F |
6.1.6 Oman 3D Holographic Display and Services Market Revenues & Volume, By Automotive, 2022-2032F |
6.1.7 Oman 3D Holographic Display and Services Market Revenues & Volume, By Retail, 2022-2032F |
6.1.8 Oman 3D Holographic Display and Services Market Revenues & Volume, By Others, 2022-2032F |
7 Oman 3D Holographic Display and Services Market Import-Export Trade Statistics |
7.1 Oman 3D Holographic Display and Services Market Export to Major Countries |
7.2 Oman 3D Holographic Display and Services Market Imports from Major Countries |
8 Oman 3D Holographic Display and Services Market Key Performance Indicators |
9 Oman 3D Holographic Display and Services Market - Opportunity Assessment |
9.1 Oman 3D Holographic Display and Services Market Opportunity Assessment, By End-users, 2022 & 2032F |
10 Oman 3D Holographic Display and Services Market - Competitive Landscape |
10.1 Oman 3D Holographic Display and Services Market Revenue Share, By Companies, 2025 |
10.2 Oman 3D Holographic Display and Services Market Competitive Benchmarking, By Operating and Technical Parameters |
11 Company Profiles |
12 Recommendations |
13 Disclaimer |
Global Go To Market Strategy - 2030
Export potential enables firms to identify high-growth global markets with greater confidence by combining advanced trade intelligence with a structured quantitative methodology. The framework analyzes emerging demand trends and country-level import patterns while integrating macroeconomic and trade datasets such as GDP and population forecasts, bilateral import–export flows, tariff structures, elasticity differentials between developed and developing economies, geographic distance, and import demand projections. Using weighted trade values from 2020–2024 as the base period to project country-to-country export potential for 2030, these inputs are operationalized through calculated drivers such as gravity model parameters, tariff impact factors, and projected GDP per-capita growth. Through an analysis of hidden potentials, demand hotspots, and market conditions that are most favorable to success, this method enables firms to focus on target countries, maximize returns, and global expansion with data, backed by accuracy.
By factoring in the projected importer demand gap that is currently unmet and could be potential opportunity, it identifies the potential for the Exporter (Country) among 190 countries, against the general trade analysis, which identifies the biggest importer or exporter.
To discover high-growth global markets and optimize your business strategy:
Click Here
Pricing
- Single User License$ 1,995
- Department License$ 2,400
- Site License$ 3,120
- Global License$ 3,795

Leadership Perspectives from Industry Events
Search
Thought Leadership and Analyst Meet


Our Clients
6WResearch In News
- India Air Conditioner Market Set for Strong Rebound in 2026 After Weather-Led Correction and GST-Driven Recovery: 6Wresearch
- ADAS in India: How Automatic Emergency Braking, Blind Spot Detection & Driver Monitoring are Transforming Road Safety
- Doha a strategic location for EV manufacturing hub: IPA Qatar
- Demand for luxury TVs surging in the GCC, says Samsung
- Empowering Growth: The Thriving Journey of Bangladesh’s Cable Industry
- Demand for luxury TVs surging in the GCC, says Samsung
Latest Reports
- Nicaragua RPG Gaming Market (2026-2032)
- New Zealand RPG Gaming Market (2026-2032)
- Netherlands RPG Gaming Market (2026-2032)
- Nauru RPG Gaming Market (2026-2032)
- Namibia RPG Gaming Market (2026-2032)
- Mozambique RPG Gaming Market (2026-2032)
- Montenegro RPG Gaming Market (2026-2032)
- Mongolia RPG Gaming Market (2026-2032)
- Monaco RPG Gaming Market (2026-2032)
- Micronesia RPG Gaming Market (2026-2032)
Industry Events and Analyst Meet

HIMTEX 2026

India Refining Summit 2026

India EV Show 2026

EV tech India Expo 2026

Auto Tech Asia 2026
Whitepaper
- Middle East & Africa Commercial Security Market Click here to view more.
- Middle East & Africa Fire Safety Systems & Equipment Market Click here to view more.
- GCC Drone Market Click here to view more.
- Middle East Lighting Fixture Market Click here to view more.
- GCC Physical & Perimeter Security Market Click here to view more.