Pakistan Collagen Drinks Market (2026-2032) | Restraints, Segmentation, Strategy, Industry, Competitive, Growth, Consumer Insights, Drivers, Revenue, Competition, Challenges, Forecast, Demand, Outlook, Size, Analysis, Value, Investment Trends, Companies, Supply, Trends, Strategic Insights, Share, Pricing Analysis, Segments, Opportunities
Market Forecast By Flavor (Original, Strawberry, Blueberry, Grape), By Form (Powder, Liquid, Capsules, Gummies), By Source (Bovine, Porcine, Marine, Chicken), By Type (Hydrolyzed, Unhydrolyzed, Denatured, Gelatin), By Application (Skin Health, Hair Growth, Nail Strengthening, Joint Pain Relief) And Competitive Landscape
| Product Code: ETC11622239 | Publication Date: Apr 2025 | Updated Date: Feb 2026 | Product Type: Market Research Report | |
| Publisher: 6Wresearch | No. of Pages: 65 | No. of Figures: 34 | No. of Tables: 19 | |
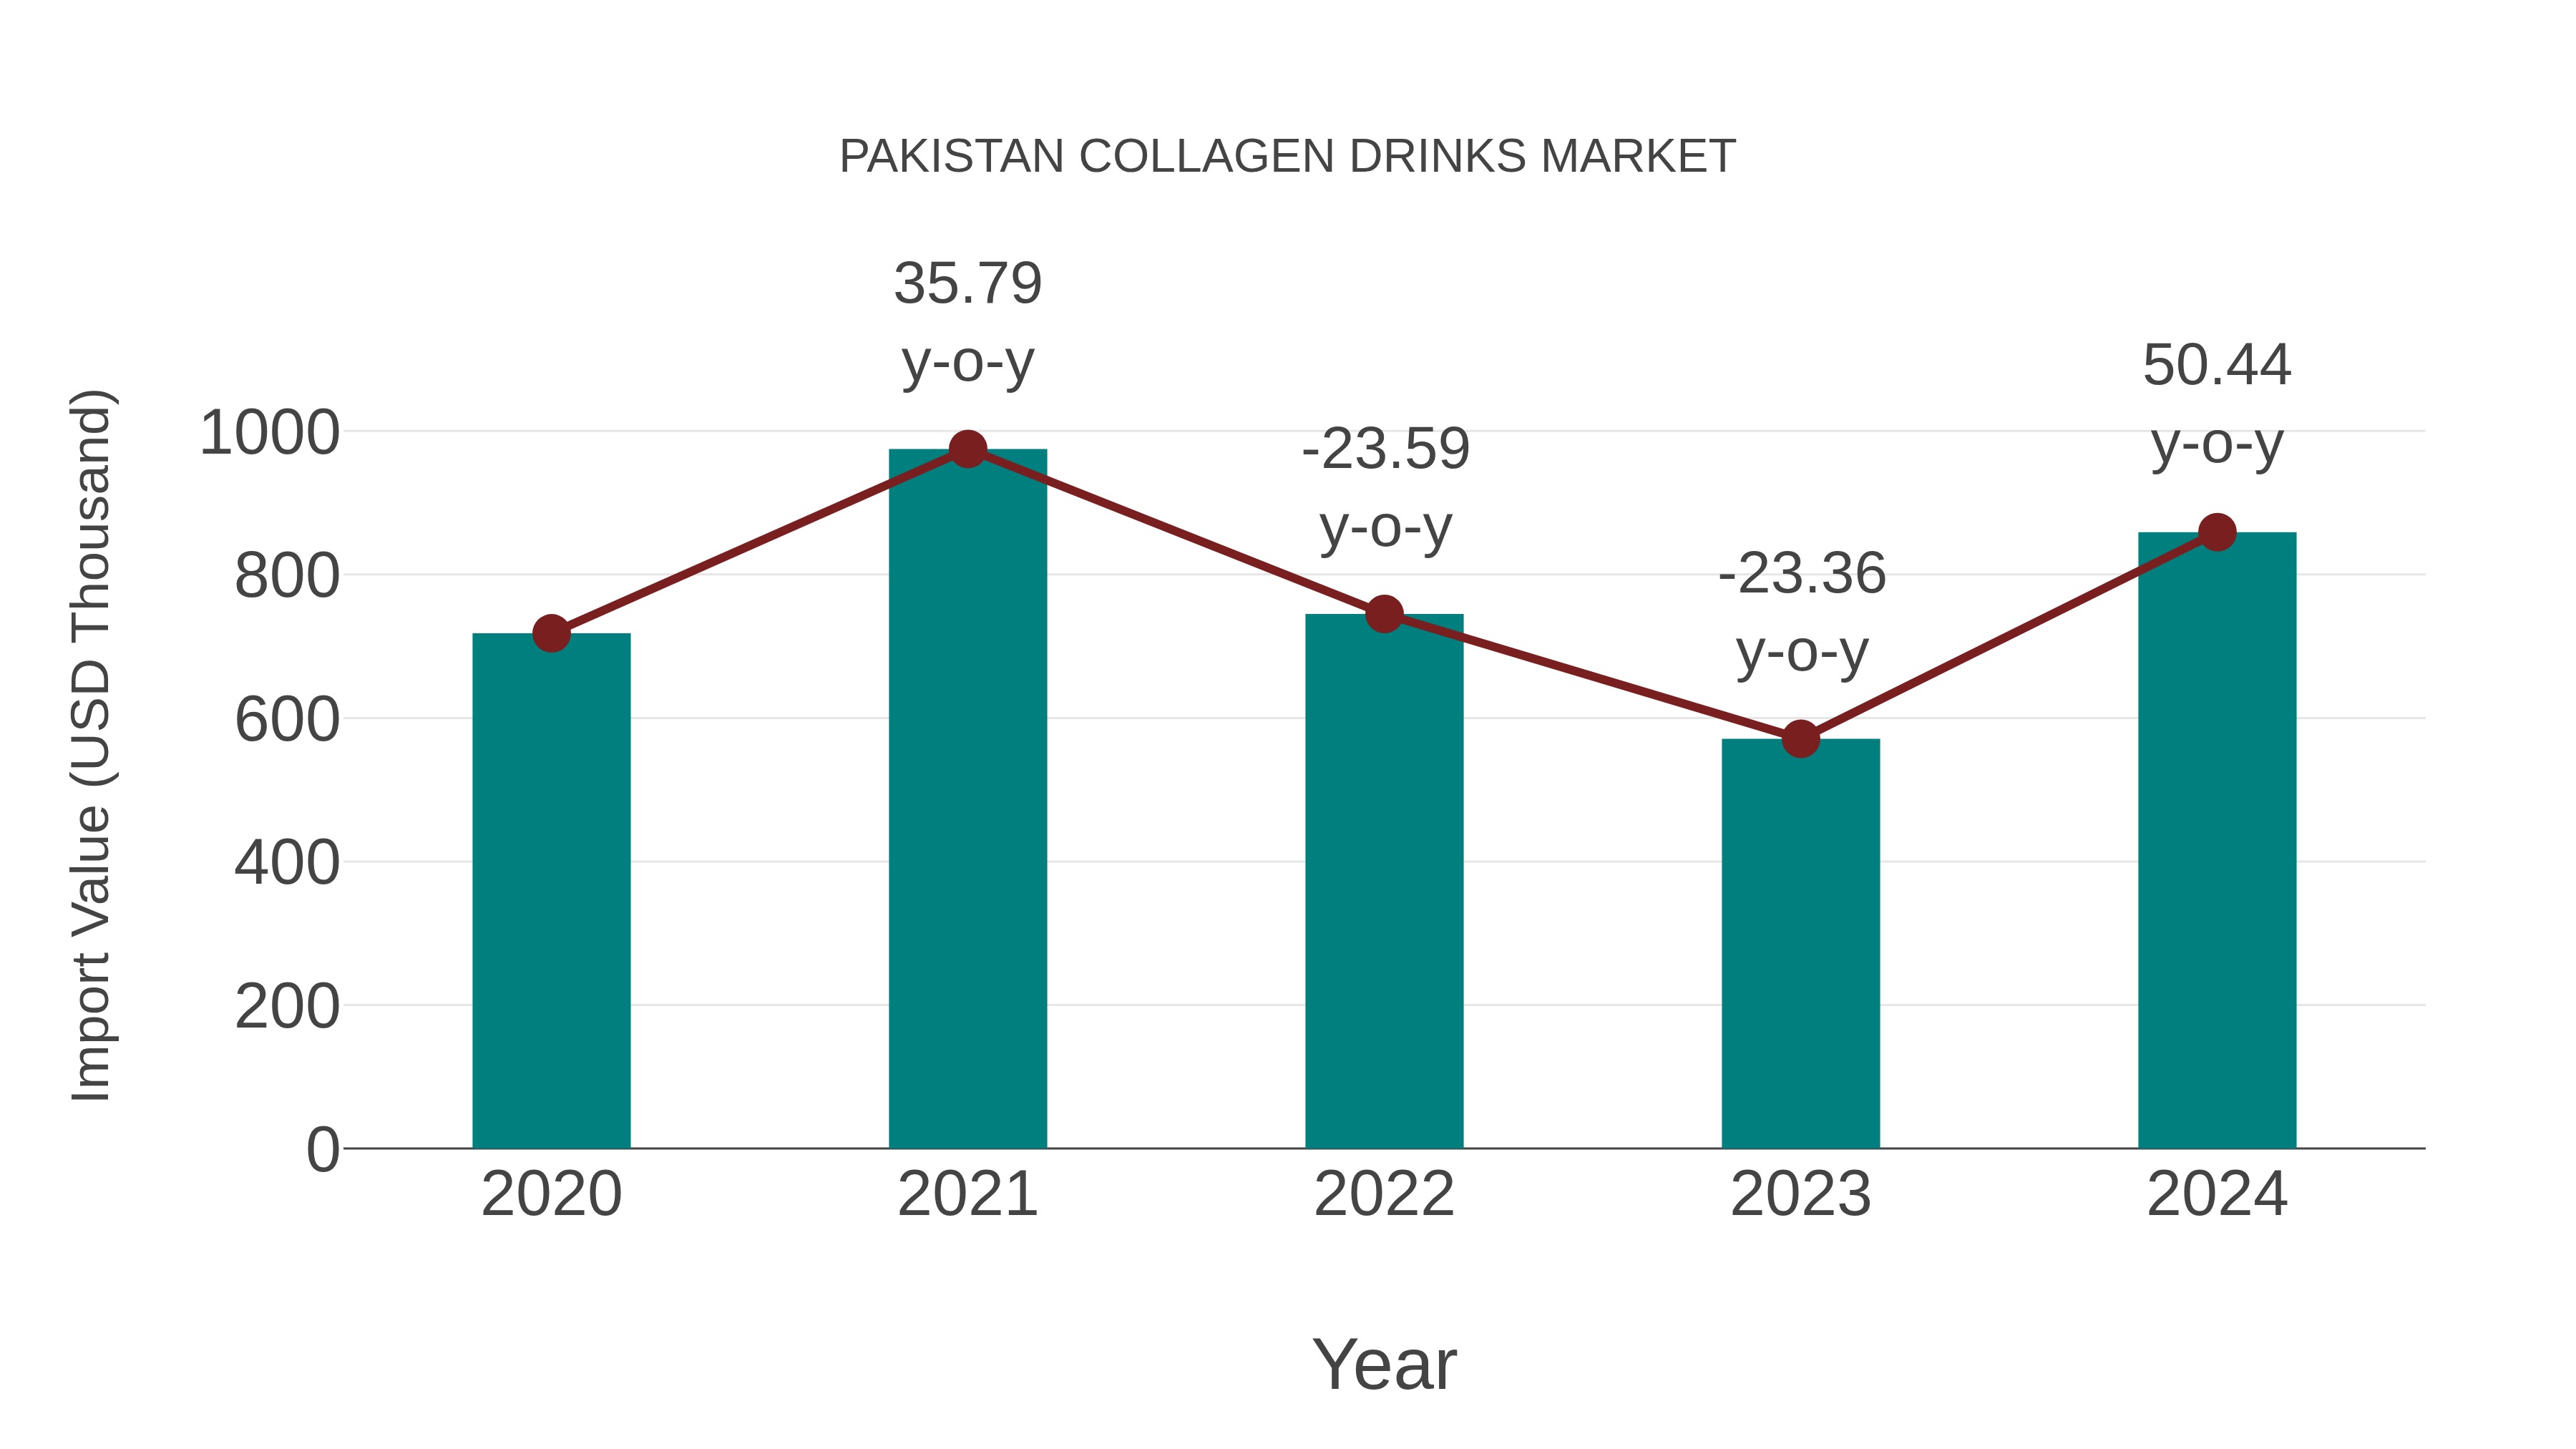
Pakistan Collagen Drinks Market: Import Trend Analysis
Pakistan import trend for collagen drinks in 2024 showed a significant growth rate of 50.44% compared to the previous year, with a compound annual growth rate (CAGR) of 4.58% from 2020 to 2024. This surge in imports can be attributed to the increasing consumer awareness of health and wellness products in the market, driving demand for collagen drinks.
Key Highlights of the Report:
- Pakistan Collagen Drinks Market Outlook
- Market Size of Pakistan Collagen Drinks Market, 2025
- Forecast of Pakistan Collagen Drinks Market, 2032
- Historical Data and Forecast of Pakistan Collagen Drinks Revenues & Volume for the Period 2022-2032F
- Pakistan Collagen Drinks Market Trend Evolution
- Pakistan Collagen Drinks Market Drivers and Challenges
- Pakistan Collagen Drinks Price Trends
- Pakistan Collagen Drinks Porter's Five Forces
- Pakistan Collagen Drinks Industry Life Cycle
- Historical Data and Forecast of Pakistan Collagen Drinks Market Revenues & Volume By Flavor for the Period 2022-2032F
- Historical Data and Forecast of Pakistan Collagen Drinks Market Revenues & Volume By Original for the Period 2022-2032F
- Historical Data and Forecast of Pakistan Collagen Drinks Market Revenues & Volume By Strawberry for the Period 2022-2032F
- Historical Data and Forecast of Pakistan Collagen Drinks Market Revenues & Volume By Blueberry for the Period 2022-2032F
- Historical Data and Forecast of Pakistan Collagen Drinks Market Revenues & Volume By Grape for the Period 2022-2032F
- Historical Data and Forecast of Pakistan Collagen Drinks Market Revenues & Volume By Form for the Period 2022-2032F
- Historical Data and Forecast of Pakistan Collagen Drinks Market Revenues & Volume By Powder for the Period 2022-2032F
- Historical Data and Forecast of Pakistan Collagen Drinks Market Revenues & Volume By Liquid for the Period 2022-2032F
- Historical Data and Forecast of Pakistan Collagen Drinks Market Revenues & Volume By Capsules for the Period 2022-2032F
- Historical Data and Forecast of Pakistan Collagen Drinks Market Revenues & Volume By Gummies for the Period 2022-2032F
- Historical Data and Forecast of Pakistan Collagen Drinks Market Revenues & Volume By Source for the Period 2022-2032F
- Historical Data and Forecast of Pakistan Collagen Drinks Market Revenues & Volume By Bovine for the Period 2022-2032F
- Historical Data and Forecast of Pakistan Collagen Drinks Market Revenues & Volume By Porcine for the Period 2022-2032F
- Historical Data and Forecast of Pakistan Collagen Drinks Market Revenues & Volume By Marine for the Period 2022-2032F
- Historical Data and Forecast of Pakistan Collagen Drinks Market Revenues & Volume By Chicken for the Period 2022-2032F
- Historical Data and Forecast of Pakistan Collagen Drinks Market Revenues & Volume By Type for the Period 2022-2032F
- Historical Data and Forecast of Pakistan Collagen Drinks Market Revenues & Volume By Hydrolyzed for the Period 2022-2032F
- Historical Data and Forecast of Pakistan Collagen Drinks Market Revenues & Volume By Unhydrolyzed for the Period 2022-2032F
- Historical Data and Forecast of Pakistan Collagen Drinks Market Revenues & Volume By Denatured for the Period 2022-2032F
- Historical Data and Forecast of Pakistan Collagen Drinks Market Revenues & Volume By Gelatin for the Period 2022-2032F
- Historical Data and Forecast of Pakistan Collagen Drinks Market Revenues & Volume By Application for the Period 2022-2032F
- Historical Data and Forecast of Pakistan Collagen Drinks Market Revenues & Volume By Skin Health for the Period 2022-2032F
- Historical Data and Forecast of Pakistan Collagen Drinks Market Revenues & Volume By Hair Growth for the Period 2022-2032F
- Historical Data and Forecast of Pakistan Collagen Drinks Market Revenues & Volume By Nail Strengthening for the Period 2022-2032F
- Historical Data and Forecast of Pakistan Collagen Drinks Market Revenues & Volume By Joint Pain Relief for the Period 2022 - 2032F
- Pakistan Collagen Drinks Import Export Trade Statistics
- Market Opportunity Assessment By Flavor
- Market Opportunity Assessment By Form
- Market Opportunity Assessment By Source
- Market Opportunity Assessment By Type
- Market Opportunity Assessment By Application
- Pakistan Collagen Drinks Top Companies Market Share
- Pakistan Collagen Drinks Competitive Benchmarking By Technical and Operational Parameters
- Pakistan Collagen Drinks Company Profiles
- Pakistan Collagen Drinks Key Strategic Recommendations
Frequently Asked Questions About the Market Study (FAQs):
6Wresearch actively monitors the Pakistan Collagen Drinks Market and publishes its comprehensive annual report, highlighting emerging trends, growth drivers, revenue analysis, and forecast outlook. Our insights help businesses to make data-backed strategic decisions with ongoing market dynamics. Our analysts track relevent industries related to the Pakistan Collagen Drinks Market, allowing our clients with actionable intelligence and reliable forecasts tailored to emerging regional needs.
Yes, we provide customisation as per your requirements. To learn more, feel free to contact us on sales@6wresearch.com
1 Executive Summary |
2 Introduction |
2.1 Key Highlights of the Report |
2.2 Report Description |
2.3 Market Scope & Segmentation |
2.4 Research Methodology |
2.5 Assumptions |
3 Pakistan Collagen Drinks Market Overview |
3.1 Pakistan Country Macro Economic Indicators |
3.2 Pakistan Collagen Drinks Market Revenues & Volume, 2022 & 2032F |
3.3 Pakistan Collagen Drinks Market - Industry Life Cycle |
3.4 Pakistan Collagen Drinks Market - Porter's Five Forces |
3.5 Pakistan Collagen Drinks Market Revenues & Volume Share, By Flavor, 2022 & 2032F |
3.6 Pakistan Collagen Drinks Market Revenues & Volume Share, By Form, 2022 & 2032F |
3.7 Pakistan Collagen Drinks Market Revenues & Volume Share, By Source, 2022 & 2032F |
3.8 Pakistan Collagen Drinks Market Revenues & Volume Share, By Type, 2022 & 2032F |
3.9 Pakistan Collagen Drinks Market Revenues & Volume Share, By Application, 2022 & 2032F |
4 Pakistan Collagen Drinks Market Dynamics |
4.1 Impact Analysis |
4.2 Market Drivers |
4.2.1 Increasing awareness about health and wellness among consumers in Pakistan |
4.2.2 Growing disposable income levels leading to higher spending on premium health products |
4.2.3 Rising demand for beauty and anti-aging products in the Pakistani market |
4.3 Market Restraints |
4.3.1 Lack of awareness about collagen drinks and their benefits among the general population |
4.3.2 Price sensitivity of consumers towards premium health products like collagen drinks |
4.3.3 Limited distribution channels for collagen drinks in Pakistan |
5 Pakistan Collagen Drinks Market Trends |
6 Pakistan Collagen Drinks Market, By Types |
6.1 Pakistan Collagen Drinks Market, By Flavor |
6.1.1 Overview and Analysis |
6.1.2 Pakistan Collagen Drinks Market Revenues & Volume, By Flavor, 2022 - 2032F |
6.1.3 Pakistan Collagen Drinks Market Revenues & Volume, By Original, 2022 - 2032F |
6.1.4 Pakistan Collagen Drinks Market Revenues & Volume, By Strawberry, 2022 - 2032F |
6.1.5 Pakistan Collagen Drinks Market Revenues & Volume, By Blueberry, 2022 - 2032F |
6.1.6 Pakistan Collagen Drinks Market Revenues & Volume, By Grape, 2022 - 2032F |
6.1.7 Pakistan Collagen Drinks Market Revenues & Volume, By Orange, 2022 - 2032F |
6.2 Pakistan Collagen Drinks Market, By Form |
6.2.1 Overview and Analysis |
6.2.2 Pakistan Collagen Drinks Market Revenues & Volume, By Powder, 2022 - 2032F |
6.2.3 Pakistan Collagen Drinks Market Revenues & Volume, By Liquid, 2022 - 2032F |
6.2.4 Pakistan Collagen Drinks Market Revenues & Volume, By Capsules, 2022 - 2032F |
6.2.5 Pakistan Collagen Drinks Market Revenues & Volume, By Gummies, 2022 - 2032F |
6.3 Pakistan Collagen Drinks Market, By Source |
6.3.1 Overview and Analysis |
6.3.2 Pakistan Collagen Drinks Market Revenues & Volume, By Bovine, 2022 - 2032F |
6.3.3 Pakistan Collagen Drinks Market Revenues & Volume, By Porcine, 2022 - 2032F |
6.3.4 Pakistan Collagen Drinks Market Revenues & Volume, By Marine, 2022 - 2032F |
6.3.5 Pakistan Collagen Drinks Market Revenues & Volume, By Chicken, 2022 - 2032F |
6.4 Pakistan Collagen Drinks Market, By Type |
6.4.1 Overview and Analysis |
6.4.2 Pakistan Collagen Drinks Market Revenues & Volume, By Hydrolyzed, 2022 - 2032F |
6.4.3 Pakistan Collagen Drinks Market Revenues & Volume, By Unhydrolyzed, 2022 - 2032F |
6.4.4 Pakistan Collagen Drinks Market Revenues & Volume, By Denatured, 2022 - 2032F |
6.4.5 Pakistan Collagen Drinks Market Revenues & Volume, By Gelatin, 2022 - 2032F |
6.5 Pakistan Collagen Drinks Market, By Application |
6.5.1 Overview and Analysis |
6.5.2 Pakistan Collagen Drinks Market Revenues & Volume, By Skin Health, 2022 - 2032F |
6.5.3 Pakistan Collagen Drinks Market Revenues & Volume, By Hair Growth, 2022 - 2032F |
6.5.4 Pakistan Collagen Drinks Market Revenues & Volume, By Nail Strengthening, 2022 - 2032F |
6.5.5 Pakistan Collagen Drinks Market Revenues & Volume, By Joint Pain Relief, 2022 - 2032F |
7 Pakistan Collagen Drinks Market Import-Export Trade Statistics |
7.1 Pakistan Collagen Drinks Market Export to Major Countries |
7.2 Pakistan Collagen Drinks Market Imports from Major Countries |
8 Pakistan Collagen Drinks Market Key Performance Indicators |
8.1 Social media engagement and reach related to collagen drinks in Pakistan |
8.2 Number of health and wellness influencers promoting collagen drinks |
8.3 Growth in the number of retail outlets stocking collagen drinks in Pakistan |
9 Pakistan Collagen Drinks Market - Opportunity Assessment |
9.1 Pakistan Collagen Drinks Market Opportunity Assessment, By Flavor, 2022 & 2032F |
9.2 Pakistan Collagen Drinks Market Opportunity Assessment, By Form, 2022 & 2032F |
9.3 Pakistan Collagen Drinks Market Opportunity Assessment, By Source, 2022 & 2032F |
9.4 Pakistan Collagen Drinks Market Opportunity Assessment, By Type, 2022 & 2032F |
9.5 Pakistan Collagen Drinks Market Opportunity Assessment, By Application, 2022 & 2032F |
10 Pakistan Collagen Drinks Market - Competitive Landscape |
10.1 Pakistan Collagen Drinks Market Revenue Share, By Companies, 2025 |
10.2 Pakistan Collagen Drinks Market Competitive Benchmarking, By Operating and Technical Parameters |
11 Company Profiles |
12 Recommendations |
13 Disclaimer |
Global Go To Market Strategy - 2030
Export potential enables firms to identify high-growth global markets with greater confidence by combining advanced trade intelligence with a structured quantitative methodology. The framework analyzes emerging demand trends and country-level import patterns while integrating macroeconomic and trade datasets such as GDP and population forecasts, bilateral import–export flows, tariff structures, elasticity differentials between developed and developing economies, geographic distance, and import demand projections. Using weighted trade values from 2020–2024 as the base period to project country-to-country export potential for 2030, these inputs are operationalized through calculated drivers such as gravity model parameters, tariff impact factors, and projected GDP per-capita growth. Through an analysis of hidden potentials, demand hotspots, and market conditions that are most favorable to success, this method enables firms to focus on target countries, maximize returns, and global expansion with data, backed by accuracy.
By factoring in the projected importer demand gap that is currently unmet and could be potential opportunity, it identifies the potential for the Exporter (Country) among 190 countries, against the general trade analysis, which identifies the biggest importer or exporter.
To discover high-growth global markets and optimize your business strategy:
Click Here
Pricing
- Single User License$ 1,995
- Department License$ 2,400
- Site License$ 3,120
- Global License$ 3,795

Leadership Perspectives from Industry Events
Search
Thought Leadership and Analyst Meet


Our Clients
6WResearch In News
- Crude Petroleum (USD 57.7 Billion) and Semiconductor ICs (USD 82.7 Billion) Dominate Malaysia's 2031 Export Potential, While USD 19.8 Billion in New Product Lines Opens New Opportunities
- Japan’s Export Potential Is Set to Reach USD 826.04 Billion by 2031, with USD 22.48 Billion Emerging from New Product Lines Beyond Established Trade Corridors
- Integrated Circuits Anchor South Korea's USD 320.8B Export Potential, While New Product Lines Unlock USD 22.4B Opportunity by 2031
- Thailand's USD 25.5 Billion Logic IC Opportunity Is Just the Beginning: New Product Lines Could Unlock Another USD 17.9 Billion in 2031
- Smartphones Lead India's Exports potential at $94 Billion by 2031 — But $30.1 Billion in Untapped Markets Is the Real Story
- India Air Conditioner Market Set for Strong Rebound in 2026 After Weather-Led Correction and GST-Driven Recovery: 6Wresearch
Latest Reports
- Gabon Citrullinemia Type-1 Market (2026-2032)
- Finland Citrullinemia Type-1 Market (2026-2032)
- Fiji Citrullinemia Type-1 Market (2026-2032)
- Ethiopia Citrullinemia Type-1 Market (2026-2032)
- Estonia Citrullinemia Type-1 Market (2026-2032)
- Eritrea Citrullinemia Type-1 Market (2026-2032)
- Equatorial Guinea Citrullinemia Type-1 Market (2026-2032)
- El Salvador Citrullinemia Type-1 Market (2026-2032)
- Ecuador Citrullinemia Type-1 Market (2026-2032)
- Dominica Citrullinemia Type-1 Market (2026-2032)
Industry Events and Analyst Meet

EV India Expo 2026

HIMTEX 2026

India Refining Summit 2026

India EV Show 2026

EV tech India Expo 2026
Whitepaper
- Middle East & Africa Commercial Security Market Click here to view more.
- Middle East & Africa Fire Safety Systems & Equipment Market Click here to view more.
- GCC Drone Market Click here to view more.
- Middle East Lighting Fixture Market Click here to view more.
- GCC Physical & Perimeter Security Market Click here to view more.