Peru Leather Market (2026-2032) | COVID-19 IMPACT, Revenue, Industry, Outlook, Growth, Share, Size, Companies, Value, Forecast, Trends & Analysis
Market Forecast By Type (Luggage, Footwear, Accessories), By Distribution Channel (Online, Offline) And Competitive Landscape
| Product Code: ETC015986 | Publication Date: Jun 2023 | Product Type: Report | ||
| Publisher: 6Wresearch | Author: Ravi Bhandari | No. of Pages: 70 | No. of Figures: 35 | No. of Tables: 5 |
Peru Leather Market Summary
The peru leather market was estimated at USD 283 Million in 2025 and is projected to reach USD 374 Million by 2032, growing at a CAGR of 4.7% from 2026 to 2032.
Peru Leather Market Year-wise Growth Rate and Key Drivers
This graph highlights how the Peru Leather Market has steadily grown over the past five years, supported by major growth factors.
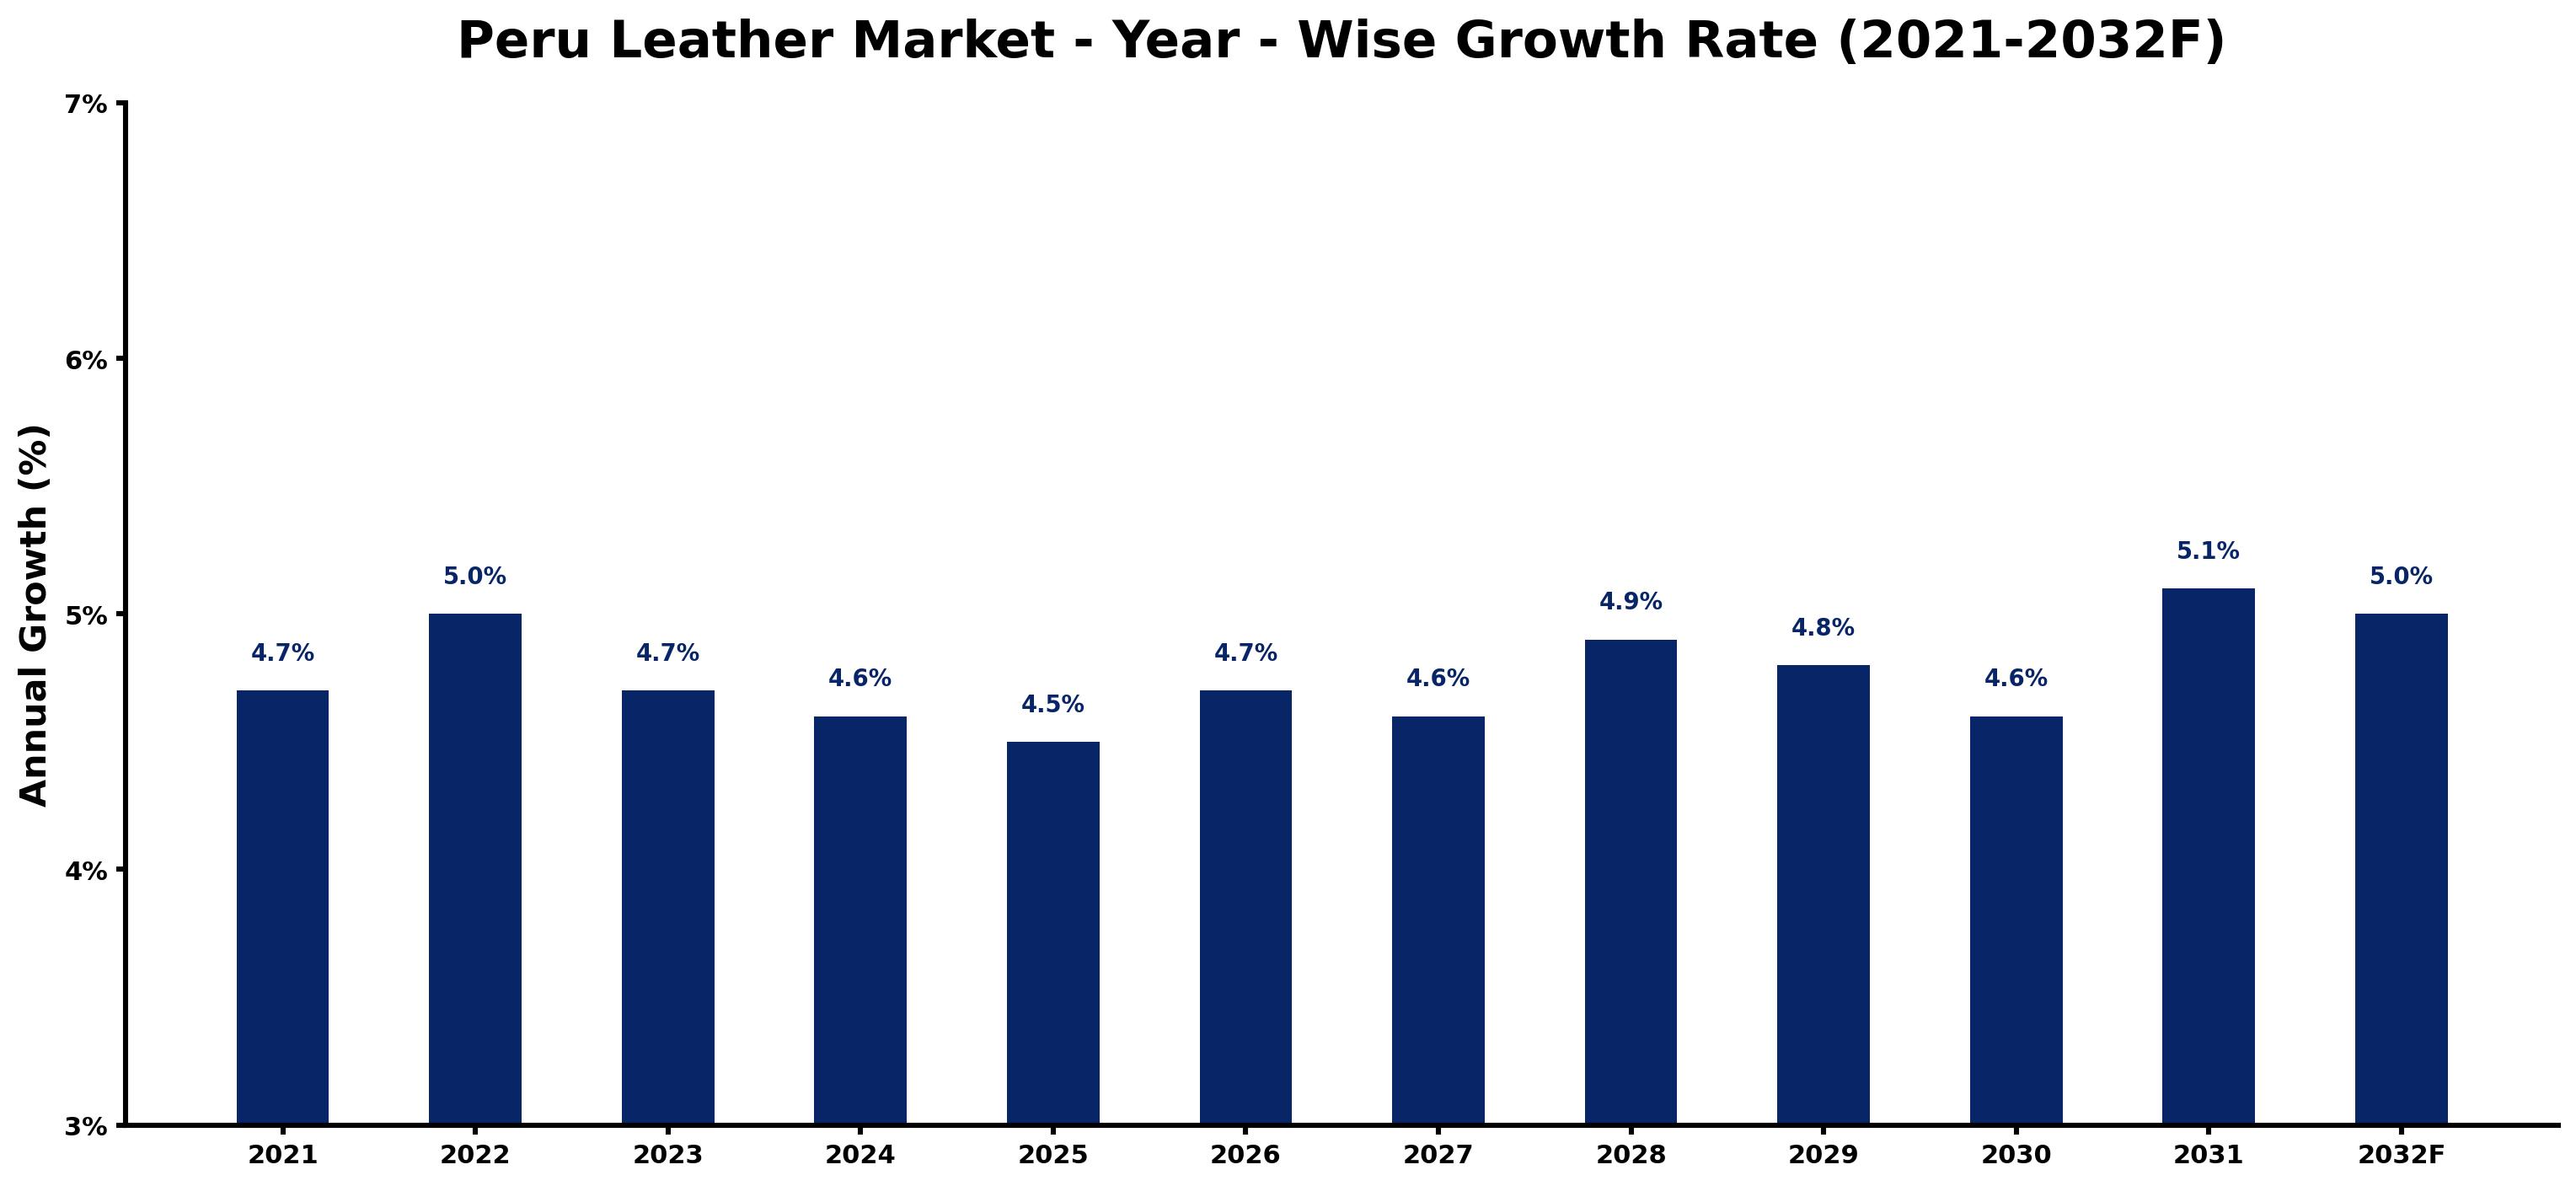
The table below presents the year wise growth rates along with the key drivers influencing the market
| Year | Growth Rate | Major Drivers |
| 2021 | 4.7% | Peru's artisan leather products gain global recognition for quality and craftsmanship. |
| 2022 | 5.0% | Growing interest in sustainable fashion positively influences leather sourcing practices. |
| 2023 | 4.7% | E-commerce platforms expand, enabling local artisans to reach broader customer bases. |
| 2024 | 4.6% | International trade agreements create more favorable export conditions for Peruvian leather. |
| 2025 | 4.5% | Luxury brands increasingly partner with local artisans to enhance product authenticity. |
| 2026 | 4.7% | Consumer preferences shift towards ethically produced leather, benefiting sustainable suppliers. |
| 2027 | 4.6% | Tourism recovery boosts demand for traditional leather goods in local markets. |
| 2028 | 4.9% | Innovation in leather processing techniques reduces environmental impact and attracts buyers. |
| 2029 | 4.8% | Urbanization trends encourage a higher consumption of premium leather goods in cities. |
| 2030 | 4.6% | Cultural appreciation for indigenous craftsmanship drives demand for unique leather items. |
| 2031 | 5.1% | Investment in local production facilities enhances the competitiveness of Peruvian leather. |
| 2032 | 5.0% | The integration of technology in design processes amplifies market reach and efficiency. |
Note - Market size estimations and growth projections presented in this report are based on 6Wresearch's advanced forecasting approach, validated with industry datasets as of June 2026.
Peru Leather Market Synopsis
The Peru Leather Market is projected to reach 4.7% and witness significant growth during the forecast period (2026-2032). This anticipated growth can be attributed to several factors, including the rising domestic demand for leather goods, increased purchasing power among consumers, and expanding tourism that drives the consumption of various leather products. The market is estimated to experience a compound annual growth rate (CAGR) of 5% during this period, reflecting the overall positive trend in consumer preferences for leather apparel, footwear, and accessories.
Peru Leather Market Growth Drivers
The growth of the Peru Leather Market is fueled by several key drivers:
- The increasing demand for leather apparel, footwear, and accessories among local consumers and tourists is a primary growth driver. As the fashion industry evolves, more consumers are seeking high-quality leather products.
- Urbanization contributes significantly to the demand for leather products. As more people move to urban areas, there is a shift towards premium fashion items that often embrace leather as a key material.
- Rising disposable income levels among the Peruvian population enable consumers to spend more on luxury items, including high-quality leather goods.
- Heightened interest in sustainable fashion drives some consumers towards vegan leather options, impacting the overall demand dynamics within the market.
- The growing sentiment towards animal rights is prompting a shift in consumer habits, leading to increased use of innovative synthetic materials as alternatives to traditional leather.
Peru Leather Market Trends and Opportunities
Trends in the Peru Leather Market indicate a strong potential for both traditional and synthetic leather products:
- There is a notable trend towards sustainable and ethical sourcing of materials, which reflects a growing consumer consciousness regarding environmental impacts.
- The rise of e-commerce platforms is creating new sales channels for leather products, enabling brands to reach wider audiences and enhance customer engagement.
- Collaborations between local artisans and designers are fostering unique leather products that appeal to both local and international markets.
- The influx of foreign tourists is increasing demand for locally-produced leather items, which are often perceived as authentic souvenirs.
- Technological advancements in manufacturing processes are improving the quality of leather products and promoting innovative applications of leather in various sectors.
Peru Leather Market Challenges and Restraints
Despite the growth potential, the Peru Leather Market faces several challenges:
- Fluctuations in raw material prices can impact the profit margins of leather manufacturers, complicating financial stability.
- Competition from synthetic alternatives may pose a challenge to traditional leather products, especially among environmentally conscious consumers.
- Regulatory measures surrounding animal rights and sustainable sourcing practices create pressures for manufacturers to adapt their processes, which may incur additional costs.
- Cultural shifts towards minimalist living and reduced consumerism could lead to decreased overall demand for luxury products, including leather goods.
- Supply chain disruptions, exacerbated by global events, may hinder the availability of leather materials, thereby affecting production timelines.
Peru Leather Market Government Investment and Initiatives
The government of Peru plays a crucial role in fostering the growth of the leather market through various initiatives:
- Policy frameworks aimed at promoting local craftsmanship are designed to support artisans and small manufacturers in the leather industry.
- Public investment in training programs for leather production techniques enhances the skill set of the workforce, leading to improved product quality.
- Incentives for adopting sustainable practices within the leather industry encourage businesses to innovate while focusing on environmental responsibility.
- Development plans geared towards enhancing export capabilities for Peruvian leather goods aim to tap into international markets and boost local economies.
- Collaborative efforts with international organizations to promote fair trade practices help elevate the global presence of Peruvian leather products.
Peru Leather Market Latest Developments (May 2025 - June 2026)
Recent developments in the Peru Leather Market indicate a transformative period as businesses adapt to evolving consumer preferences:
- Innovations in synthetic leather production were notable, as manufacturers explored eco-friendly alternatives to traditional leather, aiming to align with global sustainability trends.
- The rise of localized fashion shows and exhibitions highlighted the craftsmanship of Peruvian artisans, attracting attention from international buyers and fashion influencers.
- Increased collaboration between designers and local leather producers promoted a range of contemporary fashion items that appeal to both domestic and international markets.
- Efforts to digitize sales channels expanded significantly, with many brands leveraging online platforms and social media to enhance customer engagement and direct sales.
- Public awareness campaigns focused on animal rights and sustainable sourcing practices reshaped consumer attitudes, prompting increased interest in ethical fashion solutions.
Peru Leather Market - Key Attractiveness of the Report
- 10 Years of Market Numbers
- Historical Data Starting from 2022 to 2025
- Base Year: 2025
- Forecast Data until 2032
- Key Performance Indicators Impacting the Market
- Major Upcoming Developments and Projects
Key Highlights of the Report:
- Peru Leather Market Outlook
- Market Size of Peru Leather Market, 2025
- Forecast of Peru Leather Market, 2032F
- Historical Data and Forecast of Peru Leather Revenues & Volume for the Period 2022-2032F
- Peru Leather Market Trend Evolution
- Peru Leather Market Drivers and Challenges
- Peru Leather Price Trends
- Peru Leather Porter's Five Forces
- Peru Leather Industry Life Cycle
- Historical Data and Forecast of Peru Leather Market Revenues & Volume By Type for the Period 2022-2032F
- Historical Data and Forecast of Peru Leather Market Revenues & Volume By Luggage for the Period 2022-2032F
- Historical Data and Forecast of Peru Leather Market Revenues & Volume By Footwear for the Period 2022-2032F
- Historical Data and Forecast of Peru Leather Market Revenues & Volume By Accessories for the Period 2022-2032F
- Historical Data and Forecast of Peru Leather Market Revenues & Volume By Distribution Channel for the Period 2022-2032F
- Historical Data and Forecast of Peru Leather Market Revenues & Volume By Online for the Period 2022-2032F
- Historical Data and Forecast of Peru Leather Market Revenues & Volume By Offline for the Period 2022-2032F
- Peru Leather Import Export Trade Statistics
- Market Opportunity Assessment By Type
- Market Opportunity Assessment By Distribution Channel
- Peru Leather Top Companies Market Share
- Peru Leather Competitive Benchmarking By Technical and Operational Parameters
- Peru Leather Company Profiles
- Peru Leather Key Strategic Recommendations
Frequently Asked Questions About the Market Study (FAQs):
The growth is primarily driven by increasing demand for leather products, rising disposable incomes, and urbanization.
Consumer preferences are shifting towards sustainable and ethically sourced materials, which is influencing both product offerings and manufacturing practices.
Challenges include fluctuating raw material prices, competition from synthetic alternatives, and regulatory pressures related to animal rights.
The government is promoting local craftsmanship, providing training programs, and offering incentives for sustainable practices to enhance the leather industry.
6Wresearch actively monitors the Peru Leather Market and publishes its comprehensive annual report, highlighting emerging trends, growth drivers, revenue analysis, and forecast outlook. Our insights help businesses to make data-backed strategic decisions with ongoing market dynamics. Our analysts track relevent industries related to the Peru Leather Market, allowing our clients with actionable intelligence and reliable forecasts tailored to emerging regional needs.
Yes, we provide customisation as per your requirements. To learn more, feel free to contact us on sales@6wresearch.com
1 Executive Summary |
2 Introduction |
2.1 Key Highlights of the Report |
2.2 Report Description |
2.3 Market Scope & Segmentation |
2.4 Research Methodology |
2.5 Assumptions |
3 Peru Leather Market Overview |
3.1 Peru Country Macro Economic Indicators |
3.2 Peru Leather Market Revenues & Volume, 2022 & 2032F |
3.3 Peru Leather Market - Industry Life Cycle |
3.4 Peru Leather Market - Porter's Five Forces |
3.5 Peru Leather Market Revenues & Volume Share, By Type, 2022 & 2032F |
3.6 Peru Leather Market Revenues & Volume Share, By Distribution Channel, 2022 & 2032F |
4 Peru Leather Market Dynamics |
4.1 Impact Analysis |
4.2 Market Drivers |
4.3 Market Restraints |
5 Peru Leather Market Trends |
6 Peru Leather Market, By Types |
6.1 Peru Leather Market, By Type |
6.1.1 Overview and Analysis |
6.1.2 Peru Leather Market Revenues & Volume, By Type, 2022-2032F |
6.1.3 Peru Leather Market Revenues & Volume, By Luggage, 2022-2032F |
6.1.4 Peru Leather Market Revenues & Volume, By Footwear, 2022-2032F |
6.1.5 Peru Leather Market Revenues & Volume, By Accessories, 2022-2032F |
6.2 Peru Leather Market, By Distribution Channel |
6.2.1 Overview and Analysis |
6.2.2 Peru Leather Market Revenues & Volume, By Online, 2022-2032F |
6.2.3 Peru Leather Market Revenues & Volume, By Offline, 2022-2032F |
7 Peru Leather Market Import-Export Trade Statistics |
7.1 Peru Leather Market Export to Major Countries |
7.2 Peru Leather Market Imports from Major Countries |
8 Peru Leather Market Key Performance Indicators |
9 Peru Leather Market - Opportunity Assessment |
9.1 Peru Leather Market Opportunity Assessment, By Type, 2022 & 2032F |
9.2 Peru Leather Market Opportunity Assessment, By Distribution Channel, 2022 & 2032F |
10 Peru Leather Market - Competitive Landscape |
10.1 Peru Leather Market Revenue Share, By Companies, 2025 |
10.2 Peru Leather Market Competitive Benchmarking, By Operating and Technical Parameters |
11 Company Profiles |
12 Recommendations |
13 Disclaimer |
Global Go To Market Strategy - 2030
Export potential enables firms to identify high-growth global markets with greater confidence by combining advanced trade intelligence with a structured quantitative methodology. The framework analyzes emerging demand trends and country-level import patterns while integrating macroeconomic and trade datasets such as GDP and population forecasts, bilateral import–export flows, tariff structures, elasticity differentials between developed and developing economies, geographic distance, and import demand projections. Using weighted trade values from 2020–2024 as the base period to project country-to-country export potential for 2030, these inputs are operationalized through calculated drivers such as gravity model parameters, tariff impact factors, and projected GDP per-capita growth. Through an analysis of hidden potentials, demand hotspots, and market conditions that are most favorable to success, this method enables firms to focus on target countries, maximize returns, and global expansion with data, backed by accuracy.
By factoring in the projected importer demand gap that is currently unmet and could be potential opportunity, it identifies the potential for the Exporter (Country) among 190 countries, against the general trade analysis, which identifies the biggest importer or exporter.
To discover high-growth global markets and optimize your business strategy:
Click Here
Pricing
- Single User License$ 1,995
- Department License$ 2,400
- Site License$ 3,120
- Global License$ 3,795

Leadership Perspectives from Industry Events
Search
Thought Leadership and Analyst Meet


Our Clients
6WResearch In News
- India Export Attractiveness Tracker 2026
- India Air Conditioner Market Set for Strong Rebound in 2026 After Weather-Led Correction and GST-Driven Recovery: 6Wresearch
- ADAS in India: How Automatic Emergency Braking, Blind Spot Detection & Driver Monitoring are Transforming Road Safety
- Doha a strategic location for EV manufacturing hub: IPA Qatar
- Demand for luxury TVs surging in the GCC, says Samsung
- Empowering Growth: The Thriving Journey of Bangladesh’s Cable Industry
Latest Reports
- Nicaragua RPG Gaming Market (2026-2032)
- New Zealand RPG Gaming Market (2026-2032)
- Netherlands RPG Gaming Market (2026-2032)
- Nauru RPG Gaming Market (2026-2032)
- Namibia RPG Gaming Market (2026-2032)
- Mozambique RPG Gaming Market (2026-2032)
- Montenegro RPG Gaming Market (2026-2032)
- Mongolia RPG Gaming Market (2026-2032)
- Monaco RPG Gaming Market (2026-2032)
- Micronesia RPG Gaming Market (2026-2032)
Industry Events and Analyst Meet

EV India Expo 2026

HIMTEX 2026

India Refining Summit 2026

India EV Show 2026

EV tech India Expo 2026
Whitepaper
- Middle East & Africa Commercial Security Market Click here to view more.
- Middle East & Africa Fire Safety Systems & Equipment Market Click here to view more.
- GCC Drone Market Click here to view more.
- Middle East Lighting Fixture Market Click here to view more.
- GCC Physical & Perimeter Security Market Click here to view more.