Peru Used Car Market (2026-2032) | Analysis, Share, Revenue, Trends, Forecast, Industry, Size, Outlook, Growth, Value, Companies
Market Forecast By Vehicle Type (Hatchbacks, Sedan, Sports Utility Vehicle, Others), By Vendor (Organized, Unorganized), By Fuel Type (Gasoline, Diesel, Alternative Fuel Vehicles) And Competitive Landscape
| Product Code: ETC039227 | Publication Date: Jan 2021 | Updated Date: Jun 2026 | Product Type: Report | |
| Publisher: 6Wresearch | Author: Vasudha | No. of Pages: 70 | No. of Figures: 35 | No. of Tables: 5 |
Peru Used Car Market Summary
The peru used car market was estimated at USD 107 Million in 2025 and is projected to reach USD 118 Million by 2032, growing at a CAGR of 1.3% from 2026 to 2032.
Peru Used Car Market Growth Rate Analysis (2021-2032)
The Peru used car market has shown a notable recovery after a challenging period, with a -3.8% decline in 2021 followed by a rebound of 5.6% in 2022 and a continued upward trend of 5.8% in 2023. This resurgence can be attributed to the increasing consumer demand for affordable mobility solutions amidst rising new car prices and the growing availability of digital platforms for car sales. While growth is expected to taper to a more stable rate of 0.1% in 2024 and gradually reach 1.6% by 2032, ongoing investments in automotive infrastructure and the potential integration of technology will be pivotal. As globalization shapes consumer preferences, the market remains optimistic, signalling a transition towards sustainable and accessible vehicle options.
Peru Used Car Market Year-wise Growth Rate and Key Drivers
This graph highlights how the Peru Used Car Market has steadily grown over the past five years, supported by major growth factors.
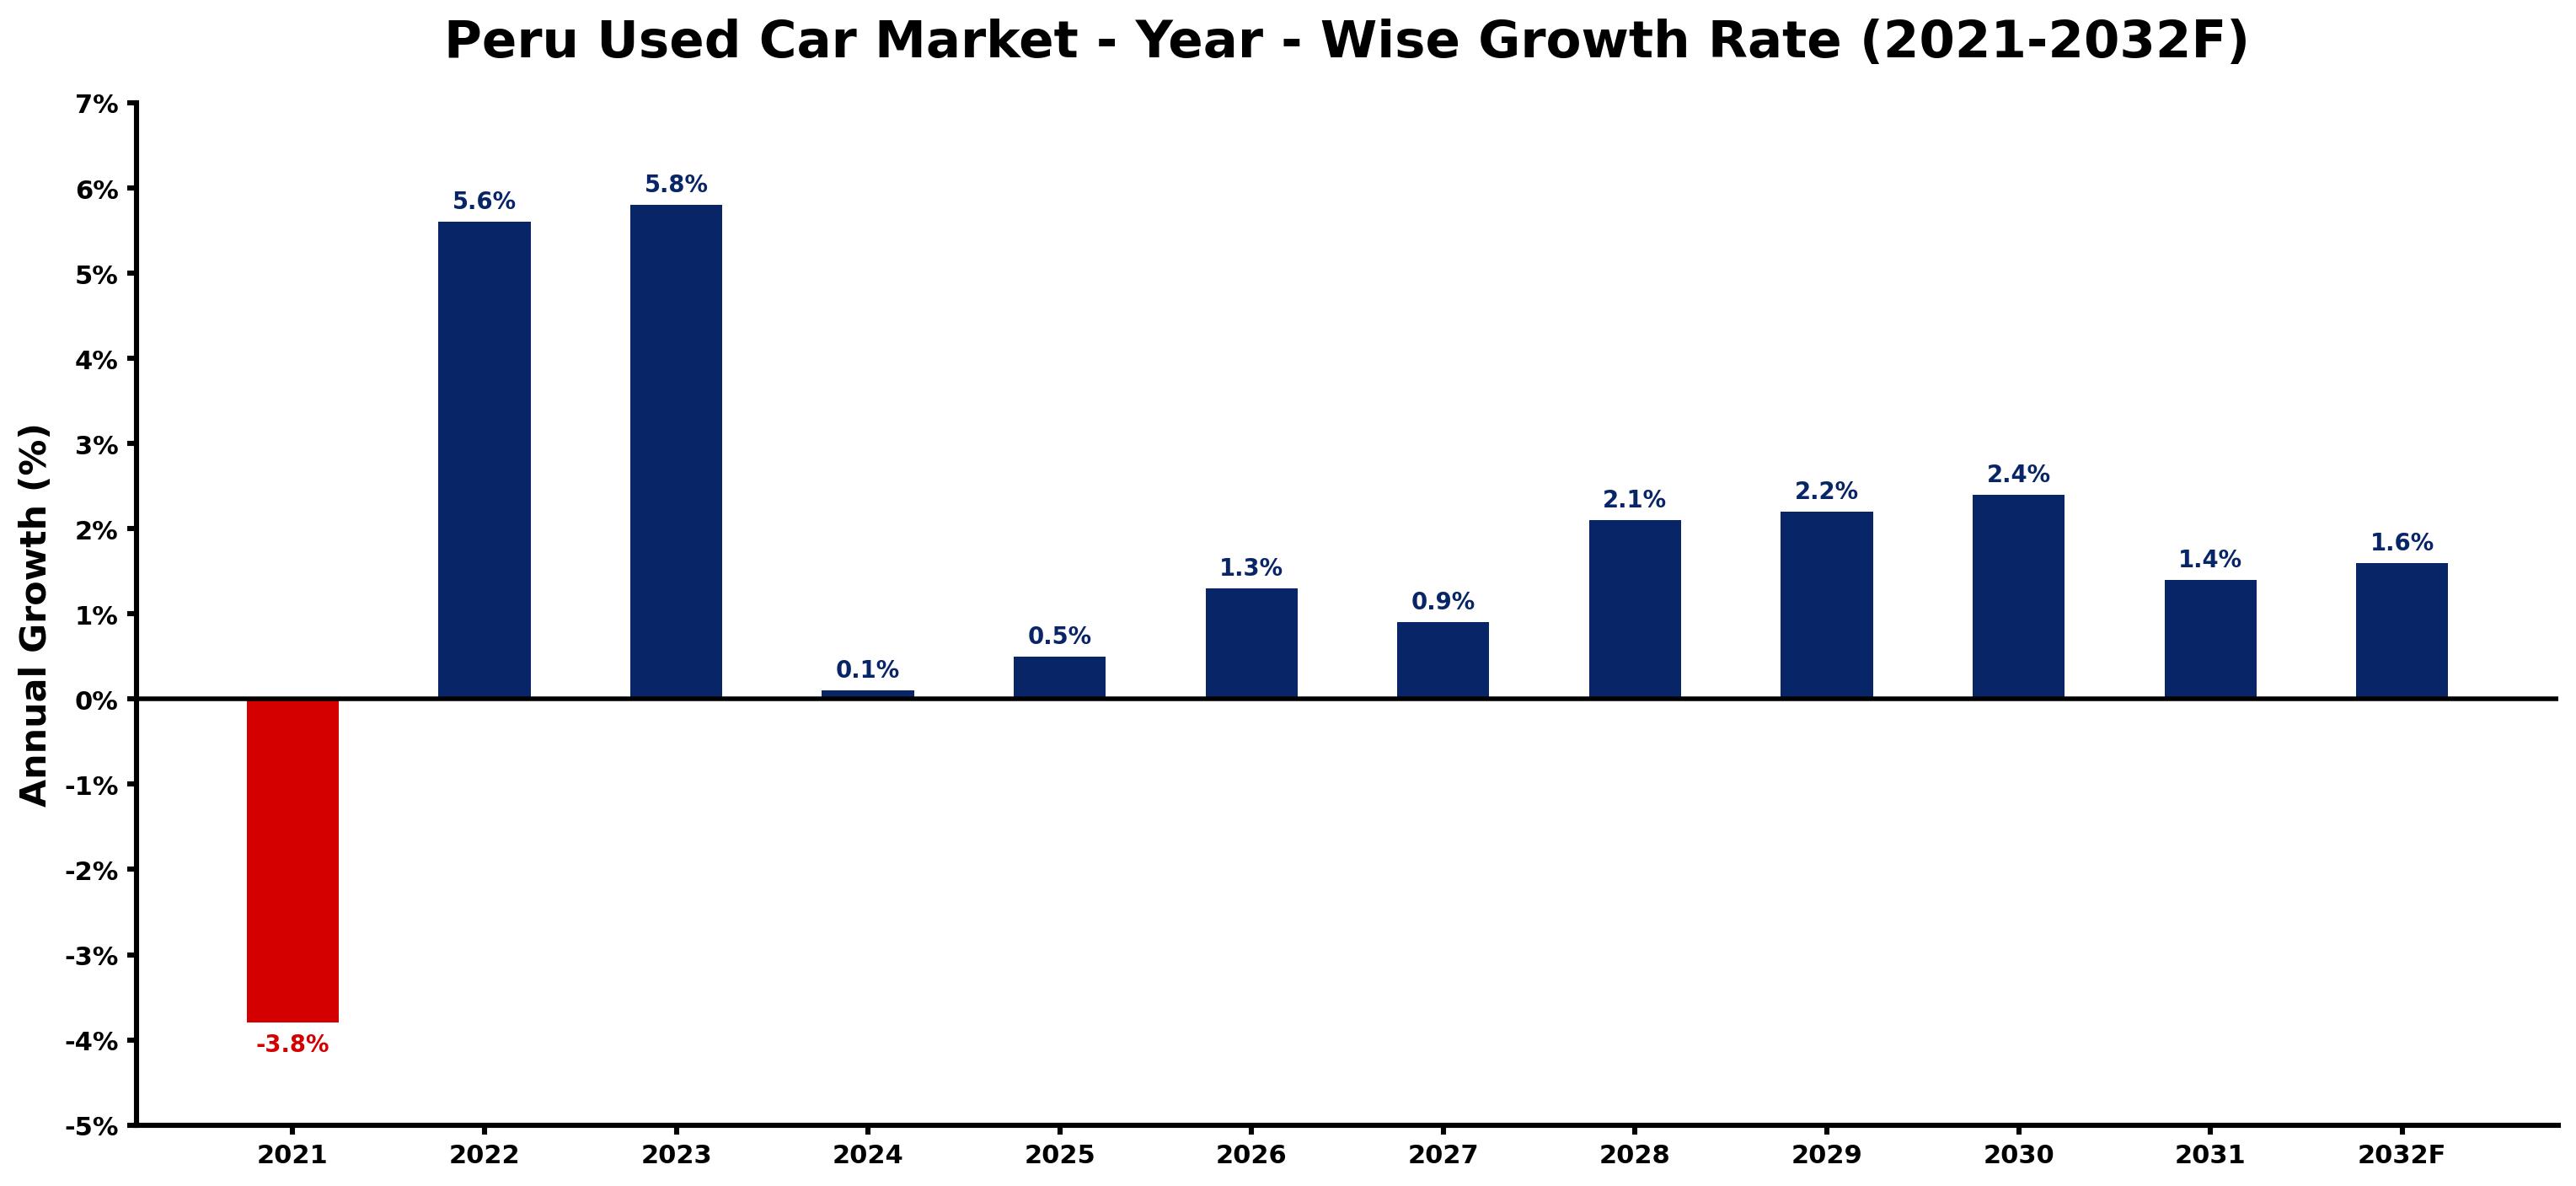
The table below presents the year wise growth rates along with the key drivers influencing the market
| Year | Growth Rate | Major Drivers |
| 2021 | -3.8% | Economic instability led to reduced disposable income, significantly impacting used car sales in Peru. |
| 2022 | 5.6% | A shift towards online platforms makes buying used cars more convenient. |
| 2023 | 5.8% | Increased urbanization drives demand for affordable and compact used vehicles. |
| 2024 | 0.1% | Rising fuel prices encourage buyers to seek more fuel-efficient options. |
| 2025 | 0.5% | Financial institutions begin offering more accessible loans for used car purchases. |
| 2026 | 1.3% | An influx of imported used cars expands the available inventory significantly. |
| 2027 | 0.9% | Technological integration in dealerships enhances customer experience and sales processes. |
| 2028 | 2.1% | Environmental awareness prompts buyers to consider electric and hybrid used models. |
| 2029 | 2.2% | Population growth in major cities accelerates the search for reliable transportation. |
| 2030 | 2.4% | Local automotive regulations promote transparency in used car transaction processes. |
| 2031 | 1.4% | Collaborations between dealerships and digital platforms streamline vehicle listings effectively. |
| 2032 | 1.6% | Increasing confidence in used car quality improves overall market reliability and trust. |
Note - Market size estimations and growth projections presented in this report are based on 6Wresearch's advanced forecasting approach, validated with industry datasets as of June 2026.
Peru Used Car Market Synopsis
The Peru Used Car Market is projected to reach 1.3% and witness significant growth during the forecast period (2026-2032). This market is influenced by several dynamic factors, including economic conditions, shifting consumer preferences, and the availability of a diverse range of vehicles. As urbanization continues to escalate and the middle class expands, the demand for reliable and affordable transportation solutions is expected to rise significantly. Used cars have emerged as a popular choice for many Peruvians, primarily due to their lower price points compared to new vehicles, creating a competitive landscape filled with numerous options for consumers.
Peru Used Car Market Growth Drivers
The growth of the Peru Used Car Market can be attributed to several key drivers:
- The expanding middle class is increasingly seeking budget-friendly transportation, resulting in a heightened demand for used cars.
- Urbanization is accelerating, leading to a greater need for personal vehicles in metropolitan areas.
- Peruvian consumers are favoring pre-owned vehicles due to their affordability and potential for value retention.
- The rise of online platforms is transforming the buying experience, allowing for a broader range of choices and enhanced convenience.
- Consumer preferences are shifting towards reliable, fuel-efficient vehicles, particularly compact and subcompact cars, influenced by economic factors and sustainability concerns.
Peru Used Car Market Trends and Opportunities
Current trends within the Peru Used Car Market indicate a robust shift in consumer behavior and vehicle preferences, which present various opportunities for growth:
- There is a strong inclination towards fuel-efficient and environmentally friendly vehicles, including hybrids and electric models, driven by sustainability awareness.
- Many consumers prioritize vehicles with lower mileage and comprehensive service history, which influences their purchasing decisions.
- The COVID-19 pandemic has led to an increased focus on budget-friendly options, pushing sales towards smaller, more economical vehicles.
- Online marketplaces are gaining traction, reflecting a growing trend towards digital transactions and wider accessibility for consumers.
- This market evolution opens doors for innovative services, such as vehicle refurbishment and aftermarket upgrades, enhancing vehicle appeal and resale value.
Peru Used Car Market Challenges and Restraints
Despite the positive outlook, the Peru Used Car Market faces several challenges that may impede its growth:
- A significant challenge is the lack of transparency regarding vehicle history, raising concerns about hidden damages and fraudulent practices among potential buyers.
- Older vehicles with high mileage dominate the market, affecting overall quality and consumer trust.
- Limited financing options hinder access to used cars, making it challenging for many buyers to make purchases.
- Uncertainties stemming from non-standardized pricing can complicate negotiations, leaving consumers unsure about fair deal values.
- These issues contribute to a perceived risk associated with purchasing used vehicles, potentially stalling market growth and consumer confidence.
Peru Used Car Market Government Investment and Initiatives
The Peruvian government has implemented several measures aimed at regulating the used car market to promote sustainability and protect consumers:
- The Ministry of Transportation and Communications mandates emissions testing for all used vehicles to ensure compliance with environmental standards before sale.
- Regulatory frameworks are in place to prevent the sale of stolen or illegally imported vehicles, requiring sellers to provide documentation verifying ownership history.
- Taxation policies on used car sales serve to generate government revenue while discouraging excessive vehicle consumption.
- Investor incentives in the form of tax breaks for environmentally friendly vehicle sales could stimulate market growth.
- These initiatives aim to enhance transparency, safety, and environmental responsibility within the Peru Used Car Market.
Peru Used Car Market Latest Developments (May 2025 - June 2026)
Between May 2025 and June 2026, the Peru Used Car Market has witnessed notable developments that reflect its evolving landscape:
- Digital platforms have seen increased adoption as more consumers turn to online channels for buying and selling used vehicles, enhancing market efficiency.
- The popularity of fuel-efficient and eco-friendly vehicles has led to product diversification, with more sellers focusing on hybrid and electric options.
- Consumer education initiatives about vehicle history and maintenance have emerged as part of efforts to enhance market transparency.
- There has been a noticeable uptick in demand for compact and subcompact models, owing to their affordability amid economic fluctuations.
- Collaboration between local dealerships and online platforms has strengthened the market, providing consumers with more comprehensive choices.
Peru Used Car Market - Key Attractiveness of the Report
- 10 Years of Market Numbers
- Historical Data Starting from 2022 to 2025
- Base Year: 2025
- Forecast Data until 2032
- Key Performance Indicators Impacting the Market
- Major Upcoming Developments and Projects
Key Highlights of the Report:
- Peru Used Car Market Outlook
- Market Size of Peru Used Car Market, 2025
- Forecast of Peru Used Car Market, 2032F
- Historical Data and Forecast of Peru Used Car Revenues & Volume for the Period 2022-2032F
- Peru Used Car Market Trend Evolution
- Peru Used Car Market Drivers and Challenges
- Peru Used Car Price Trends
- Peru Used Car Porter's Five Forces
- Peru Used Car Industry Life Cycle
- Historical Data and Forecast of Peru Used Car Market Revenues & Volume By Vehicle Type for the Period 2022-2032F
- Historical Data and Forecast of Peru Used Car Market Revenues & Volume By Hatchbacks for the Period 2022-2032F
- Historical Data and Forecast of Peru Used Car Market Revenues & Volume By Sedan for the Period 2022-2032F
- Historical Data and Forecast of Peru Used Car Market Revenues & Volume By Sports Utility Vehicle for the Period 2022-2032F
- Historical Data and Forecast of Peru Used Car Market Revenues & Volume By Others for the Period 2022-2032F
- Historical Data and Forecast of Peru Used Car Market Revenues & Volume By Vendor for the Period 2022-2032F
- Historical Data and Forecast of Peru Used Car Market Revenues & Volume By Organized for the Period 2022-2032F
- Historical Data and Forecast of Peru Used Car Market Revenues & Volume By Unorganized for the Period 2022-2032F
- Historical Data and Forecast of Peru Used Car Market Revenues & Volume By Fuel Type for the Period 2022-2032F
- Historical Data and Forecast of Peru Used Car Market Revenues & Volume By Gasoline for the Period 2022-2032F
- Historical Data and Forecast of Peru Used Car Market Revenues & Volume By Diesel for the Period 2022-2032F
- Historical Data and Forecast of Peru Used Car Market Revenues & Volume By Alternative Fuel Vehicles for the Period 2022-2032F
- Peru Used Car Import Export Trade Statistics
- Market Opportunity Assessment By Vehicle Type
- Market Opportunity Assessment By Vendor
- Market Opportunity Assessment By Fuel Type
- Peru Used Car Top Companies Market Share
- Peru Used Car Competitive Benchmarking By Technical and Operational Parameters
- Peru Used Car Company Profiles
- Peru Used Car Key Strategic Recommendations
Frequently Asked Questions About the Market Study (FAQs):
Key growth factors include rising urbanization, expanding middle class, increasing preferences for affordable transportation, and the growing popularity of online car marketplaces.
The government enforces emissions testing, ownership documentation requirements, and taxation policies to ensure environmental compliance and consumer protection.
Challenges include a lack of transparency in vehicle history, the prevalence of older high-mileage vehicles, limited financing options, and non-standardized pricing.
Trends include increasing demand for fuel-efficient and eco-friendly vehicles, growing online sales platforms, and a shift towards compact cars as consumers seek budget-friendly options.
6Wresearch actively monitors the Peru Used Car Market and publishes its comprehensive annual report, highlighting emerging trends, growth drivers, revenue analysis, and forecast outlook. Our insights help businesses to make data-backed strategic decisions with ongoing market dynamics. Our analysts track relevent industries related to the Peru Used Car Market, allowing our clients with actionable intelligence and reliable forecasts tailored to emerging regional needs.
Yes, we provide customisation as per your requirements. To learn more, feel free to contact us on sales@6wresearch.com
1 Executive Summary |
2 Introduction |
2.1 Key Highlights of the Report |
2.2 Report Description |
2.3 Market Scope & Segmentation |
2.4 Research Methodology |
2.5 Assumptions |
3 Peru Used Car Market Overview |
3.1 Peru Country Macro Economic Indicators |
3.2 Peru Used Car Market Revenues & Volume, 2022 & 2032F |
3.3 Peru Used Car Market - Industry Life Cycle |
3.4 Peru Used Car Market - Porter's Five Forces |
3.5 Peru Used Car Market Revenues & Volume Share, By Vehicle Type, 2022 & 2032F |
3.6 Peru Used Car Market Revenues & Volume Share, By Vendor, 2022 & 2032F |
3.7 Peru Used Car Market Revenues & Volume Share, By Fuel Type, 2022 & 2032F |
4 Peru Used Car Market Dynamics |
4.1 Impact Analysis |
4.2 Market Drivers |
4.2.1 Increasing demand for affordable transportation options in Peru |
4.2.2 Rising popularity of online platforms for buying and selling used cars |
4.2.3 Growth in the availability of financing options for used car purchases |
4.3 Market Restraints |
4.3.1 Economic instability impacting consumer purchasing power |
4.3.2 Lack of trust in the quality and reliability of used cars |
4.3.3 Limited access to reliable information on the history and condition of used cars |
5 Peru Used Car Market Trends |
6 Peru Used Car Market, By Types |
6.1 Peru Used Car Market, By Vehicle Type |
6.1.1 Overview and Analysis |
6.1.2 Peru Used Car Market Revenues & Volume, By Vehicle Type, 2022-2032F |
6.1.3 Peru Used Car Market Revenues & Volume, By Hatchbacks, 2022-2032F |
6.1.4 Peru Used Car Market Revenues & Volume, By Sedan, 2022-2032F |
6.1.5 Peru Used Car Market Revenues & Volume, By Sports Utility Vehicle, 2022-2032F |
6.1.6 Peru Used Car Market Revenues & Volume, By Others, 2022-2032F |
6.2 Peru Used Car Market, By Vendor |
6.2.1 Overview and Analysis |
6.2.2 Peru Used Car Market Revenues & Volume, By Organized, 2022-2032F |
6.2.3 Peru Used Car Market Revenues & Volume, By Unorganized, 2022-2032F |
6.3 Peru Used Car Market, By Fuel Type |
6.3.1 Overview and Analysis |
6.3.2 Peru Used Car Market Revenues & Volume, By Gasoline, 2022-2032F |
6.3.3 Peru Used Car Market Revenues & Volume, By Diesel, 2022-2032F |
6.3.4 Peru Used Car Market Revenues & Volume, By Alternative Fuel Vehicles, 2022-2032F |
7 Peru Used Car Market Import-Export Trade Statistics |
7.1 Peru Used Car Market Export to Major Countries |
7.2 Peru Used Car Market Imports from Major Countries |
8 Peru Used Car Market Key Performance Indicators |
8.1 Average age of used cars sold in Peru |
8.2 Percentage of used car sales conducted through online platforms |
8.3 Number of financial institutions offering used car financing options |
9 Peru Used Car Market - Opportunity Assessment |
9.1 Peru Used Car Market Opportunity Assessment, By Vehicle Type, 2022 & 2032F |
9.2 Peru Used Car Market Opportunity Assessment, By Vendor, 2022 & 2032F |
9.3 Peru Used Car Market Opportunity Assessment, By Fuel Type, 2022 & 2032F |
10 Peru Used Car Market - Competitive Landscape |
10.1 Peru Used Car Market Revenue Share, By Companies, 2025 |
10.2 Peru Used Car Market Competitive Benchmarking, By Operating and Technical Parameters |
11 Company Profiles |
12 Recommendations |
13 Disclaimer |
Global Go To Market Strategy - 2030
Export potential enables firms to identify high-growth global markets with greater confidence by combining advanced trade intelligence with a structured quantitative methodology. The framework analyzes emerging demand trends and country-level import patterns while integrating macroeconomic and trade datasets such as GDP and population forecasts, bilateral import–export flows, tariff structures, elasticity differentials between developed and developing economies, geographic distance, and import demand projections. Using weighted trade values from 2020–2024 as the base period to project country-to-country export potential for 2030, these inputs are operationalized through calculated drivers such as gravity model parameters, tariff impact factors, and projected GDP per-capita growth. Through an analysis of hidden potentials, demand hotspots, and market conditions that are most favorable to success, this method enables firms to focus on target countries, maximize returns, and global expansion with data, backed by accuracy.
By factoring in the projected importer demand gap that is currently unmet and could be potential opportunity, it identifies the potential for the Exporter (Country) among 190 countries, against the general trade analysis, which identifies the biggest importer or exporter.
To discover high-growth global markets and optimize your business strategy:
Click Here
Pricing
- Single User License$ 1,995
- Department License$ 2,400
- Site License$ 3,120
- Global License$ 3,795

Leadership Perspectives from Industry Events
Search
Thought Leadership and Analyst Meet


Our Clients
6WResearch In News
- India Air Conditioner Market Set for Strong Rebound in 2026 After Weather-Led Correction and GST-Driven Recovery: 6Wresearch
- ADAS in India: How Automatic Emergency Braking, Blind Spot Detection & Driver Monitoring are Transforming Road Safety
- Doha a strategic location for EV manufacturing hub: IPA Qatar
- Demand for luxury TVs surging in the GCC, says Samsung
- Empowering Growth: The Thriving Journey of Bangladesh’s Cable Industry
- Demand for luxury TVs surging in the GCC, says Samsung
Latest Reports
- Poland Fire Protection Systems Market (2026-2032)
- Cape Verde Portable Hand-Thrown Extinguisher Market (2026-2032)
- Canada Portable Hand-Thrown Extinguisher Market (2026-2032)
- Cameroon Portable Hand-Thrown Extinguisher Market (2026-2032)
- Burundi Portable Hand-Thrown Extinguisher Market (2026-2032)
- Burkina Faso Portable Hand-Thrown Extinguisher Market (2026-2032)
- Bulgaria Portable Hand-Thrown Extinguisher Market (2026-2032)
- Brunei Portable Hand-Thrown Extinguisher Market (2026-2032)
- Botswana Portable Hand-Thrown Extinguisher Market (2026-2032)
- Bosnia and Herzegovina Portable Hand-Thrown Extinguisher Market (2026-2032)
Industry Events and Analyst Meet

HIMTEX 2026

India Refining Summit 2026

India EV Show 2026

EV tech India Expo 2026

Auto Tech Asia 2026
Whitepaper
- Middle East & Africa Commercial Security Market Click here to view more.
- Middle East & Africa Fire Safety Systems & Equipment Market Click here to view more.
- GCC Drone Market Click here to view more.
- Middle East Lighting Fixture Market Click here to view more.
- GCC Physical & Perimeter Security Market Click here to view more.