Portugal Rice Polisher Market (2026-2032) | Forecast, Opportunities, Strategy, Segmentation, Challenges, Investment Trends, Size, Share, Growth, Trends, Strategic Insights, Outlook, Drivers, Revenue, Value, Pricing Analysis, Supply, Competitive, Analysis, Consumer Insights, Companies, Industry, Segments, Competition, Restraints, Demand
Market Forecast By Type (Horizontal, Vertical, Dry Type, Wet Type, Hybrid), By Technology (Abrasive Roller, Jet Air, Friction-Based, Water Jet, Hybrid Technology), By Application (White Rice Polishing, Brown Rice Polishing, Specialty Rice, Organic Rice, Export Quality Rice), By End-Use (Rice Milling, Food Processing, Agriculture, Food & Beverage, Retail & Consumer) And Competitive Landscape
| Product Code: ETC10447318 | Publication Date: Apr 2025 | Updated Date: Apr 2026 | Product Type: Market Research Report | |
| Publisher: 6Wresearch | Author: Bhawna Singh | No. of Pages: 65 | No. of Figures: 34 | No. of Tables: 19 |
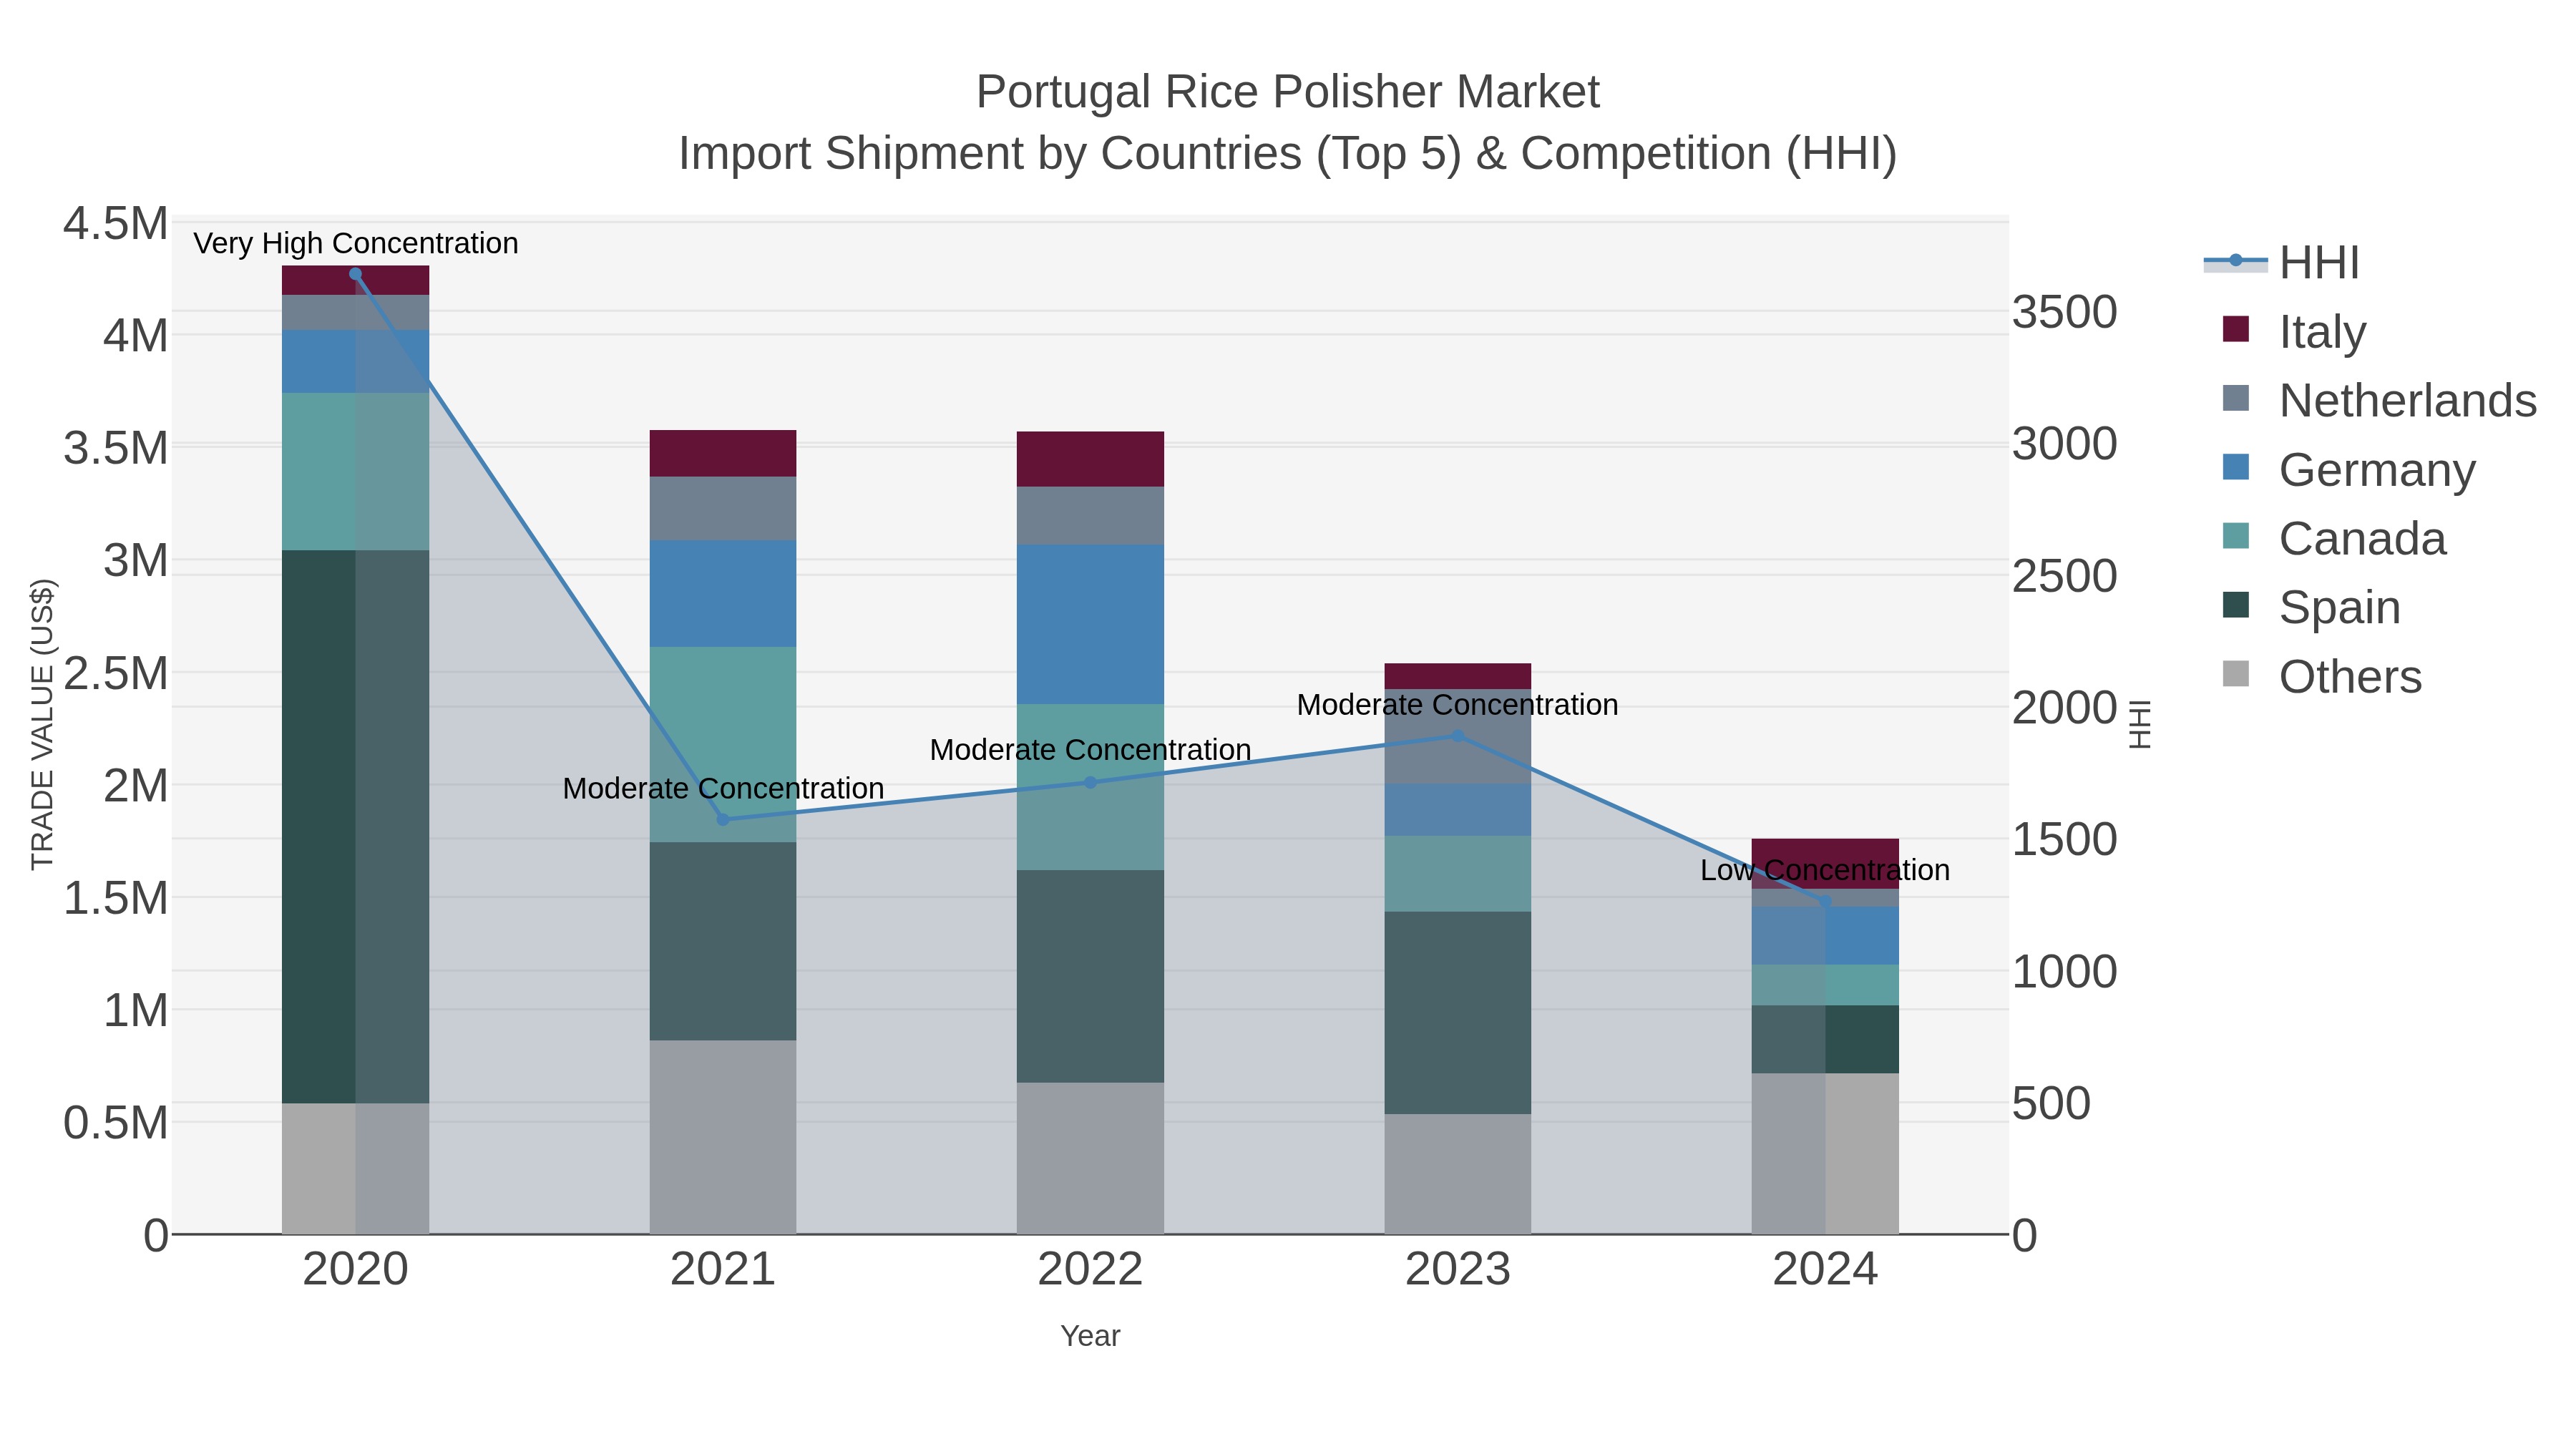
Portugal Rice Polisher Market Top 5 Importing Countries and Market Competition (HHI) Analysis
Portugal`s rice polisher import shipments in 2024 were primarily sourced from Spain, UK, Germany, Italy, and Denmark. The market exhibited a shift from moderate to low concentration, indicating increased diversification among suppliers. The compound annual growth rate (CAGR) for 2020-2024 was -20.04%, with a significant decline in the growth rate from 2023 to 2024 at -30.7%. These trends suggest a dynamic market environment with evolving supplier dynamics impacting the import landscape for rice polishers in Portugal.
Key Highlights of the Report:
- Portugal Rice Polisher Market Outlook
- Market Size of Portugal Rice Polisher Market, 2025
- Forecast of Portugal Rice Polisher Market, 2032
- Historical Data and Forecast of Portugal Rice Polisher Revenues & Volume for the Period 2022 - 2032F
- Portugal Rice Polisher Market Trend Evolution
- Portugal Rice Polisher Market Drivers and Challenges
- Portugal Rice Polisher Price Trends
- Portugal Rice Polisher Porter's Five Forces
- Portugal Rice Polisher Industry Life Cycle
- Historical Data and Forecast of Portugal Rice Polisher Market Revenues & Volume By Type for the Period 2022 - 2032F
- Historical Data and Forecast of Portugal Rice Polisher Market Revenues & Volume By Horizontal for the Period 2022 - 2032F
- Historical Data and Forecast of Portugal Rice Polisher Market Revenues & Volume By Vertical for the Period 2022 - 2032F
- Historical Data and Forecast of Portugal Rice Polisher Market Revenues & Volume By Dry Type for the Period 2022 - 2032F
- Historical Data and Forecast of Portugal Rice Polisher Market Revenues & Volume By Wet Type for the Period 2022 - 2032F
- Historical Data and Forecast of Portugal Rice Polisher Market Revenues & Volume By Hybrid for the Period 2022 - 2032F
- Historical Data and Forecast of Portugal Rice Polisher Market Revenues & Volume By Technology for the Period 2022 - 2032F
- Historical Data and Forecast of Portugal Rice Polisher Market Revenues & Volume By Abrasive Roller for the Period 2022 - 2032F
- Historical Data and Forecast of Portugal Rice Polisher Market Revenues & Volume By Jet Air for the Period 2022 - 2032F
- Historical Data and Forecast of Portugal Rice Polisher Market Revenues & Volume By Friction-Based for the Period 2022 - 2032F
- Historical Data and Forecast of Portugal Rice Polisher Market Revenues & Volume By Water Jet for the Period 2022 - 2032F
- Historical Data and Forecast of Portugal Rice Polisher Market Revenues & Volume By Hybrid Technology for the Period 2022 - 2032F
- Historical Data and Forecast of Portugal Rice Polisher Market Revenues & Volume By Application for the Period 2022 - 2032F
- Historical Data and Forecast of Portugal Rice Polisher Market Revenues & Volume By White Rice Polishing for the Period 2022 - 2032F
- Historical Data and Forecast of Portugal Rice Polisher Market Revenues & Volume By Brown Rice Polishing for the Period 2022 - 2032F
- Historical Data and Forecast of Portugal Rice Polisher Market Revenues & Volume By Specialty Rice for the Period 2022 - 2032F
- Historical Data and Forecast of Portugal Rice Polisher Market Revenues & Volume By Organic Rice for the Period 2022 - 2032F
- Historical Data and Forecast of Portugal Rice Polisher Market Revenues & Volume By Export Quality Rice for the Period 2022 - 2032F
- Historical Data and Forecast of Portugal Rice Polisher Market Revenues & Volume By End-Use for the Period 2022 - 2032F
- Historical Data and Forecast of Portugal Rice Polisher Market Revenues & Volume By Rice Milling for the Period 2022 - 2032F
- Historical Data and Forecast of Portugal Rice Polisher Market Revenues & Volume By Food Processing for the Period 2022 - 2032F
- Historical Data and Forecast of Portugal Rice Polisher Market Revenues & Volume By Agriculture for the Period 2022 - 2032F
- Historical Data and Forecast of Portugal Rice Polisher Market Revenues & Volume By Food & Beverage for the Period 2022 - 2032F
- Historical Data and Forecast of Portugal Rice Polisher Market Revenues & Volume By Retail & Consumer for the Period 2022 - 2032F
- Portugal Rice Polisher Import Export Trade Statistics
- Market Opportunity Assessment By Type
- Market Opportunity Assessment By Technology
- Market Opportunity Assessment By Application
- Market Opportunity Assessment By End-Use
- Portugal Rice Polisher Top Companies Market Share
- Portugal Rice Polisher Competitive Benchmarking By Technical and Operational Parameters
- Portugal Rice Polisher Company Profiles
- Portugal Rice Polisher Key Strategic Recommendations
Frequently Asked Questions About the Market Study (FAQs):
6Wresearch actively monitors the Portugal Rice Polisher Market and publishes its comprehensive annual report, highlighting emerging trends, growth drivers, revenue analysis, and forecast outlook. Our insights help businesses to make data-backed strategic decisions with ongoing market dynamics. Our analysts track relevent industries related to the Portugal Rice Polisher Market, allowing our clients with actionable intelligence and reliable forecasts tailored to emerging regional needs.
Yes, we provide customisation as per your requirements. To learn more, feel free to contact us on sales@6wresearch.com
1 Executive Summary |
2 Introduction |
2.1 Key Highlights of the Report |
2.2 Report Description |
2.3 Market Scope & Segmentation |
2.4 Research Methodology |
2.5 Assumptions |
3 Portugal Rice Polisher Market Overview |
3.1 Portugal Country Macro Economic Indicators |
3.2 Portugal Rice Polisher Market Revenues & Volume, 2022 & 2032F |
3.3 Portugal Rice Polisher Market - Industry Life Cycle |
3.4 Portugal Rice Polisher Market - Porter's Five Forces |
3.5 Portugal Rice Polisher Market Revenues & Volume Share, By Type, 2022 & 2032F |
3.6 Portugal Rice Polisher Market Revenues & Volume Share, By Technology, 2022 & 2032F |
3.7 Portugal Rice Polisher Market Revenues & Volume Share, By Application, 2022 & 2032F |
3.8 Portugal Rice Polisher Market Revenues & Volume Share, By End-Use, 2022 & 2032F |
4 Portugal Rice Polisher Market Dynamics |
4.1 Impact Analysis |
4.2 Market Drivers |
4.2.1 Increasing demand for polished rice in Portugal due to changing consumer preferences towards healthier food choices. |
4.2.2 Growing awareness about the benefits of polished rice, such as better appearance, improved texture, and longer shelf life. |
4.2.3 Technological advancements in rice polishing machinery leading to higher efficiency and quality output. |
4.3 Market Restraints |
4.3.1 Fluctuating raw material prices impacting the overall production cost of rice polishing. |
4.3.2 Competition from alternative grains and food products affecting the market share of polished rice. |
4.3.3 Stringent government regulations regarding food safety and quality standards. |
5 Portugal Rice Polisher Market Trends |
6 Portugal Rice Polisher Market, By Types |
6.1 Portugal Rice Polisher Market, By Type |
6.1.1 Overview and Analysis |
6.1.2 Portugal Rice Polisher Market Revenues & Volume, By Type, 2022 - 2032F |
6.1.3 Portugal Rice Polisher Market Revenues & Volume, By Horizontal, 2022 - 2032F |
6.1.4 Portugal Rice Polisher Market Revenues & Volume, By Vertical, 2022 - 2032F |
6.1.5 Portugal Rice Polisher Market Revenues & Volume, By Dry Type, 2022 - 2032F |
6.1.6 Portugal Rice Polisher Market Revenues & Volume, By Wet Type, 2022 - 2032F |
6.1.7 Portugal Rice Polisher Market Revenues & Volume, By Hybrid, 2022 - 2032F |
6.2 Portugal Rice Polisher Market, By Technology |
6.2.1 Overview and Analysis |
6.2.2 Portugal Rice Polisher Market Revenues & Volume, By Abrasive Roller, 2022 - 2032F |
6.2.3 Portugal Rice Polisher Market Revenues & Volume, By Jet Air, 2022 - 2032F |
6.2.4 Portugal Rice Polisher Market Revenues & Volume, By Friction-Based, 2022 - 2032F |
6.2.5 Portugal Rice Polisher Market Revenues & Volume, By Water Jet, 2022 - 2032F |
6.2.6 Portugal Rice Polisher Market Revenues & Volume, By Hybrid Technology, 2022 - 2032F |
6.3 Portugal Rice Polisher Market, By Application |
6.3.1 Overview and Analysis |
6.3.2 Portugal Rice Polisher Market Revenues & Volume, By White Rice Polishing, 2022 - 2032F |
6.3.3 Portugal Rice Polisher Market Revenues & Volume, By Brown Rice Polishing, 2022 - 2032F |
6.3.4 Portugal Rice Polisher Market Revenues & Volume, By Specialty Rice, 2022 - 2032F |
6.3.5 Portugal Rice Polisher Market Revenues & Volume, By Organic Rice, 2022 - 2032F |
6.3.6 Portugal Rice Polisher Market Revenues & Volume, By Export Quality Rice, 2022 - 2032F |
6.4 Portugal Rice Polisher Market, By End-Use |
6.4.1 Overview and Analysis |
6.4.2 Portugal Rice Polisher Market Revenues & Volume, By Rice Milling, 2022 - 2032F |
6.4.3 Portugal Rice Polisher Market Revenues & Volume, By Food Processing, 2022 - 2032F |
6.4.4 Portugal Rice Polisher Market Revenues & Volume, By Agriculture, 2022 - 2032F |
6.4.5 Portugal Rice Polisher Market Revenues & Volume, By Food & Beverage, 2022 - 2032F |
6.4.6 Portugal Rice Polisher Market Revenues & Volume, By Retail & Consumer, 2022 - 2032F |
7 Portugal Rice Polisher Market Import-Export Trade Statistics |
7.1 Portugal Rice Polisher Market Export to Major Countries |
7.2 Portugal Rice Polisher Market Imports from Major Countries |
8 Portugal Rice Polisher Market Key Performance Indicators |
8.1 Percentage increase in adoption of automated rice polishing machines in Portugal. |
8.2 Average time taken for rice polishing process, indicating operational efficiency. |
8.3 Percentage improvement in rice polishing quality standards as per regulatory requirements. |
8.4 Rate of new product development and innovation in the rice polishing industry. |
8.5 Customer satisfaction levels with polished rice quality and packaging. |
9 Portugal Rice Polisher Market - Opportunity Assessment |
9.1 Portugal Rice Polisher Market Opportunity Assessment, By Type, 2022 & 2032F |
9.2 Portugal Rice Polisher Market Opportunity Assessment, By Technology, 2022 & 2032F |
9.3 Portugal Rice Polisher Market Opportunity Assessment, By Application, 2022 & 2032F |
9.4 Portugal Rice Polisher Market Opportunity Assessment, By End-Use, 2022 & 2032F |
10 Portugal Rice Polisher Market - Competitive Landscape |
10.1 Portugal Rice Polisher Market Revenue Share, By Companies, 2025 |
10.2 Portugal Rice Polisher Market Competitive Benchmarking, By Operating and Technical Parameters |
11 Company Profiles |
12 Recommendations |
13 Disclaimer |
Export potential assessment - trade Analytics for 2030
Export potential enables firms to identify high-growth global markets with greater confidence by combining advanced trade intelligence with a structured quantitative methodology. The framework analyzes emerging demand trends and country-level import patterns while integrating macroeconomic and trade datasets such as GDP and population forecasts, bilateral import–export flows, tariff structures, elasticity differentials between developed and developing economies, geographic distance, and import demand projections. Using weighted trade values from 2020–2024 as the base period to project country-to-country export potential for 2030, these inputs are operationalized through calculated drivers such as gravity model parameters, tariff impact factors, and projected GDP per-capita growth. Through an analysis of hidden potentials, demand hotspots, and market conditions that are most favorable to success, this method enables firms to focus on target countries, maximize returns, and global expansion with data, backed by accuracy.
By factoring in the projected importer demand gap that is currently unmet and could be potential opportunity, it identifies the potential for the Exporter (Country) among 190 countries, against the general trade analysis, which identifies the biggest importer or exporter.
To discover high-growth global markets and optimize your business strategy:
Click Here
Pricing
- Single User License$ 1,995
- Department License$ 2,400
- Site License$ 3,120
- Global License$ 3,795

Thought Leadership
Search
Thought Leadership and Analyst Meet


Our Clients
Latest Reports
- New Zealand Aseptic Manufacturing Market (2026-2032)
- Netherlands Aseptic Manufacturing Market (2026-2032)
- Nauru Aseptic Manufacturing Market (2026-2032)
- Namibia Aseptic Manufacturing Market (2026-2032)
- Mozambique Aseptic Manufacturing Market (2026-2032)
- Montenegro Aseptic Manufacturing Market (2026-2032)
- Mongolia Aseptic Manufacturing Market (2026-2032)
- Monaco Aseptic Manufacturing Market (2026-2032)
- Micronesia Aseptic Manufacturing Market (2026-2032)
- Mauritius Aseptic Manufacturing Market (2026-2032)
Industry Events and Analyst Meet

HIMTEX 2026

India Refining Summit 2026

India EV Show 2026

EV tech India Expo 2026

Auto Tech Asia 2026
Whitepaper
- Middle East & Africa Commercial Security Market Click here to view more.
- Middle East & Africa Fire Safety Systems & Equipment Market Click here to view more.
- GCC Drone Market Click here to view more.
- Middle East Lighting Fixture Market Click here to view more.
- GCC Physical & Perimeter Security Market Click here to view more.
6WResearch In News
- Doha a strategic location for EV manufacturing hub: IPA Qatar
- Demand for luxury TVs surging in the GCC, says Samsung
- Empowering Growth: The Thriving Journey of Bangladesh’s Cable Industry
- Demand for luxury TVs surging in the GCC, says Samsung
- Video call with a traditional healer? Once unthinkable, it’s now common in South Africa
- Intelligent Buildings To Smooth GCC’s Path To Net Zero