Portugal Water Desalination Market (2026-2032) | Forecast, Trends, Revenue, Share, Demand, Outlook, Value, Competitive, Consumer Insights, Supply, Segments, Challenges, Strategic Insights, Pricing Analysis, Strategy, Analysis, Restraints, Size, Investment Trends, Opportunities, Industry, Segmentation, Companies, Competition, Drivers, Growth
Market Forecast By Type (Thermal Desalination, Membrane Desalination, Hybrid Desalination, Electrodialysis, Vapor Compression), By Technology Used (Multi-Stage Flash (MSF), Reverse Osmosis (RO), Multiple Effect Distillation (MED), Ion-Exchange Membranes, Mechanical Compression), By End User (Municipalities, Industrial Plants, Agriculture, Power Plants, Military), By Application (Drinking Water Supply, Process Water Supply, Irrigation Water, Boiler Feed Water, Emergency Water Supply), By End Use (Professional Tattooing, Tattoo Studios) And Competitive Landscape
| Product Code: ETC11300566 | Publication Date: Apr 2025 | Updated Date: Apr 2026 | Product Type: Market Research Report | |
| Publisher: 6Wresearch | Author: Bhawna Singh | No. of Pages: 65 | No. of Figures: 34 | No. of Tables: 19 |
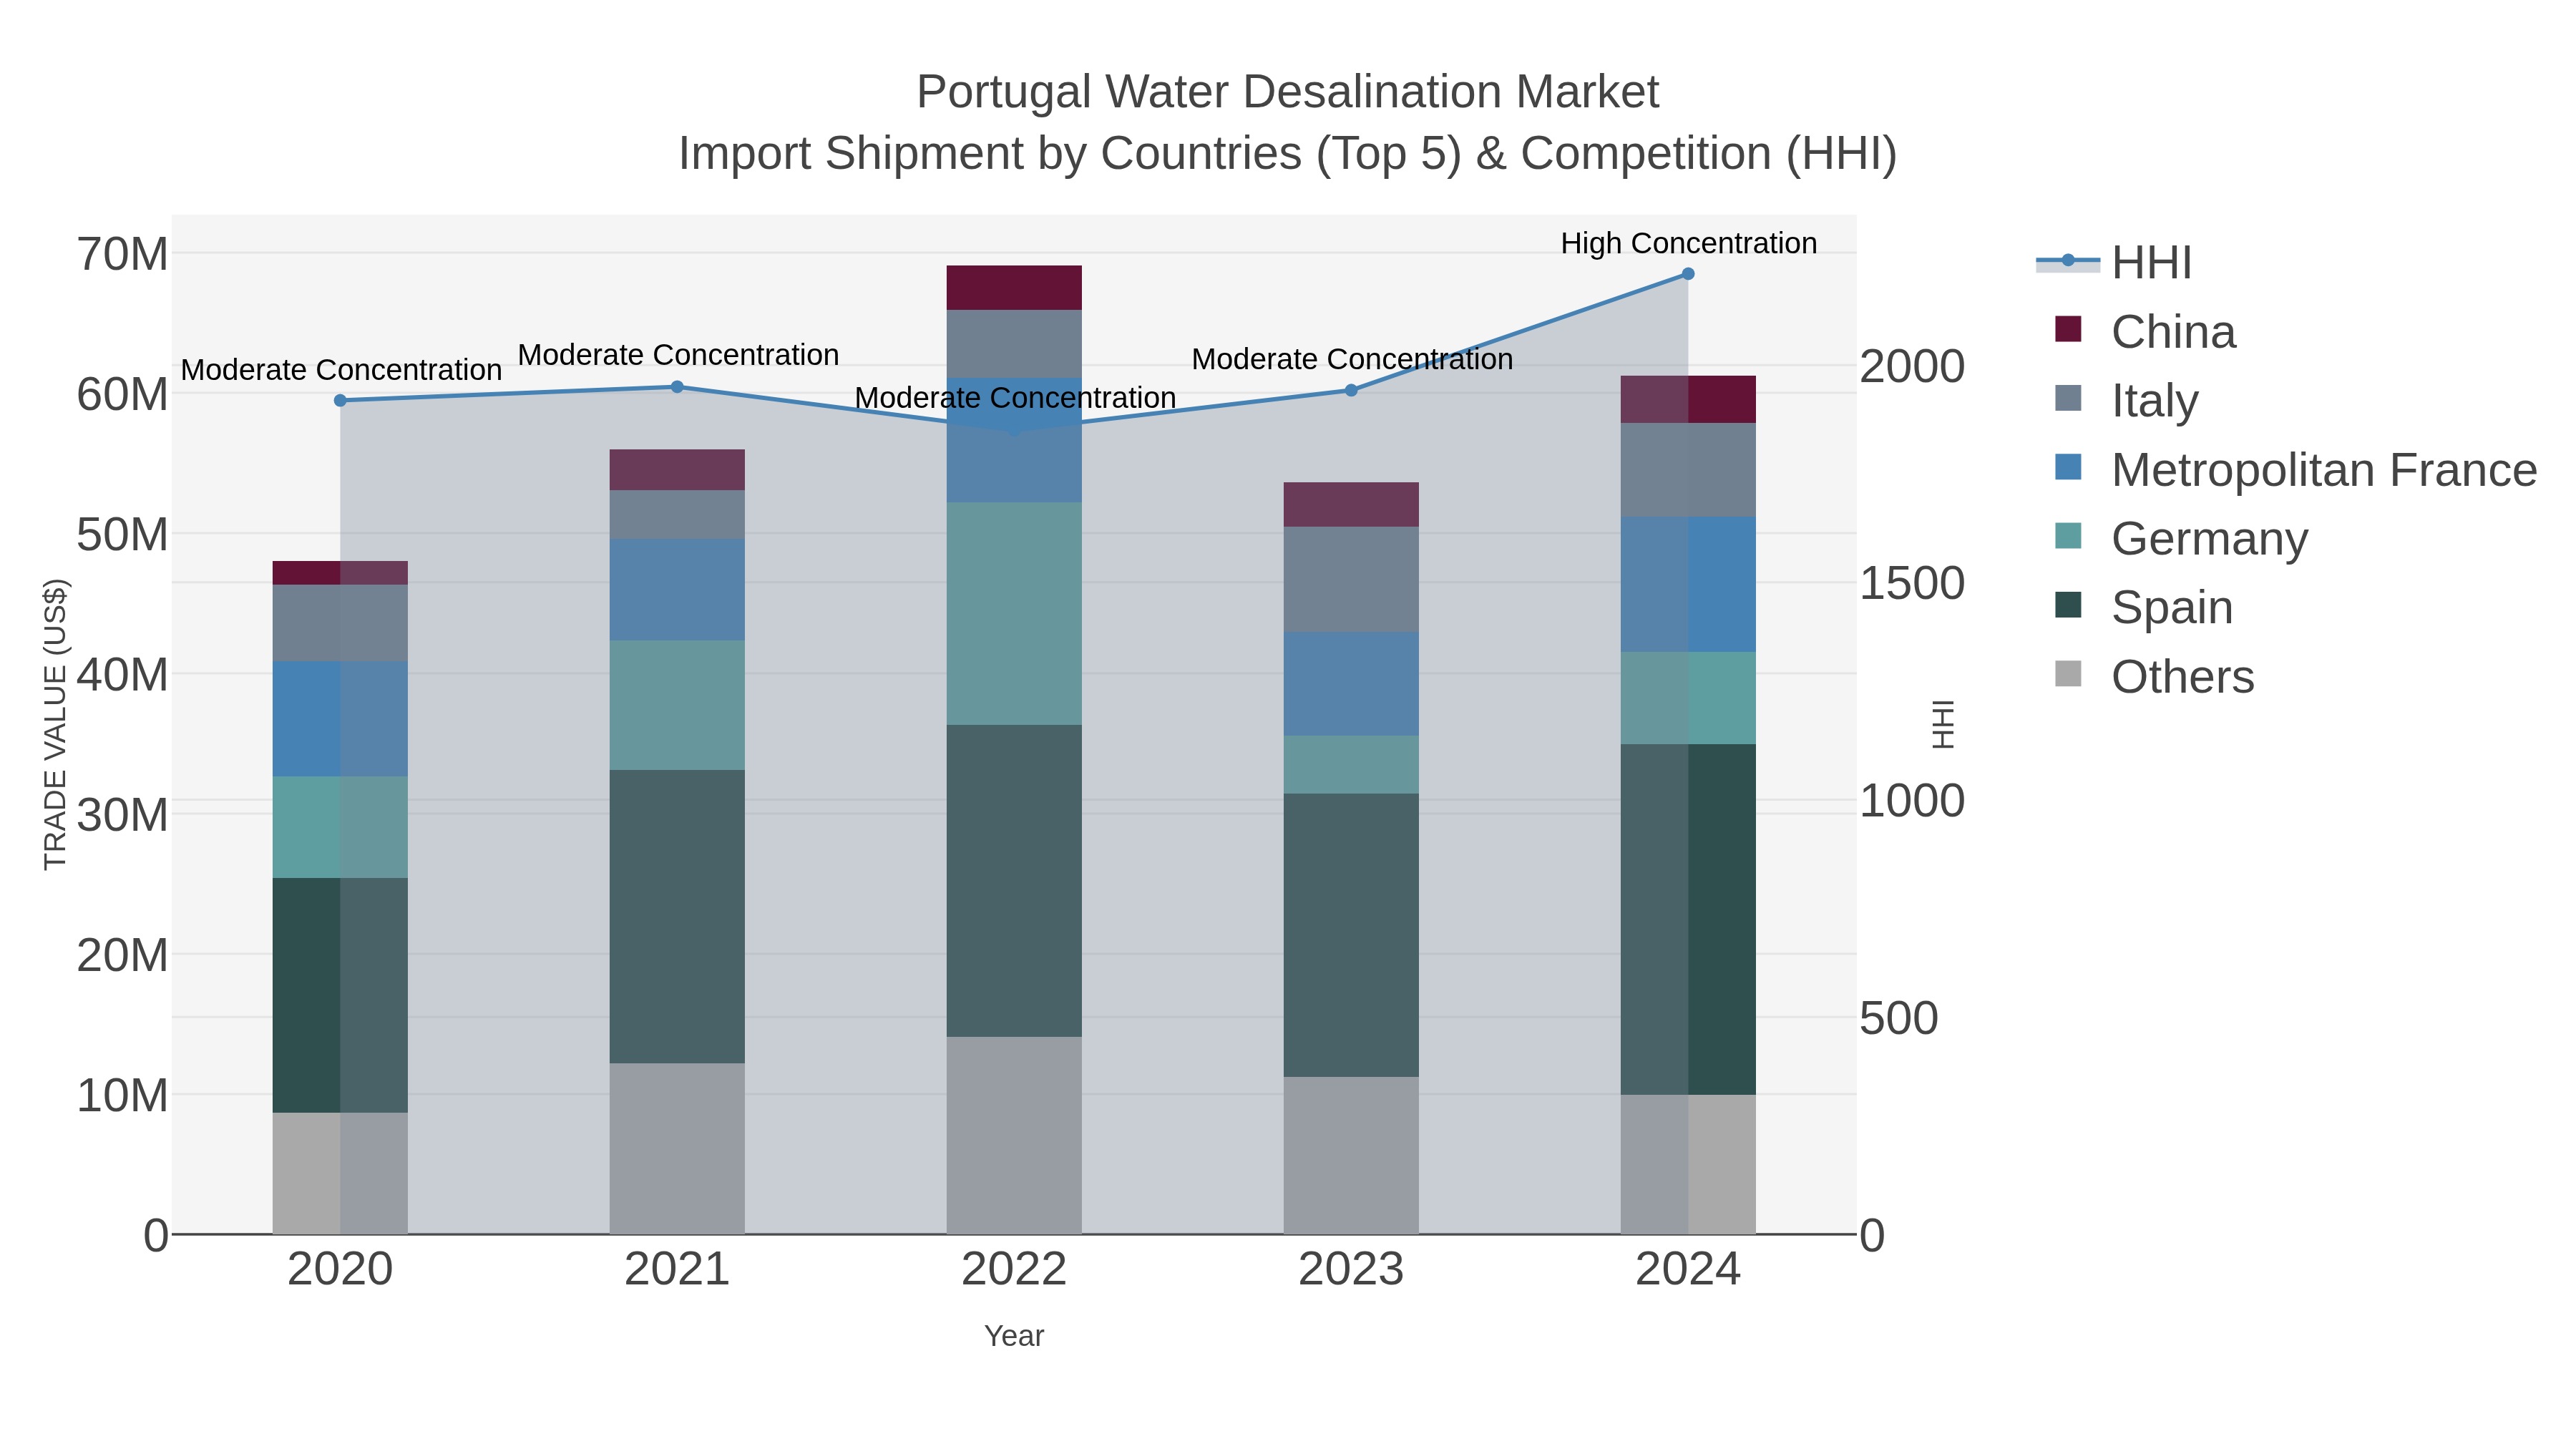
Portugal Water Desalination Market Top 5 Importing Countries and Market Competition (HHI) Analysis
Portugal`s water desalination import market saw a significant shift in concentration levels from moderate to high in 2024, indicating a more consolidated supplier base. With Spain, Metropolitan France, Italy, Germany, and China as the top exporting countries, the market is experiencing steady growth with a CAGR of 6.26% from 2020 to 2024. The impressive growth rate of 14.11% from 2023 to 2024 suggests a rising demand for water desalination solutions in Portugal, potentially driven by factors such as increasing water scarcity and environmental concerns.
Key Highlights of the Report:
- Portugal Water Desalination Market Outlook
- Market Size of Portugal Water Desalination Market, 2025
- Forecast of Portugal Water Desalination Market, 2032
- Historical Data and Forecast of Portugal Water Desalination Revenues & Volume for the Period 2022 - 2032F
- Portugal Water Desalination Market Trend Evolution
- Portugal Water Desalination Market Drivers and Challenges
- Portugal Water Desalination Price Trends
- Portugal Water Desalination Porter's Five Forces
- Portugal Water Desalination Industry Life Cycle
- Historical Data and Forecast of Portugal Water Desalination Market Revenues & Volume By Type for the Period 2022 - 2032F
- Historical Data and Forecast of Portugal Water Desalination Market Revenues & Volume By Thermal Desalination for the Period 2022 - 2032F
- Historical Data and Forecast of Portugal Water Desalination Market Revenues & Volume By Membrane Desalination for the Period 2022 - 2032F
- Historical Data and Forecast of Portugal Water Desalination Market Revenues & Volume By Hybrid Desalination for the Period 2022 - 2032F
- Historical Data and Forecast of Portugal Water Desalination Market Revenues & Volume By Electrodialysis for the Period 2022 - 2032F
- Historical Data and Forecast of Portugal Water Desalination Market Revenues & Volume By Vapor Compression for the Period 2022 - 2032F
- Historical Data and Forecast of Portugal Water Desalination Market Revenues & Volume By Technology Used for the Period 2022 - 2032F
- Historical Data and Forecast of Portugal Water Desalination Market Revenues & Volume By Multi-Stage Flash (MSF) for the Period 2022 - 2032F
- Historical Data and Forecast of Portugal Water Desalination Market Revenues & Volume By Reverse Osmosis (RO) for the Period 2022 - 2032F
- Historical Data and Forecast of Portugal Water Desalination Market Revenues & Volume By Multiple Effect Distillation (MED) for the Period 2022 - 2032F
- Historical Data and Forecast of Portugal Water Desalination Market Revenues & Volume By Ion-Exchange Membranes for the Period 2022 - 2032F
- Historical Data and Forecast of Portugal Water Desalination Market Revenues & Volume By Mechanical Compression for the Period 2022 - 2032F
- Historical Data and Forecast of Portugal Water Desalination Market Revenues & Volume By End User for the Period 2022 - 2032F
- Historical Data and Forecast of Portugal Water Desalination Market Revenues & Volume By Municipalities for the Period 2022 - 2032F
- Historical Data and Forecast of Portugal Water Desalination Market Revenues & Volume By Industrial Plants for the Period 2022 - 2032F
- Historical Data and Forecast of Portugal Water Desalination Market Revenues & Volume By Agriculture for the Period 2022 - 2032F
- Historical Data and Forecast of Portugal Water Desalination Market Revenues & Volume By Power Plants for the Period 2022 - 2032F
- Historical Data and Forecast of Portugal Water Desalination Market Revenues & Volume By Military for the Period 2022 - 2032F
- Historical Data and Forecast of Portugal Water Desalination Market Revenues & Volume By Application for the Period 2022 - 2032F
- Historical Data and Forecast of Portugal Water Desalination Market Revenues & Volume By Drinking Water Supply for the Period 2022 - 2032F
- Historical Data and Forecast of Portugal Water Desalination Market Revenues & Volume By Process Water Supply for the Period 2022 - 2032F
- Historical Data and Forecast of Portugal Water Desalination Market Revenues & Volume By Irrigation Water for the Period 2022 - 2032F
- Historical Data and Forecast of Portugal Water Desalination Market Revenues & Volume By Boiler Feed Water for the Period 2022 - 2032F
- Historical Data and Forecast of Portugal Water Desalination Market Revenues & Volume By Emergency Water Supply for the Period 2022 - 2032F
- Historical Data and Forecast of Portugal Water Desalination Market Revenues & Volume By End Use for the Period 2022 - 2032F
- Historical Data and Forecast of Portugal Water Desalination Market Revenues & Volume By Professional Tattooing for the Period 2022 - 2032F
- Historical Data and Forecast of Portugal Water Desalination Market Revenues & Volume By Tattoo Studios for the Period 2022 - 2032F
- Portugal Water Desalination Import Export Trade Statistics
- Market Opportunity Assessment By Type
- Market Opportunity Assessment By Technology Used
- Market Opportunity Assessment By End User
- Market Opportunity Assessment By Application
- Market Opportunity Assessment By End Use
- Portugal Water Desalination Top Companies Market Share
- Portugal Water Desalination Competitive Benchmarking By Technical and Operational Parameters
- Portugal Water Desalination Company Profiles
- Portugal Water Desalination Key Strategic Recommendations
Frequently Asked Questions About the Market Study (FAQs):
6Wresearch actively monitors the Portugal Water Desalination Market and publishes its comprehensive annual report, highlighting emerging trends, growth drivers, revenue analysis, and forecast outlook. Our insights help businesses to make data-backed strategic decisions with ongoing market dynamics. Our analysts track relevent industries related to the Portugal Water Desalination Market, allowing our clients with actionable intelligence and reliable forecasts tailored to emerging regional needs.
Yes, we provide customisation as per your requirements. To learn more, feel free to contact us on sales@6wresearch.com
1 Executive Summary |
2 Introduction |
2.1 Key Highlights of the Report |
2.2 Report Description |
2.3 Market Scope & Segmentation |
2.4 Research Methodology |
2.5 Assumptions |
3 Portugal Water Desalination Market Overview |
3.1 Portugal Country Macro Economic Indicators |
3.2 Portugal Water Desalination Market Revenues & Volume, 2022 & 2032F |
3.3 Portugal Water Desalination Market - Industry Life Cycle |
3.4 Portugal Water Desalination Market - Porter's Five Forces |
3.5 Portugal Water Desalination Market Revenues & Volume Share, By Type, 2022 & 2032F |
3.6 Portugal Water Desalination Market Revenues & Volume Share, By Technology Used, 2022 & 2032F |
3.7 Portugal Water Desalination Market Revenues & Volume Share, By End User, 2022 & 2032F |
3.8 Portugal Water Desalination Market Revenues & Volume Share, By Application, 2022 & 2032F |
4 Portugal Water Desalination Market Dynamics |
4.1 Impact Analysis |
4.2 Market Drivers |
4.2.1 Increasing water scarcity and drought conditions in Portugal |
4.2.2 Government initiatives and investments in water desalination projects |
4.2.3 Growing population and urbanization leading to higher water demand |
4.3 Market Restraints |
4.3.1 High initial investment costs for setting up desalination plants |
4.3.2 Environmental concerns and regulatory challenges associated with desalination projects |
4.3.3 Energy consumption and operational costs of desalination plants |
5 Portugal Water Desalination Market Trends |
6 Portugal Water Desalination Market, By Types |
6.1 Portugal Water Desalination Market, By Type |
6.1.1 Overview and Analysis |
6.1.2 Portugal Water Desalination Market Revenues & Volume, By Type, 2022 - 2032F |
6.1.3 Portugal Water Desalination Market Revenues & Volume, By Thermal Desalination, 2022 - 2032F |
6.1.4 Portugal Water Desalination Market Revenues & Volume, By Membrane Desalination, 2022 - 2032F |
6.1.5 Portugal Water Desalination Market Revenues & Volume, By Hybrid Desalination, 2022 - 2032F |
6.1.6 Portugal Water Desalination Market Revenues & Volume, By Electrodialysis, 2022 - 2032F |
6.1.7 Portugal Water Desalination Market Revenues & Volume, By Vapor Compression, 2022 - 2032F |
6.2 Portugal Water Desalination Market, By Technology Used |
6.2.1 Overview and Analysis |
6.2.2 Portugal Water Desalination Market Revenues & Volume, By Multi-Stage Flash (MSF), 2022 - 2032F |
6.2.3 Portugal Water Desalination Market Revenues & Volume, By Reverse Osmosis (RO), 2022 - 2032F |
6.2.4 Portugal Water Desalination Market Revenues & Volume, By Multiple Effect Distillation (MED), 2022 - 2032F |
6.2.5 Portugal Water Desalination Market Revenues & Volume, By Ion-Exchange Membranes, 2022 - 2032F |
6.2.6 Portugal Water Desalination Market Revenues & Volume, By Mechanical Compression, 2022 - 2032F |
6.3 Portugal Water Desalination Market, By End User |
6.3.1 Overview and Analysis |
6.3.2 Portugal Water Desalination Market Revenues & Volume, By Municipalities, 2022 - 2032F |
6.3.3 Portugal Water Desalination Market Revenues & Volume, By Industrial Plants, 2022 - 2032F |
6.3.4 Portugal Water Desalination Market Revenues & Volume, By Agriculture, 2022 - 2032F |
6.3.5 Portugal Water Desalination Market Revenues & Volume, By Power Plants, 2022 - 2032F |
6.3.6 Portugal Water Desalination Market Revenues & Volume, By Military, 2022 - 2032F |
6.4 Portugal Water Desalination Market, By Application |
6.4.1 Overview and Analysis |
6.4.2 Portugal Water Desalination Market Revenues & Volume, By Drinking Water Supply, 2022 - 2032F |
6.4.3 Portugal Water Desalination Market Revenues & Volume, By Process Water Supply, 2022 - 2032F |
6.4.4 Portugal Water Desalination Market Revenues & Volume, By Irrigation Water, 2022 - 2032F |
6.4.5 Portugal Water Desalination Market Revenues & Volume, By Boiler Feed Water, 2022 - 2032F |
6.4.6 Portugal Water Desalination Market Revenues & Volume, By Emergency Water Supply, 2022 - 2032F |
7 Portugal Water Desalination Market Import-Export Trade Statistics |
7.1 Portugal Water Desalination Market Export to Major Countries |
7.2 Portugal Water Desalination Market Imports from Major Countries |
8 Portugal Water Desalination Market Key Performance Indicators |
8.1 Water production efficiency (measured in liters of water produced per unit of energy consumed) |
8.2 Percentage of water demand met through desalination |
8.3 Level of technological advancements and innovation in desalination processes |
9 Portugal Water Desalination Market - Opportunity Assessment |
9.1 Portugal Water Desalination Market Opportunity Assessment, By Type, 2022 & 2032F |
9.2 Portugal Water Desalination Market Opportunity Assessment, By Technology Used, 2022 & 2032F |
9.3 Portugal Water Desalination Market Opportunity Assessment, By End User, 2022 & 2032F |
9.4 Portugal Water Desalination Market Opportunity Assessment, By Application, 2022 & 2032F |
10 Portugal Water Desalination Market - Competitive Landscape |
10.1 Portugal Water Desalination Market Revenue Share, By Companies, 2025 |
10.2 Portugal Water Desalination Market Competitive Benchmarking, By Operating and Technical Parameters |
11 Company Profiles |
12 Recommendations |
13 Disclaimer |
Global Go To Market Strategy - 2030
Export potential enables firms to identify high-growth global markets with greater confidence by combining advanced trade intelligence with a structured quantitative methodology. The framework analyzes emerging demand trends and country-level import patterns while integrating macroeconomic and trade datasets such as GDP and population forecasts, bilateral import–export flows, tariff structures, elasticity differentials between developed and developing economies, geographic distance, and import demand projections. Using weighted trade values from 2020–2024 as the base period to project country-to-country export potential for 2030, these inputs are operationalized through calculated drivers such as gravity model parameters, tariff impact factors, and projected GDP per-capita growth. Through an analysis of hidden potentials, demand hotspots, and market conditions that are most favorable to success, this method enables firms to focus on target countries, maximize returns, and global expansion with data, backed by accuracy.
By factoring in the projected importer demand gap that is currently unmet and could be potential opportunity, it identifies the potential for the Exporter (Country) among 190 countries, against the general trade analysis, which identifies the biggest importer or exporter.
To discover high-growth global markets and optimize your business strategy:
Click Here
Pricing
- Single User License$ 1,995
- Department License$ 2,400
- Site License$ 3,120
- Global License$ 3,795

Leadership Perspectives from Industry Events
Search
Thought Leadership and Analyst Meet


Our Clients
6WResearch In News
- Doha a strategic location for EV manufacturing hub: IPA Qatar
- Demand for luxury TVs surging in the GCC, says Samsung
- Empowering Growth: The Thriving Journey of Bangladesh’s Cable Industry
- Demand for luxury TVs surging in the GCC, says Samsung
- Video call with a traditional healer? Once unthinkable, it’s now common in South Africa
- Intelligent Buildings To Smooth GCC’s Path To Net Zero
Latest Reports
- New Zealand Aseptic Manufacturing Market (2026-2032)
- Netherlands Aseptic Manufacturing Market (2026-2032)
- Nauru Aseptic Manufacturing Market (2026-2032)
- Namibia Aseptic Manufacturing Market (2026-2032)
- Mozambique Aseptic Manufacturing Market (2026-2032)
- Montenegro Aseptic Manufacturing Market (2026-2032)
- Mongolia Aseptic Manufacturing Market (2026-2032)
- Monaco Aseptic Manufacturing Market (2026-2032)
- Micronesia Aseptic Manufacturing Market (2026-2032)
- Mauritius Aseptic Manufacturing Market (2026-2032)
Industry Events and Analyst Meet

HIMTEX 2026

India Refining Summit 2026

India EV Show 2026

EV tech India Expo 2026

Auto Tech Asia 2026
Whitepaper
- Middle East & Africa Commercial Security Market Click here to view more.
- Middle East & Africa Fire Safety Systems & Equipment Market Click here to view more.
- GCC Drone Market Click here to view more.
- Middle East Lighting Fixture Market Click here to view more.
- GCC Physical & Perimeter Security Market Click here to view more.