Qatar Nonferrous Metal Products Market (2026-2032) | Trends, Outlook, Analysis, Growth, Forecast, Industry, Size, Revenue, Value, Share & Companies
Market Forecast By Type (Smelting and Refining, Rolling, Drawing, Extruding, Alloying, Other), By Applications (Automotive, Electronic Power, Construction, Others) And Competitive Landscape
| Product Code: ETC033841 | Publication Date: Jul 2023 | Updated Date: Jun 2026 | Product Type: Report | |
| Publisher: 6Wresearch | Author: Ravi Bhandari | No. of Pages: 70 | No. of Figures: 35 | No. of Tables: 5 |
Qatar Nonferrous Metal Products Market Summary
The qatar nonferrous metal products market was estimated at USD 105 Million in 2025 and is projected to reach USD 115 Million by 2032, growing at a CAGR of 1.1% from 2026 to 2032.
Qatar Nonferrous Metal Products Market Year-wise Growth Rate and Key Drivers
This graph highlights how the Qatar Nonferrous Metal Products Market has steadily grown over the past five years, supported by major growth factors.
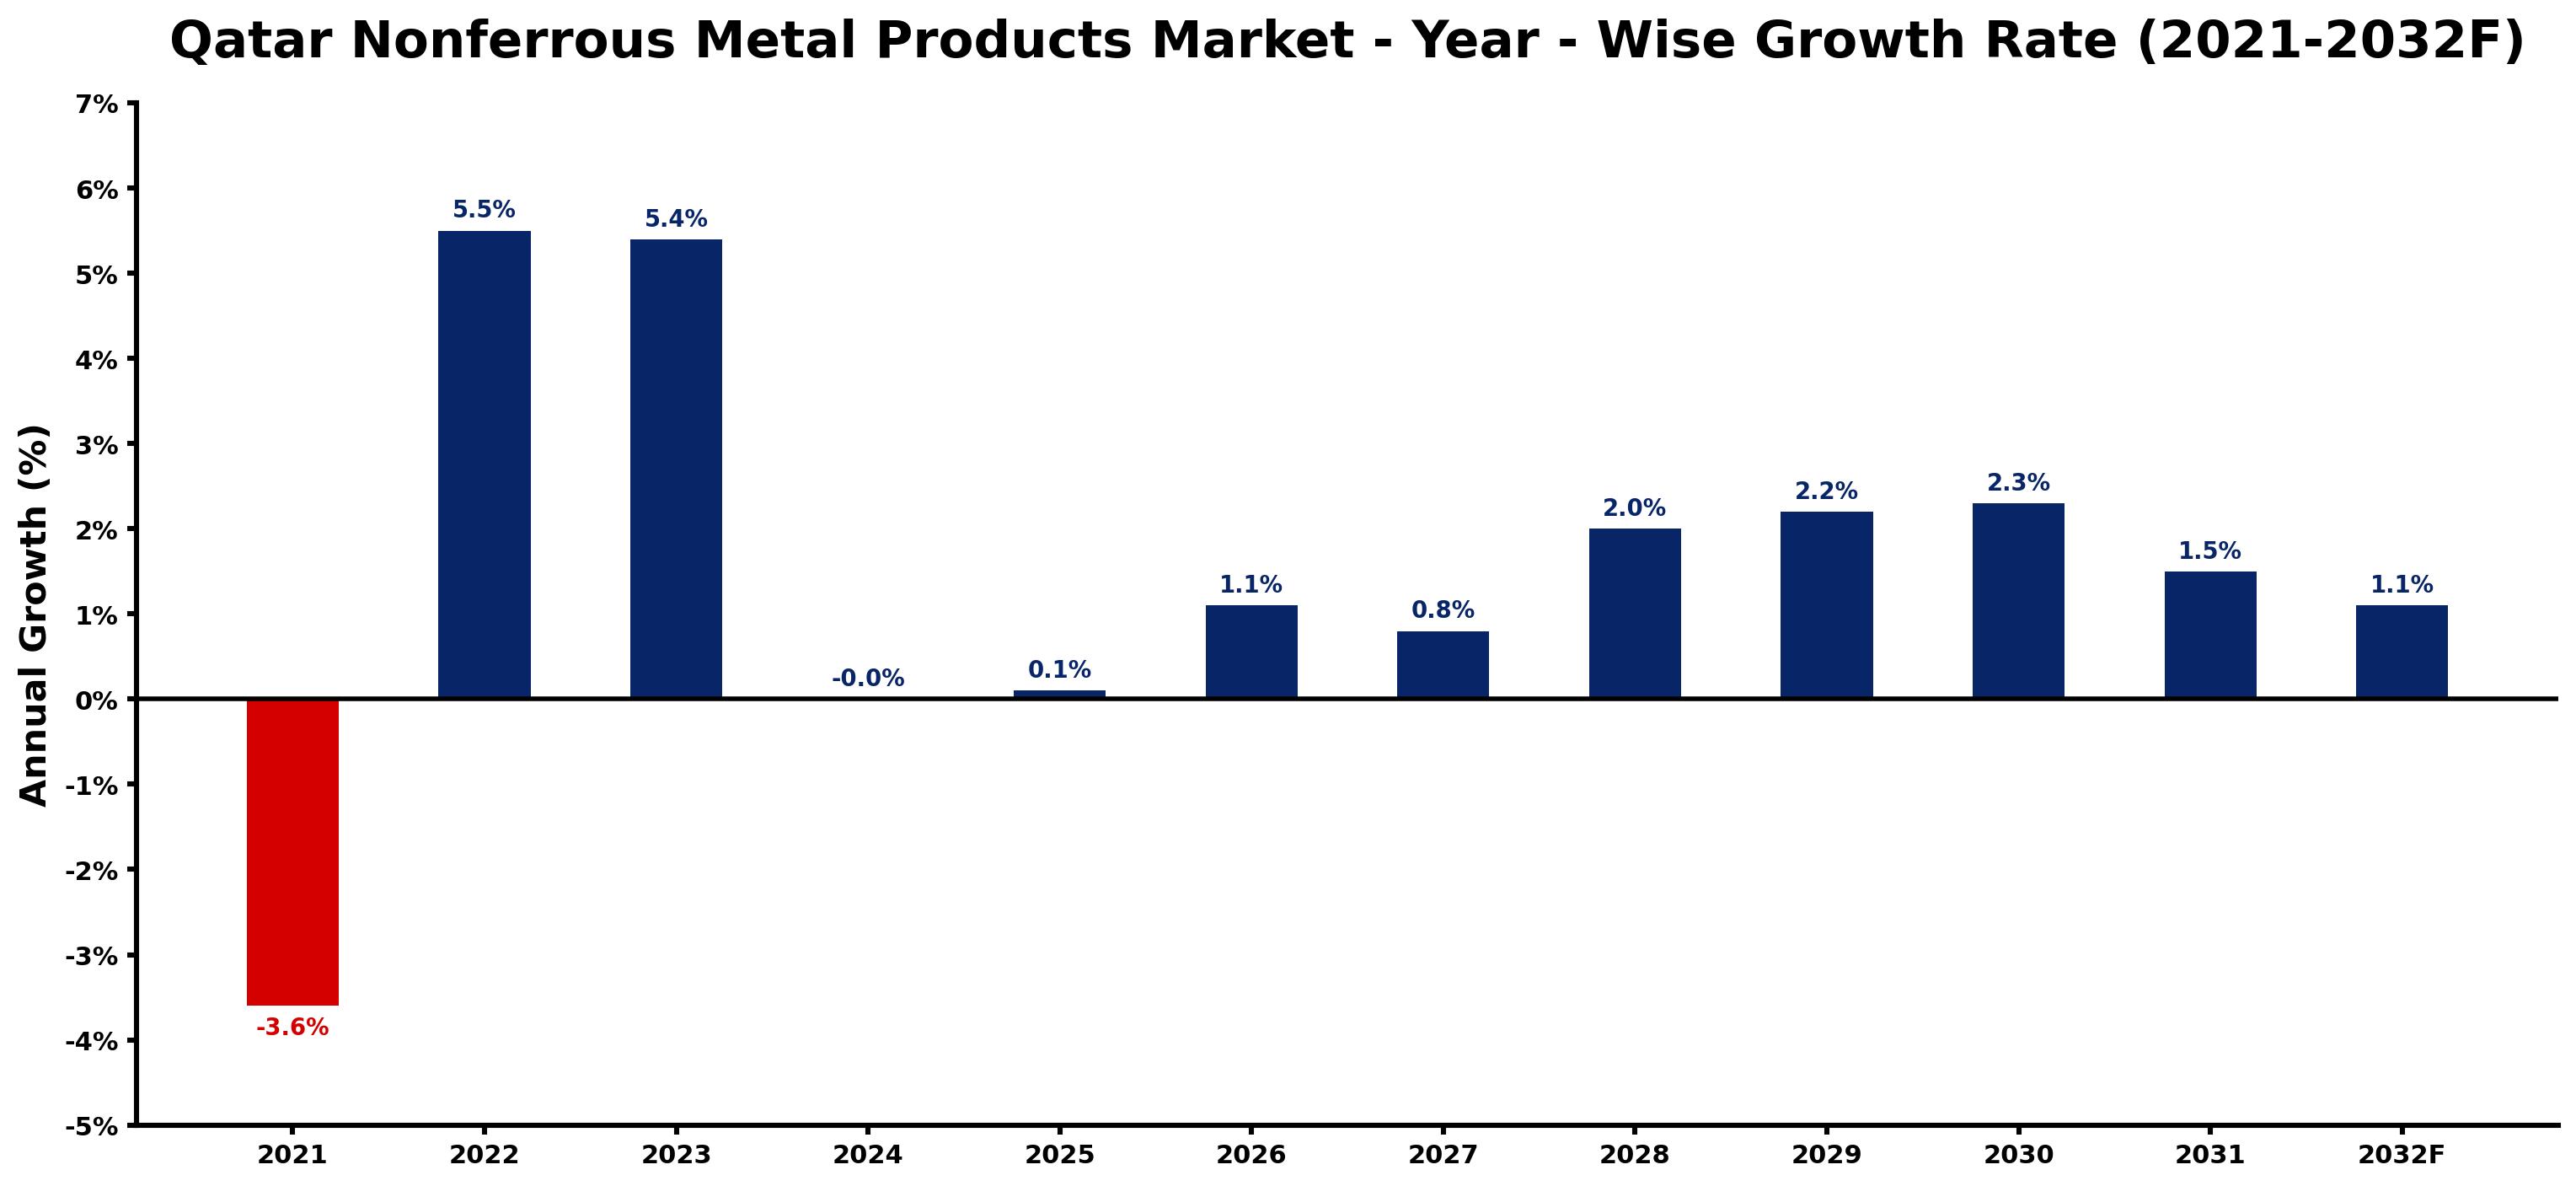
The table below presents the year wise growth rates along with the key drivers influencing the market
| Year | Growth Rate | Major Drivers |
| 2021 | -3.6% | A significant slowdown in construction activity diminished demand for nonferrous metal products in 2021. |
| 2022 | 5.5% | Increased infrastructure projects in Qatar attracted significant investments in metal manufacturing sectors. |
| 2023 | 5.4% | Local sourcing initiatives began favoring nonferrous metals over imports, enhancing market stability. |
| 2024 | -0.0% | NEOM's ambitious urban development plans created new opportunities for aluminum and copper usage. |
| 2025 | 0.1% | Urbanization trends supported robust demand for durable building materials, including nonferrous products. |
| 2026 | 1.1% | Sustainability goals pushed industries to explore eco-friendly alternatives, benefiting nonferrous metal applications. |
| 2027 | 0.8% | Technological innovations reduced production costs, enabling competitive pricing for local manufacturers. |
| 2028 | 2.0% | Expandability of renewable energy systems increased copper usage in infrastructure and residential projects. |
| 2029 | 2.2% | Regional geopolitical shifts favored domestic production capabilities over reliance on foreign sources. |
| 2030 | 2.3% | Enhanced logistics solutions revolutionized supply chains, improving efficiency in nonferrous metal distribution. |
| 2031 | 1.5% | Emerging construction methodologies emphasized lightweight materials, propelling nonferrous metals' applicability. |
| 2032 | 1.1% | Market consolidation in Qatar's nonferrous sector led to increased collaboration among key players. |
Note - Market size estimations and growth projections presented in this report are based on 6Wresearch's advanced forecasting approach, validated with industry datasets as of June 2026.
Qatar Nonferrous Metal Products Market Synopsis
The Qatar Nonferrous Metal Products Market is projected to reach 1.1% and witness significant growth during the forecast period (2026-2032). The market is expected to expand at a robust CAGR of 5.5%, driven by the increasing demand for high-quality and lightweight metal components across various industries, including automotive, aerospace, and electronics.
Qatar Nonferrous Metal Products Market Growth Drivers
Several factors are contributing to the growth of the Qatar nonferrous metal products market. Firstly, substantial investments in infrastructure development are underway, supported by governmental initiatives aimed at fostering industrialization. This creates a favorable environment for nonferrous metals, as they are integral to many construction and manufacturing processes.
- The automotive sector's transition to lighter materials has intensified the demand for nonferrous metals like aluminum, promoting their use for improving fuel efficiency and vehicle performance.
- Aerospace manufacturing is increasingly reliant on lightweight metals to enhance aircraft performance while reducing operational costs, further boosting demand within this market.
- The electrification trends in industries are escalating the use of copper, aluminum, and other nonferrous materials, particularly in power generation and transmission applications.
- Free trade agreements are facilitating a more robust global trade environment for nonferrous metals, thus enhancing market access and opportunities for local manufacturers.
- Upcoming events like the FIFA World Cup 2022 have spurred infrastructural investments, leading to increased demand for nonferrous metal products in construction.
Qatar Nonferrous Metal Products Market Challenges and Restraints
Despite the positive growth trajectory, the market faces several challenges. Increasing import duties and taxes on raw materials essential for manufacturing are significant obstacles that could impact profitability and operational sustainability. Moreover, high production costs and stringent environmental regulations related to waste management also pose risks for the industry.
- The rising costs of raw materials can materially affect the profit margins for manufacturers, making it essential for them to seek efficient production methods and alternative materials.
- Environmental regulations require manufacturers to invest in cleaner technologies and waste management solutions, which can strain resources, especially for smaller companies.
- The rapid pace of technological advancements necessitates continuous investment in R&D to remain competitive, impacting financial allocations for other operational needs.
- Supply chain disruptions, exacerbated by the COVID-19 pandemic, have led to delays in material availability, complicating inventory management and manufacturing schedules.
- Market instability due to fluctuations in global trade policies can affect pricing strategies and customer relationships, creating a challenging operating environment.
Qatar Nonferrous Metal Products Market Government Investment and Initiatives
The government of Qatar has implemented various initiatives aimed at fostering the growth of the nonferrous metal products market. These initiatives include substantial public spending on infrastructure projects, which is pivotal in stimulating demand for nonferrous metals. The Qatar National Vision 2030 emphasizes economic diversification and industrial enhancement, leading to numerous investment opportunities.
- Public infrastructure projects have been prioritized, with significant government budgets allocated to construction, thereby enhancing the demand for nonferrous metal products.
- Industrial zones and free-trade areas have been established, creating an enabling environment for businesses engaged in the processing and manufacturing of nonferrous metals.
- Government incentives for foreign investments are designed to attract technology transfer and enhance local production capabilities in the nonferrous metal sector.
- Collaborations between government bodies and private enterprises in R&D activities promote innovation in nonferrous metal applications, driving market growth.
- Environmental sustainability initiatives encourage manufacturers to adopt eco-friendly practices, aligning with global trends towards responsible production.
Qatar Nonferrous Metal Products Market Latest Developments (May 2025 - June 2026)
In the period leading up to mid-2026, the Qatar nonferrous metal products market has observed several notable developments. Manufacturers are increasingly focusing on enhancing production efficiency through the adoption of advanced manufacturing technologies, aiding in cost containment and output consistency.
- Industry stakeholders are exploring strategic partnerships to enhance supply chain resilience, ensuring smoother operations in a post-pandemic world.
- Environmental sustainability has become a cornerstone of market activities, with a growing emphasis on recycling nonferrous metals and reducing waste in manufacturing processes.
- Continued government support through subsidies and incentives for technological upgrades has facilitated wider adoption of innovative production processes across the sector.
- The introduction of new regulations has prompted businesses to enhance their compliance strategies, ensuring that they meet both national and international environmental standards.
- Market players are also diversifying their product offerings to cater to emerging industry needs, particularly in the renewable energy sector where nonferrous metals play a critical role.
Qatar Nonferrous Metal Products Market - Key Attractiveness of the Report
- 10 Years of Market Numbers
- Historical Data Starting from 2022 to 2025
- Base Year: 2025
- Forecast Data until 2032
- Key Performance Indicators Impacting the Market
- Major Upcoming Developments and Projects
Key Highlights of the Report:
- Qatar Nonferrous Metal Products Market Outlook
- Market Size of Qatar Nonferrous Metal Products Market, 2025
- Forecast of Qatar Nonferrous Metal Products Market, 2032
- Historical Data and Forecast of Qatar Nonferrous Metal Products Revenues & Volume for the Period 2022-2032F
- Qatar Nonferrous Metal Products Market Trend Evolution
- Qatar Nonferrous Metal Products Market Drivers and Challenges
- Qatar Nonferrous Metal Products Price Trends
- Qatar Nonferrous Metal Products Porter's Five Forces
- Qatar Nonferrous Metal Products Industry Life Cycle
- Historical Data and Forecast of Qatar Nonferrous Metal Products Market Revenues & Volume By Type for the Period 2022-2032F
- Historical Data and Forecast of Qatar Nonferrous Metal Products Market Revenues & Volume By Smelting and Refining for the Period 2022-2032F
- Historical Data and Forecast of Qatar Nonferrous Metal Products Market Revenues & Volume By Rolling for the Period 2022-2032F
- Historical Data and Forecast of Qatar Nonferrous Metal Products Market Revenues & Volume By Drawing for the Period 2022-2032F
- Historical Data and Forecast of Qatar Nonferrous Metal Products Market Revenues & Volume By Extruding for the Period 2022-2032F
- Historical Data and Forecast of Qatar Nonferrous Metal Products Market Revenues & Volume By Alloying for the Period 2022-2032F
- Historical Data and Forecast of Qatar Nonferrous Metal Products Market Revenues & Volume By Other for the Period 2022-2032F
- Historical Data and Forecast of Qatar Nonferrous Metal Products Market Revenues & Volume By Applications for the Period 2022-2032F
- Historical Data and Forecast of Qatar Nonferrous Metal Products Market Revenues & Volume By Automotive for the Period 2022-2032F
- Historical Data and Forecast of Qatar Nonferrous Metal Products Market Revenues & Volume By Electronic Power for the Period 2022-2032F
- Historical Data and Forecast of Qatar Nonferrous Metal Products Market Revenues & Volume By Construction for the Period 2022-2032F
- Historical Data and Forecast of Qatar Nonferrous Metal Products Market Revenues & Volume By Others for the Period 2022-2032F
- Qatar Nonferrous Metal Products Import Export Trade Statistics
- Market Opportunity Assessment By Type
- Market Opportunity Assessment By Applications
- Qatar Nonferrous Metal Products Top Companies Market Share
- Qatar Nonferrous Metal Products Competitive Benchmarking By Technical and Operational Parameters
- Qatar Nonferrous Metal Products Company Profiles
- Qatar Nonferrous Metal Products Key Strategic Recommendations
Frequently Asked Questions About the Market Study (FAQs):
The growth is primarily driven by robust infrastructure investments, increasing demand for lightweight materials in various industries, and favorable government initiatives aimed at industrialization.
Challenges include rising import duties on raw materials, high production costs, environmental regulations, and supply chain disruptions.
The government supports the market through public spending on infrastructure projects, incentives for industrial growth, and collaborations aimed at fostering innovation and sustainability.
COVID-19 caused significant supply chain disruptions, impacting manufacturing and distribution, though recovery efforts are underway as operations normalize.
6Wresearch actively monitors the Qatar Nonferrous Metal Products Market and publishes its comprehensive annual report, highlighting emerging trends, growth drivers, revenue analysis, and forecast outlook. Our insights help businesses to make data-backed strategic decisions with ongoing market dynamics. Our analysts track relevent industries related to the Qatar Nonferrous Metal Products Market, allowing our clients with actionable intelligence and reliable forecasts tailored to emerging regional needs.
Yes, we provide customisation as per your requirements. To learn more, feel free to contact us on sales@6wresearch.com
1 Executive Summary |
2 Introduction |
2.1 Key Highlights of the Report |
2.2 Report Description |
2.3 Market Scope & Segmentation |
2.4 Research Methodology |
2.5 Assumptions |
3 Qatar Nonferrous Metal Products Market Overview |
3.1 Qatar Country Macro Economic Indicators |
3.2 Qatar Nonferrous Metal Products Market Revenues & Volume, 2022 & 2032F |
3.3 Qatar Nonferrous Metal Products Market - Industry Life Cycle |
3.4 Qatar Nonferrous Metal Products Market - Porter's Five Forces |
3.5 Qatar Nonferrous Metal Products Market Revenues & Volume Share, By Type, 2022 & 2032F |
3.6 Qatar Nonferrous Metal Products Market Revenues & Volume Share, By Applications, 2022 & 2032F |
4 Qatar Nonferrous Metal Products Market Dynamics |
4.1 Impact Analysis |
4.2 Market Drivers |
4.2.1 Growing demand for nonferrous metals in Qatar's construction and infrastructure projects |
4.2.2 Increasing focus on sustainable and environmentally friendly materials |
4.2.3 Technological advancements leading to improved production processes and product quality |
4.3 Market Restraints |
4.3.1 Fluctuating global metal prices impacting profitability |
4.3.2 Regulatory challenges related to environmental standards and compliance |
4.3.3 Intense competition from other metal product alternatives |
5 Qatar Nonferrous Metal Products Market Trends |
6 Qatar Nonferrous Metal Products Market, By Types |
6.1 Qatar Nonferrous Metal Products Market, By Type |
6.1.1 Overview and Analysis |
6.1.2 Qatar Nonferrous Metal Products Market Revenues & Volume, By Type, 2022-2032F |
6.1.3 Qatar Nonferrous Metal Products Market Revenues & Volume, By Smelting and Refining, 2022-2032F |
6.1.4 Qatar Nonferrous Metal Products Market Revenues & Volume, By Rolling, 2022-2032F |
6.1.5 Qatar Nonferrous Metal Products Market Revenues & Volume, By Drawing, 2022-2032F |
6.1.6 Qatar Nonferrous Metal Products Market Revenues & Volume, By Extruding, 2022-2032F |
6.1.7 Qatar Nonferrous Metal Products Market Revenues & Volume, By Alloying, 2022-2032F |
6.1.8 Qatar Nonferrous Metal Products Market Revenues & Volume, By Other, 2022-2032F |
6.2 Qatar Nonferrous Metal Products Market, By Applications |
6.2.1 Overview and Analysis |
6.2.2 Qatar Nonferrous Metal Products Market Revenues & Volume, By Automotive, 2022-2032F |
6.2.3 Qatar Nonferrous Metal Products Market Revenues & Volume, By Electronic Power, 2022-2032F |
6.2.4 Qatar Nonferrous Metal Products Market Revenues & Volume, By Construction, 2022-2032F |
6.2.5 Qatar Nonferrous Metal Products Market Revenues & Volume, By Others, 2022-2032F |
7 Qatar Nonferrous Metal Products Market Import-Export Trade Statistics |
7.1 Qatar Nonferrous Metal Products Market Export to Major Countries |
7.2 Qatar Nonferrous Metal Products Market Imports from Major Countries |
8 Qatar Nonferrous Metal Products Market Key Performance Indicators |
8.1 Percentage of recycled nonferrous metals used in manufacturing processes |
8.2 Adoption rate of new environmentally friendly technologies in production |
8.3 Average lead time from raw material procurement to finished product delivery |
9 Qatar Nonferrous Metal Products Market - Opportunity Assessment |
9.1 Qatar Nonferrous Metal Products Market Opportunity Assessment, By Type, 2022 & 2032F |
9.2 Qatar Nonferrous Metal Products Market Opportunity Assessment, By Applications, 2022 & 2032F |
10 Qatar Nonferrous Metal Products Market - Competitive Landscape |
10.1 Qatar Nonferrous Metal Products Market Revenue Share, By Companies, 2025 |
10.2 Qatar Nonferrous Metal Products Market Competitive Benchmarking, By Operating and Technical Parameters |
11 Company Profiles |
12 Recommendations |
13 Disclaimer |
Global Go To Market Strategy - 2030
Export potential enables firms to identify high-growth global markets with greater confidence by combining advanced trade intelligence with a structured quantitative methodology. The framework analyzes emerging demand trends and country-level import patterns while integrating macroeconomic and trade datasets such as GDP and population forecasts, bilateral import–export flows, tariff structures, elasticity differentials between developed and developing economies, geographic distance, and import demand projections. Using weighted trade values from 2020–2024 as the base period to project country-to-country export potential for 2030, these inputs are operationalized through calculated drivers such as gravity model parameters, tariff impact factors, and projected GDP per-capita growth. Through an analysis of hidden potentials, demand hotspots, and market conditions that are most favorable to success, this method enables firms to focus on target countries, maximize returns, and global expansion with data, backed by accuracy.
By factoring in the projected importer demand gap that is currently unmet and could be potential opportunity, it identifies the potential for the Exporter (Country) among 190 countries, against the general trade analysis, which identifies the biggest importer or exporter.
To discover high-growth global markets and optimize your business strategy:
Click Here
Pricing
- Single User License$ 1,995
- Department License$ 2,400
- Site License$ 3,120
- Global License$ 3,795

Leadership Perspectives from Industry Events
Search
Thought Leadership and Analyst Meet


Our Clients
6WResearch In News
- India Air Conditioner Market Set for Strong Rebound in 2026 After Weather-Led Correction and GST-Driven Recovery: 6Wresearch
- ADAS in India: How Automatic Emergency Braking, Blind Spot Detection & Driver Monitoring are Transforming Road Safety
- Doha a strategic location for EV manufacturing hub: IPA Qatar
- Demand for luxury TVs surging in the GCC, says Samsung
- Empowering Growth: The Thriving Journey of Bangladesh’s Cable Industry
- Demand for luxury TVs surging in the GCC, says Samsung
Latest Reports
- Nicaragua RPG Gaming Market (2026-2032)
- New Zealand RPG Gaming Market (2026-2032)
- Netherlands RPG Gaming Market (2026-2032)
- Nauru RPG Gaming Market (2026-2032)
- Namibia RPG Gaming Market (2026-2032)
- Mozambique RPG Gaming Market (2026-2032)
- Montenegro RPG Gaming Market (2026-2032)
- Mongolia RPG Gaming Market (2026-2032)
- Monaco RPG Gaming Market (2026-2032)
- Micronesia RPG Gaming Market (2026-2032)
Industry Events and Analyst Meet

EV India Expo 2026

HIMTEX 2026

India Refining Summit 2026

India EV Show 2026

EV tech India Expo 2026
Whitepaper
- Middle East & Africa Commercial Security Market Click here to view more.
- Middle East & Africa Fire Safety Systems & Equipment Market Click here to view more.
- GCC Drone Market Click here to view more.
- Middle East Lighting Fixture Market Click here to view more.
- GCC Physical & Perimeter Security Market Click here to view more.