Qatar Soup and Extracts Market (2026-2032) | Companies, Revenue, Industry, Share, Forecast, Analysis, Value, Trends, Outlook, Growth, Size
Market Forecast By Soup Type (Dried, Wet, Canned, UHT), By Sources (Spices, Herbs, Flowers, Tea leaves), By Distribution Channel (Supermarkets & Hypermarkets, Convenience Stores, Online) And Competitive Landscape
| Product Code: ETC031021 | Publication Date: Jul 2023 | Updated Date: Jun 2026 | Product Type: Report | |
| Publisher: 6Wresearch | Author: Ravi Bhandari | No. of Pages: 70 | No. of Figures: 35 | No. of Tables: 5 |
Qatar Soup and Extracts Market Summary
The qatar soup and extracts market was estimated at USD 339 Million in 2025 and is projected to reach USD 480 Million by 2032, growing at a CAGR of 6.0% from 2026 to 2032.
Qatar Soup and Extracts Market Year-wise Growth Rate and Key Drivers
This graph highlights how the Qatar Soup and Extracts Market has steadily grown over the past five years, supported by major growth factors.
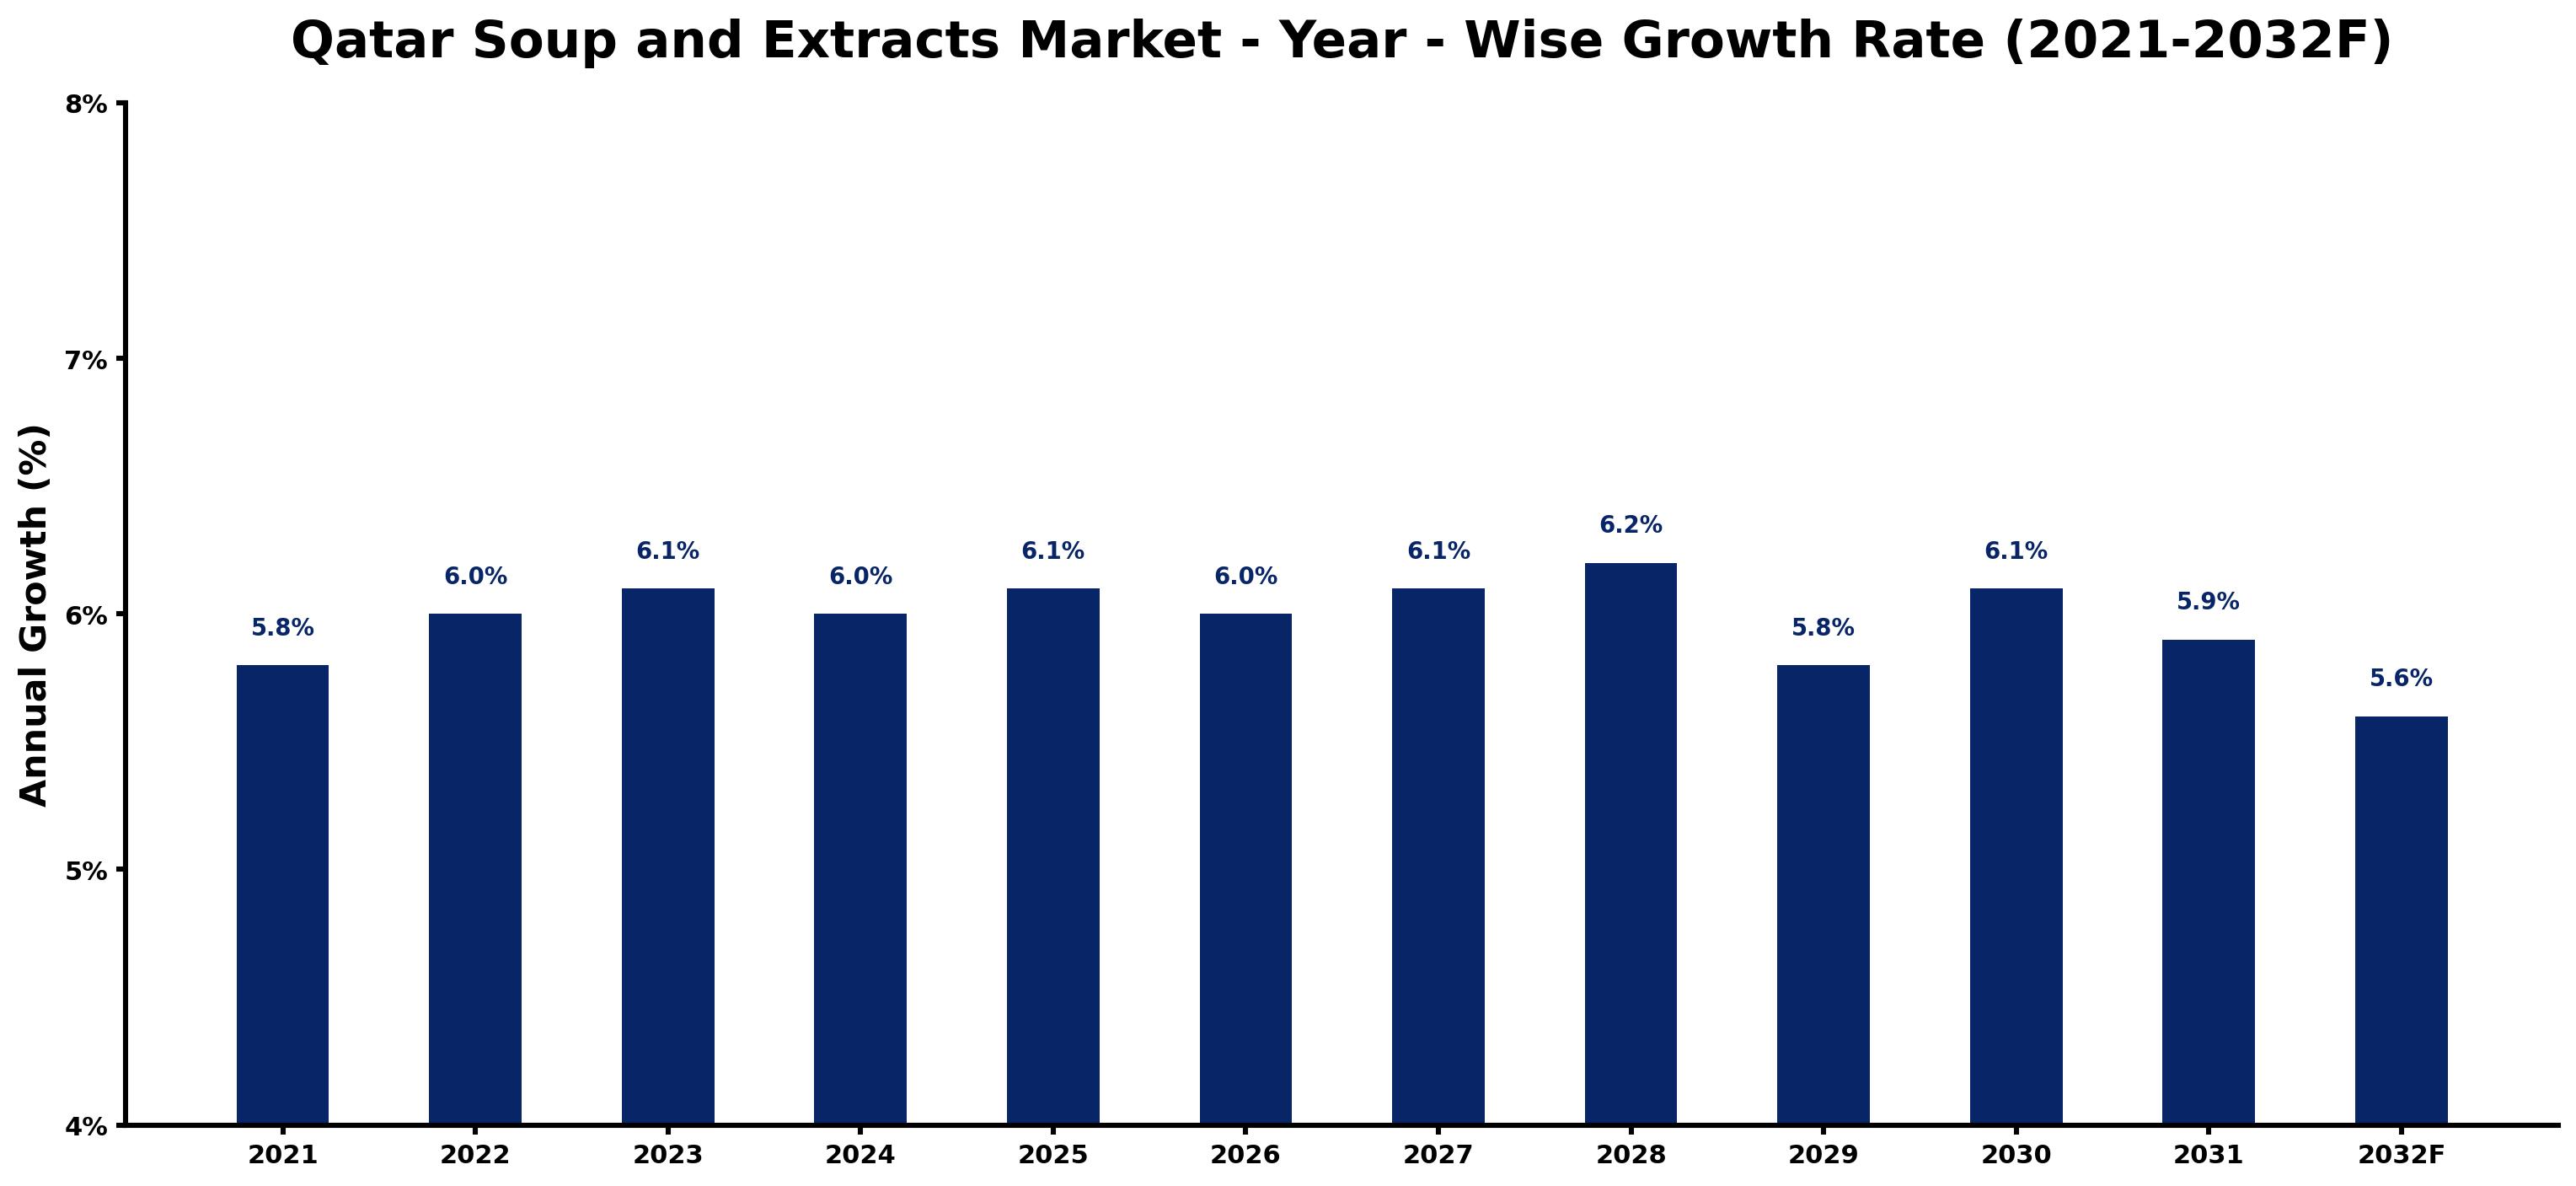
The table below presents the year wise growth rates along with the key drivers influencing the market
| Year | Growth Rate | Major Drivers |
| 2021 | 5.8% | Post-lockdown retail projects ignited a renewed interest in local food products. |
| 2022 | 6.0% | Culinary tourism flourished, boosting the demand for authentic soup varieties. |
| 2023 | 6.1% | Consumer focus on health highlighted the nutritional value of soups and extracts. |
| 2024 | 6.0% | International brands entered the market, increasing competition and product variety. |
| 2025 | 6.1% | E-commerce platforms became vital for distributing soup products amid urban expansion. |
| 2026 | 6.0% | Regional climate conditions spurred interest in comfort foods like hearty soups. |
| 2027 | 6.1% | Local sourcing initiatives gained traction, promoting homegrown ingredient usage in extracts. |
| 2028 | 6.2% | Health-conscious consumers shifted preferences towards organic and gluten-free soup options. |
| 2029 | 5.8% | Culinary innovation events showcased modern soup recipes, attracting diverse demographics. |
| 2030 | 6.1% | Digital marketing campaigns effectively targeted younger audiences interested in unique flavors. |
| 2031 | 5.9% | Collaborations between chefs and brands enhanced product visibility in upscale markets. |
| 2032 | 5.6% | Sustainability trends encouraged eco-friendly packaging solutions in the soup market. |
Note - Market size estimations and growth projections presented in this report are based on 6Wresearch's advanced forecasting approach, validated with industry datasets as of June 2026.
Qatar Soup and Extracts Market Synopsis
The Qatar Soup and Extracts Market is projected to reach 6.0% and witness significant growth during the forecast period (2026-2032). The increasing inclination of health-conscious consumers towards nutritious and convenient food options is a pivotal factor contributing to growth in this sector. The demand for soups and extracts has surged notably as these products are recognized for their health benefits, easy preparation, and versatility. Furthermore, the expanding restaurant sector in Qatar, which is increasingly incorporating these offerings into their menus, has bolstered the market's expansion. Manufacturers are responding by diversifying their product ranges, introducing various flavors and innovative packaging formats designed to attract a broader customer base. Coupled with rising disposable income levels among Qatar's population, this trend is expected to significantly propel the market forward in the coming years.
Qatar Soup and Extracts Market Growth Drivers
The growth of the Qatar soup and extracts market can be attributed to several primary drivers:
- Increasing disposable incomes among consumers, which have facilitated the shift towards premium and health-focused food products, significantly enhancing the market potential.
- A shift in dietary habits, with more people opting for quick and convenient meal solutions such as ready-to-eat canned soups and purees, further stimulating demand.
- Urbanization trends that have led to busier lifestyles, prompting consumers to prioritize convenience in meal preparation over traditional home-cooked options.
- Heightened health consciousness, resulting in a strong preference for low-fat and sugar-free soups and extracts, which is driving sales in the healthier food segment.
- The proliferation of culinary diversity in Qatar, with an influx of international food trends encouraging restaurants to innovate their menus with diverse soup offerings.
Qatar Soup and Extracts Market Challenges and Restraints
Despite the promising growth trajectory, the Qatar soup and extracts market faces several challenges:
- High production costs associated with manufacturing and processing facilities, which can deter new entrants aiming to compete in an already established market.
- The availability of substitutes, such as frozen foods and fresh ingredients, poses a potential risk to the processed soup market as consumers may opt for perceived fresher options.
- Fluctuations in raw material prices, influenced by global supply chain dynamics, which can affect profitability and pricing strategies in the sector.
- Increased consumer scrutiny regarding ingredient transparency and health claims, demanding manufacturers to ensure high standards in product quality and labeling.
- The impact of economic uncertainties, which may lead consumers to adopt more cautious spending practices, particularly related to non-essential food items.
Qatar Soup and Extracts Market Covid-19 Impact
The Covid-19 pandemic has significantly affected the Qatar soup and extracts market, introducing various challenges:
- Disruption in supply chains led to shortages of raw materials, causing delays in production and impacting the availability of products in the market.
- Economic challenges, such as job losses and salary cuts, resulted in reduced consumer spending, particularly affecting discretionary purchases like soups and extracts.
- The closure of restaurants and catering services during lockdown periods had a substantial negative impact on product sales, as these channels historically contributed to significant revenue streams.
- While some manufacturers experienced decreased demand, others pivoted to online sales channels, adapting their business models to better meet consumer needs during the pandemic.
- The pandemic prompted a renewed focus on health and nutrition, with some consumers turning to soups and extracts for comfort and wellness during uncertain times, potentially benefiting the market long-term.
Qatar Soup and Extracts Market Government Investment and Initiatives
The Qatari government is actively investing in various initiatives to bolster the food sector, including the soup and extracts market:
- Government policies aimed at enhancing food security and promoting local production have encouraged investments in the food processing industry.
- Public spending on infrastructure projects, including logistics and supply chain improvements, has been introduced to enhance the distribution of food products across the country.
- Development plans focusing on sustainability and innovation are in place, prioritizing the research and development of new food products, including nutritious soups and extracts.
- Incentives for local manufacturers, such as tax breaks and grants for adopting modern technologies, aim to improve competitiveness and product quality within the market.
- Collaboration with international food organizations and academic institutions fosters knowledge transfer and best practices, thereby strengthening the local soup and extracts industry.
Qatar Soup and Extracts Market Latest Developments (May 2025 - June 2026)
The Qatar soup and extracts market is anticipated to experience several key developments during the period from May 2025 to June 2026:
- There has been a notable increase in product diversification, with manufacturers introducing new flavors and organic options to cater to evolving consumer preferences.
- Partnerships between food technology firms and local producers are becoming more frequent, focusing on creating innovative packaging solutions that enhance product shelf life and usability.
- The emergence of plant-based and vegetarian options in the soup category is gaining popularity among health-conscious consumers and driving market trends.
- Online platforms have seen increased activity, with manufacturers enhancing their e-commerce capabilities to reach consumers more effectively in a post-pandemic environment.
- Public health campaigns promoting the benefits of soups and extracts as nutritious meal options are expected to further stimulate consumer interest and market growth.
Qatar Soup and Extracts Market - Key Attractiveness of the Report
- 10 Years of Market Numbers
- Historical Data Starting from 2022 to 2025
- Base Year: 2025
- Forecast Data until 2032
- Key Performance Indicators Impacting the Market
- Major Upcoming Developments and Projects
Key Highlights of the Report:
- Qatar Soup and Extracts Market Outlook
- Market Size of Qatar Soup and Extracts Market, 2025
- Forecast of Qatar Soup and Extracts Market, 2032
- Historical Data and Forecast of Qatar Soup and Extracts Revenues & Volume for the Period 2022-2032F
- Qatar Soup and Extracts Market Trend Evolution
- Qatar Soup and Extracts Market Drivers and Challenges
- Qatar Soup and Extracts Price Trends
- Qatar Soup and Extracts Porter's Five Forces
- Qatar Soup and Extracts Industry Life Cycle
- Historical Data and Forecast of Qatar Soup and Extracts Market Revenues & Volume By Soup Type for the Period 2022-2032F
- Historical Data and Forecast of Qatar Soup and Extracts Market Revenues & Volume By Dried for the Period 2022-2032F
- Historical Data and Forecast of Qatar Soup and Extracts Market Revenues & Volume By Wet for the Period 2022-2032F
- Historical Data and Forecast of Qatar Soup and Extracts Market Revenues & Volume By Canned for the Period 2022-2032F
- Historical Data and Forecast of Qatar Soup and Extracts Market Revenues & Volume By UHT for the Period 2022-2032F
- Historical Data and Forecast of Qatar Soup and Extracts Market Revenues & Volume By Sources for the Period 2022-2032F
- Historical Data and Forecast of Qatar Soup and Extracts Market Revenues & Volume By Spices for the Period 2022-2032F
- Historical Data and Forecast of Qatar Soup and Extracts Market Revenues & Volume By Herbs for the Period 2022-2032F
- Historical Data and Forecast of Qatar Soup and Extracts Market Revenues & Volume By Flowers for the Period 2022-2032F
- Historical Data and Forecast of Qatar Soup and Extracts Market Revenues & Volume By Tea leaves for the Period 2022-2032F
- Historical Data and Forecast of Qatar Soup and Extracts Market Revenues & Volume By Distribution Channel for the Period 2022-2032F
- Historical Data and Forecast of Qatar Soup and Extracts Market Revenues & Volume By Supermarkets & Hypermarkets for the Period 2022-2032F
- Historical Data and Forecast of Qatar Soup and Extracts Market Revenues & Volume By Convenience Stores for the Period 2022-2032F
- Historical Data and Forecast of Qatar Soup and Extracts Market Revenues & Volume By Online for the Period 2022-2032F
- Qatar Soup and Extracts Import Export Trade Statistics
- Market Opportunity Assessment By Soup Type
- Market Opportunity Assessment By Sources
- Market Opportunity Assessment By Distribution Channel
- Qatar Soup and Extracts Top Companies Market Share
- Qatar Soup and Extracts Competitive Benchmarking By Technical and Operational Parameters
- Qatar Soup and Extracts Company Profiles
- Qatar Soup and Extracts Key Strategic Recommendations
Frequently Asked Questions About the Market Study (FAQs):
The growth is primarily driven by increasing disposable incomes, changing dietary habits towards convenience, and a heightened focus on health and nutrition.
The pandemic disrupted supply chains and reduced consumer spending, but it also accelerated the shift to online sales and increased interest in health-oriented products.
High production costs, competition from substitutes, and consumer demands for quality and transparency are significant challenges for newcomers.
Government initiatives include investments in food security, local production incentives, and partnerships with international organizations to promote innovation and quality in the sector.
6Wresearch actively monitors the Qatar Soup and Extracts Market and publishes its comprehensive annual report, highlighting emerging trends, growth drivers, revenue analysis, and forecast outlook. Our insights help businesses to make data-backed strategic decisions with ongoing market dynamics. Our analysts track relevent industries related to the Qatar Soup and Extracts Market, allowing our clients with actionable intelligence and reliable forecasts tailored to emerging regional needs.
Yes, we provide customisation as per your requirements. To learn more, feel free to contact us on sales@6wresearch.com
1 Executive Summary |
2 Introduction |
2.1 Key Highlights of the Report |
2.2 Report Description |
2.3 Market Scope & Segmentation |
2.4 Research Methodology |
2.5 Assumptions |
3 Qatar Soup and Extracts Market Overview |
3.1 Qatar Country Macro Economic Indicators |
3.2 Qatar Soup and Extracts Market Revenues & Volume, 2022 & 2032F |
3.3 Qatar Soup and Extracts Market - Industry Life Cycle |
3.4 Qatar Soup and Extracts Market - Porter's Five Forces |
3.5 Qatar Soup and Extracts Market Revenues & Volume Share, By Soup Type, 2022 & 2032F |
3.6 Qatar Soup and Extracts Market Revenues & Volume Share, By Sources, 2022 & 2032F |
3.7 Qatar Soup and Extracts Market Revenues & Volume Share, By Distribution Channel, 2022 & 2032F |
4 Qatar Soup and Extracts Market Dynamics |
4.1 Impact Analysis |
4.2 Market Drivers |
4.3 Market Restraints |
5 Qatar Soup and Extracts Market Trends |
6 Qatar Soup and Extracts Market, By Types |
6.1 Qatar Soup and Extracts Market, By Soup Type |
6.1.1 Overview and Analysis |
6.1.2 Qatar Soup and Extracts Market Revenues & Volume, By Soup Type, 2022-2032F |
6.1.3 Qatar Soup and Extracts Market Revenues & Volume, By Dried, 2022-2032F |
6.1.4 Qatar Soup and Extracts Market Revenues & Volume, By Wet, 2022-2032F |
6.1.5 Qatar Soup and Extracts Market Revenues & Volume, By Canned, 2022-2032F |
6.1.6 Qatar Soup and Extracts Market Revenues & Volume, By UHT, 2022-2032F |
6.2 Qatar Soup and Extracts Market, By Sources |
6.2.1 Overview and Analysis |
6.2.2 Qatar Soup and Extracts Market Revenues & Volume, By Spices, 2022-2032F |
6.2.3 Qatar Soup and Extracts Market Revenues & Volume, By Herbs, 2022-2032F |
6.2.4 Qatar Soup and Extracts Market Revenues & Volume, By Flowers, 2022-2032F |
6.2.5 Qatar Soup and Extracts Market Revenues & Volume, By Tea leaves, 2022-2032F |
6.3 Qatar Soup and Extracts Market, By Distribution Channel |
6.3.1 Overview and Analysis |
6.3.2 Qatar Soup and Extracts Market Revenues & Volume, By Supermarkets & Hypermarkets, 2022-2032F |
6.3.3 Qatar Soup and Extracts Market Revenues & Volume, By Convenience Stores, 2022-2032F |
6.3.4 Qatar Soup and Extracts Market Revenues & Volume, By Online, 2022-2032F |
7 Qatar Soup and Extracts Market Import-Export Trade Statistics |
7.1 Qatar Soup and Extracts Market Export to Major Countries |
7.2 Qatar Soup and Extracts Market Imports from Major Countries |
8 Qatar Soup and Extracts Market Key Performance Indicators |
9 Qatar Soup and Extracts Market - Opportunity Assessment |
9.1 Qatar Soup and Extracts Market Opportunity Assessment, By Soup Type, 2022 & 2032F |
9.2 Qatar Soup and Extracts Market Opportunity Assessment, By Sources, 2022 & 2032F |
9.3 Qatar Soup and Extracts Market Opportunity Assessment, By Distribution Channel, 2022 & 2032F |
10 Qatar Soup and Extracts Market - Competitive Landscape |
10.1 Qatar Soup and Extracts Market Revenue Share, By Companies, 2025 |
10.2 Qatar Soup and Extracts Market Competitive Benchmarking, By Operating and Technical Parameters |
11 Company Profiles |
12 Recommendations |
13 Disclaimer |
Global Go To Market Strategy - 2030
Export potential enables firms to identify high-growth global markets with greater confidence by combining advanced trade intelligence with a structured quantitative methodology. The framework analyzes emerging demand trends and country-level import patterns while integrating macroeconomic and trade datasets such as GDP and population forecasts, bilateral import–export flows, tariff structures, elasticity differentials between developed and developing economies, geographic distance, and import demand projections. Using weighted trade values from 2020–2024 as the base period to project country-to-country export potential for 2030, these inputs are operationalized through calculated drivers such as gravity model parameters, tariff impact factors, and projected GDP per-capita growth. Through an analysis of hidden potentials, demand hotspots, and market conditions that are most favorable to success, this method enables firms to focus on target countries, maximize returns, and global expansion with data, backed by accuracy.
By factoring in the projected importer demand gap that is currently unmet and could be potential opportunity, it identifies the potential for the Exporter (Country) among 190 countries, against the general trade analysis, which identifies the biggest importer or exporter.
To discover high-growth global markets and optimize your business strategy:
Click Here
Pricing
- Single User License$ 1,995
- Department License$ 2,400
- Site License$ 3,120
- Global License$ 3,795

Leadership Perspectives from Industry Events
Search
Thought Leadership and Analyst Meet


Our Clients
6WResearch In News
- India Export Attractiveness Tracker 2026
- India Air Conditioner Market Set for Strong Rebound in 2026 After Weather-Led Correction and GST-Driven Recovery: 6Wresearch
- ADAS in India: How Automatic Emergency Braking, Blind Spot Detection & Driver Monitoring are Transforming Road Safety
- Doha a strategic location for EV manufacturing hub: IPA Qatar
- Demand for luxury TVs surging in the GCC, says Samsung
- Empowering Growth: The Thriving Journey of Bangladesh’s Cable Industry
Latest Reports
- Qatar Access and Home Network Market (2026-2032)
- Nicaragua RPG Gaming Market (2026-2032)
- New Zealand RPG Gaming Market (2026-2032)
- Netherlands RPG Gaming Market (2026-2032)
- Nauru RPG Gaming Market (2026-2032)
- Namibia RPG Gaming Market (2026-2032)
- Mozambique RPG Gaming Market (2026-2032)
- Montenegro RPG Gaming Market (2026-2032)
- Mongolia RPG Gaming Market (2026-2032)
- Monaco RPG Gaming Market (2026-2032)
Industry Events and Analyst Meet

EV India Expo 2026

HIMTEX 2026

India Refining Summit 2026

India EV Show 2026

EV tech India Expo 2026
Whitepaper
- Middle East & Africa Commercial Security Market Click here to view more.
- Middle East & Africa Fire Safety Systems & Equipment Market Click here to view more.
- GCC Drone Market Click here to view more.
- Middle East Lighting Fixture Market Click here to view more.
- GCC Physical & Perimeter Security Market Click here to view more.