Qatar Transport Packaging Market (2026-2032) | Outlook, Value, Size, Forecast, Companies, Analysis, Growth, Trends, Revenue, Share & Industry
Market Forecast By Material Type (Plastic, Polyethylene (PE), Polypropylene (PP), Polyethylene Terephthalate (PET), Paper & Paperboard, Metal, Wood, Others), By Packaging Types (Cartons, Wooden crates, Containers, Corrugated boxes, Barrels, IBCs, Strapping, Others), By End-users (Agriculture, Automotive, Building & Construction, Chemicals & Pharmaceuticals, Food & Beverages, Metallurgical, Electrical & Electronics, Others) And Competitive Landscape
| Product Code: ETC006661 | Publication Date: Jul 2023 | Updated Date: Jun 2026 | Product Type: Report | |
| Publisher: 6Wresearch | Author: Ravi Bhandari | No. of Pages: 70 | No. of Figures: 35 | No. of Tables: 5 |
Qatar Transport Packaging Market Summary
The qatar transport packaging market was estimated at USD 237 Million in 2025 and is projected to reach USD 325 Million by 2032, growing at a CAGR of 5.4% from 2026 to 2032.
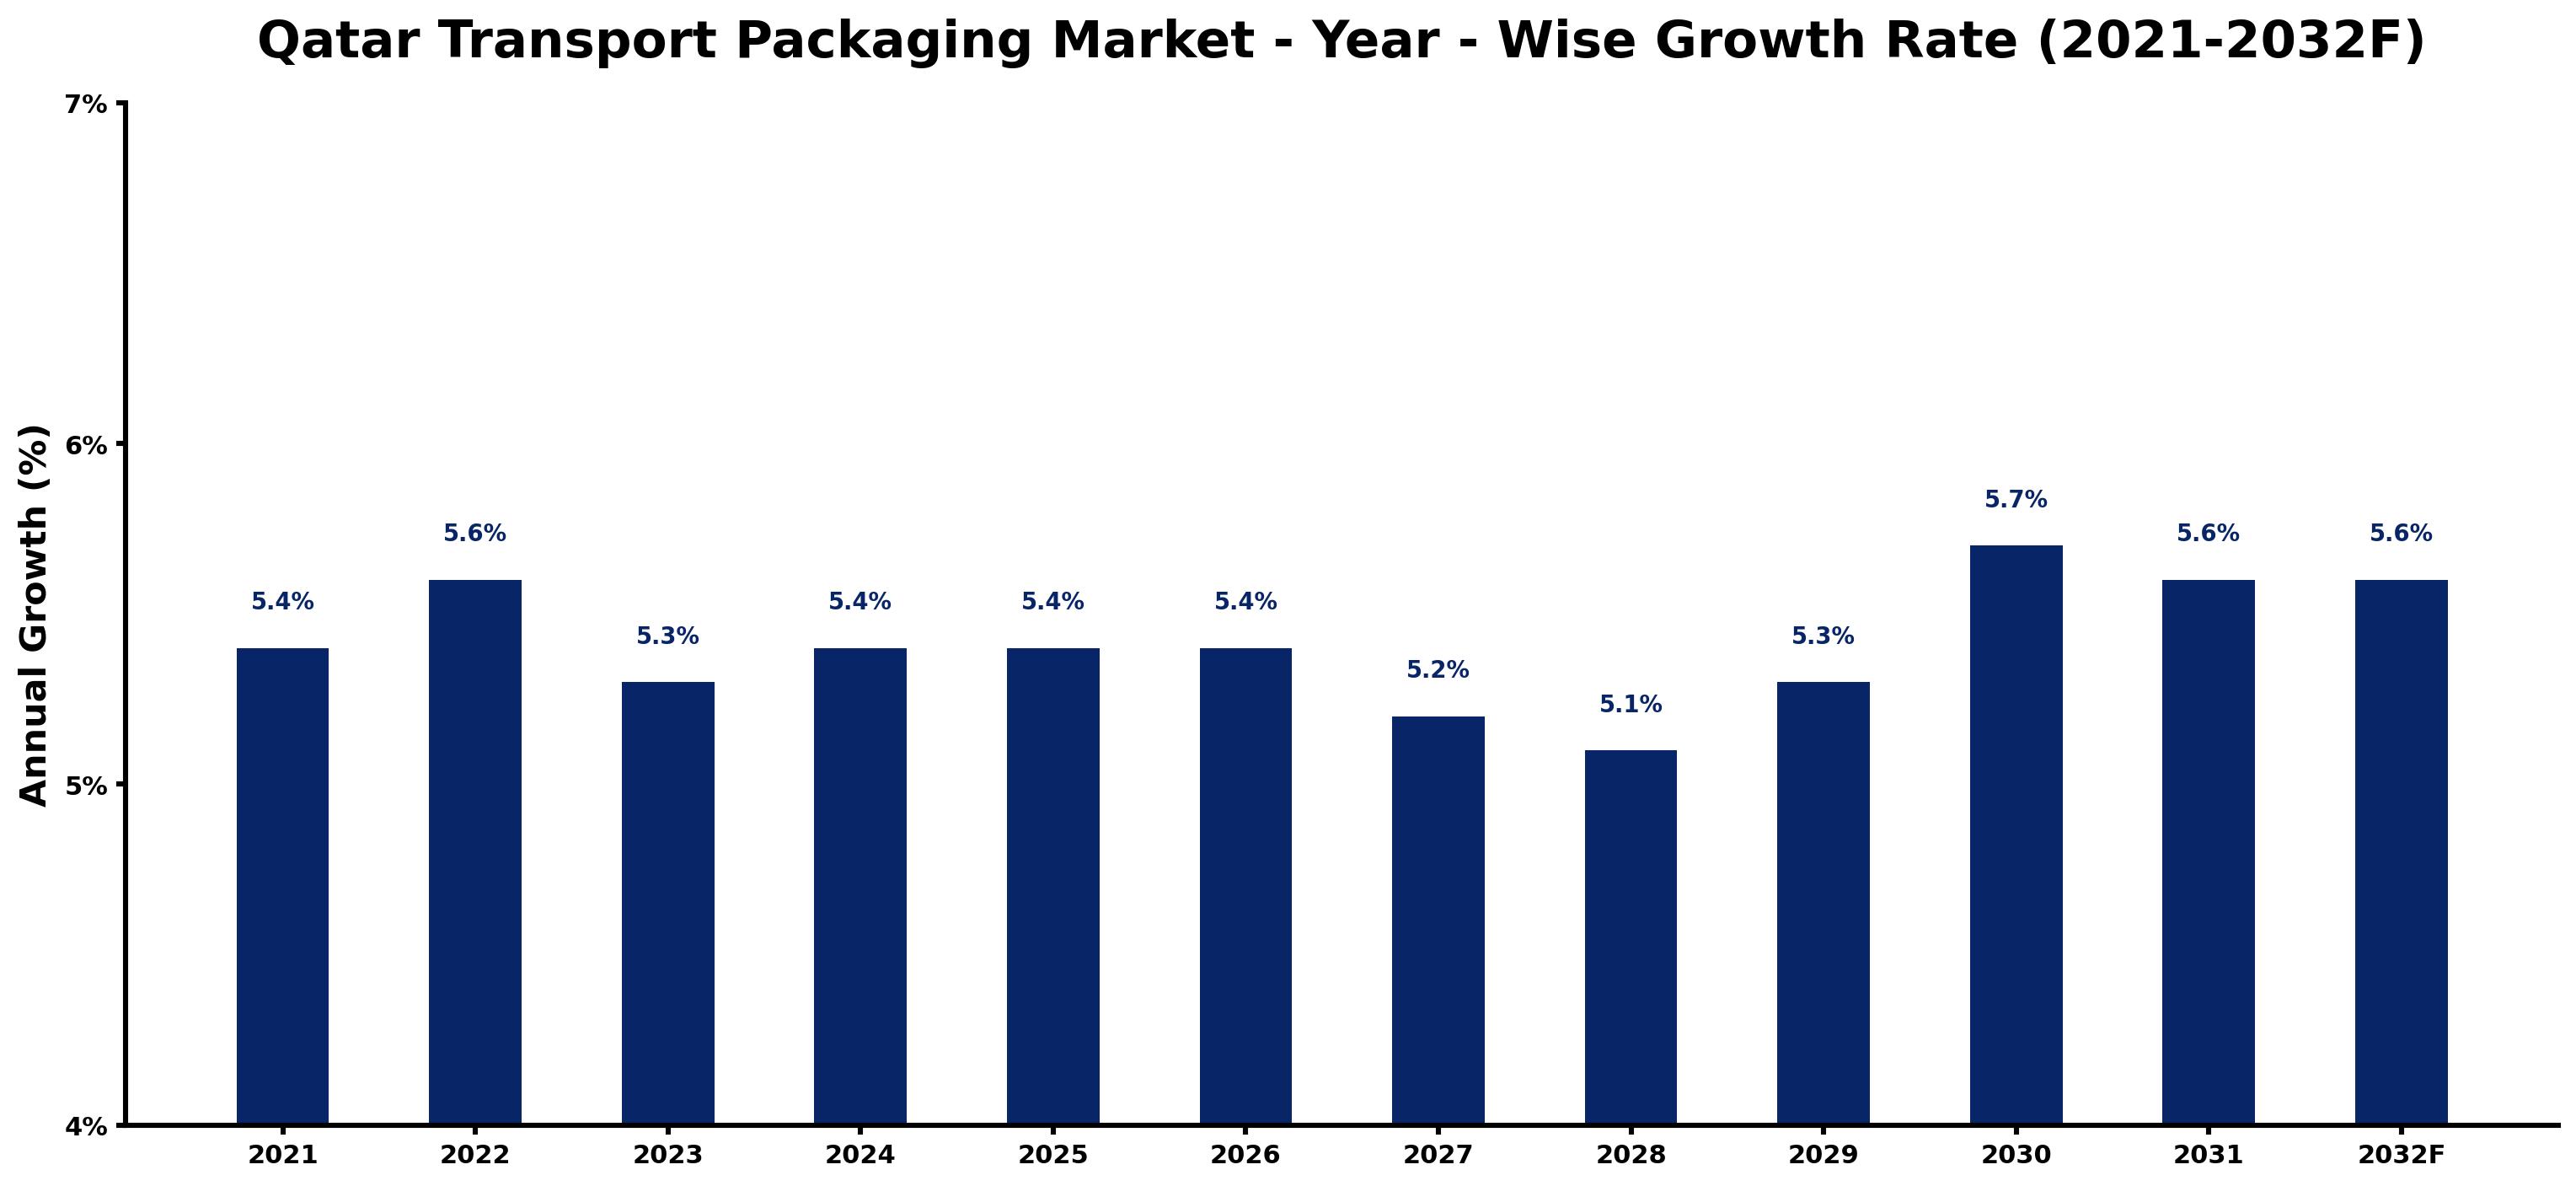
Qatar Transport Packaging Market Growth Rate Analysis (2021-2032)
The Qatar transport packaging market has shown resilient growth, with an annual increase of 5.4% in 2021 and a slight uptick to 5.6% in 2022. This stability reflects ongoing investments in infrastructure and a surge in consumer demand, particularly in the e-commerce sector. The growth pattern is expected to maintain a steady pace, with projections hovering around 5.4% through to 2026. Fluctuations, such as a marginal decline to 5.2% in 2027, can be attributed to global economic conditions and policy adjustments impacting supply chains. However, as digitalization and sustainability efforts gain momentum, the market is anticipated to rebound, achieving a 5.7% growth in 2030, driven by innovation in packaging technologies.
Qatar Transport Packaging Market Year-wise Growth Rate and Key Drivers
This graph highlights how the Qatar Transport Packaging Market has steadily grown over the past five years, supported by major growth factors.
The table below presents the year wise growth rates along with the key drivers influencing the market
| Year | Growth Rate | Major Drivers |
| 2021 | 5.4% | Infrastructure development initiatives stimulated demand for efficient transport packaging solutions. |
| 2022 | 5.6% | E-commerce expansion necessitated innovative packaging tailored for quick deliveries and customer experience. |
| 2023 | 5.3% | Local manufacturing setups in Qatar increased reliance on sustainable and durable packaging options. |
| 2024 | 5.4% | Expo 2023 highlighted Qatar's logistics sector, enhancing transport packaging visibility and requirements. |
| 2025 | 5.4% | Environmental considerations prompted companies to explore biodegradable and recyclable packaging materials. |
| 2026 | 5.4% | Increased foreign investments in Qatar's transport network boosted demand for reliable packaging systems. |
| 2027 | 5.2% | Technological innovations in packaging materials enhanced product protection during transport operations. |
| 2028 | 5.1% | Changes in consumer preferences favored eco-friendly packaging, reshaping market dynamics in Qatar. |
| 2029 | 5.3% | Growing urbanization and population density in Qatar created new logistics and packaging demands. |
| 2030 | 5.7% | Post-World Cup infrastructure projects necessitated efficient transport packaging for construction materials. |
| 2031 | 5.6% | Intensified competition among logistics providers drove improvements in packaging efficiency and solutions. |
| 2032 | 5.6% | Overall economic stability in Qatar encouraged businesses to invest in advanced transport packaging technologies. |
Note - Market size estimations and growth projections presented in this report are based on 6Wresearch's advanced forecasting approach, validated with industry datasets as of June 2026.
Qatar Transport Packaging Market Synopsis
The Qatar Transport Packaging Market is projected to reach US$ 668.10 million and witness significant growth during the forecast period (2026-2032). With a strong compound annual growth rate (CAGR) of 5.4%, the market was valued at US$ 393.2 million in 2025. This upward trajectory is driven by a confluence of factors including urbanization, heightened disposable income among consumers, and a burgeoning e-commerce sector. Additionally, stringent government regulations on packaging materials and rapid industrialization in major cities are contributing to market expansion.
Qatar Transport Packaging Market Growth Drivers
The growth of the Qatar Transport Packaging Market is underpinned by several key drivers:
- Increasing demand for convenience and protective packaging solutions is evident due to changing consumer preferences towards online shopping and delivery services.
- Significant investments in logistics infrastructure are enhancing supply chain efficiencies, thereby fostering demand for packaging solutions.
- The automotive, chemicals, and healthcare sectors are showcasing a rising demand for specialized transport packaging solutions, further driving market growth.
- New regulations concerning product safety and security are compelling manufacturers to adopt enhanced packaging standards, creating opportunities for innovation.
- There is a notable shift towards environment-friendly and sustainable packaging among manufacturers, reflecting consumer preferences and regulatory mandates.
Qatar Transport Packaging Market Challenges and Restraints
While the market is poised for growth, several challenges may impede progress:
- Fluctuating raw material prices can lead to increased operational costs, thereby affecting profitability margins for manufacturers in the transport packaging sector.
- Environmental concerns associated with production processes pose significant challenges to sustainability initiatives, necessitating investment in cleaner technologies.
- A shortage of skilled manpower in the sector can hinder operational efficiency and innovation, impacting overall market performance.
- Regulatory compliance can be a complex and costly process, especially for smaller firms lacking the necessary resources.
- Global economic uncertainties may affect trade dynamics, further complicating the market landscape.
Qatar Transport Packaging Market Government Investment and Initiatives
The Qatari government is actively investing in initiatives to bolster the transport packaging market. Policies aimed at enhancing the logistics and supply chain infrastructure are being prioritized as part of the national development strategy. This includes funding for state-of-the-art transport facilities and incentives for businesses to adopt sustainable packaging practices. The government is also focusing on regulations that promote safety and quality in packaging materials, which reflects its commitment to environmental sustainability and consumer protection.
Qatar Transport Packaging Market Latest Developments (May 2025 - June 2026)
During the period from May 2025 to June 2026, the Qatar Transport Packaging Market witnessed several noteworthy developments. The growth of the e-commerce sector continued to drive demand for innovative packaging solutions that ensure the protection and integrity of goods during transit. Companies within the market are increasingly adopting digital technologies to streamline operations and enhance efficiency. Sustainability has emerged as a priority, with organizations investing in eco-friendly packaging materials and practices. Regulatory updates have also mandated higher safety standards for packaging, prompting businesses to innovate in this area. Overall, the sector is adapting to evolving consumer needs while addressing challenges posed by global economic shifts.
Qatar Transport Packaging Market - Key Attractiveness of the Report
- 10 Years of Market Numbers
- Historical Data Starting from 2022 to 2025
- Base Year: 2025
- Forecast Data until 2032
- Key Performance Indicators Impacting the Market
- Major Upcoming Developments and Projects
Key Highlights of the Report:
- Qatar Transport Packaging Market Outlook
- Market Size of Qatar Transport Packaging Market, 2025
- Forecast of Qatar Transport Packaging Market, 2032
- Historical Data and Forecast of Qatar Transport Packaging Revenues & Volume for the Period 2022-2032F
- Qatar Transport Packaging Market Trend Evolution
- Qatar Transport Packaging Market Drivers and Challenges
- Qatar Transport Packaging Price Trends
- Qatar Transport Packaging Porter's Five Forces
- Qatar Transport Packaging Industry Life Cycle
- Historical Data and Forecast of Qatar Transport Packaging Market Revenues & Volume By Material Type for the Period 2022-2032F
- Historical Data and Forecast of Qatar Transport Packaging Market Revenues & Volume By Plastic for the Period 2022-2032F
- Historical Data and Forecast of Qatar Transport Packaging Market Revenues & Volume By Polyethylene (PE) for the Period 2022-2032F
- Historical Data and Forecast of Qatar Transport Packaging Market Revenues & Volume By Polypropylene (PP) for the Period 2022-2032F
- Historical Data and Forecast of Qatar Transport Packaging Market Revenues & Volume By Polyethylene Terephthalate (PET) for the Period 2022-2032F
- Historical Data and Forecast of Qatar Transport Packaging Market Revenues & Volume By Paper & Paperboard for the Period 2022-2032F
- Historical Data and Forecast of Qatar Transport Packaging Market Revenues & Volume By Metal for the Period 2022-2032F
- Historical Data and Forecast of Qatar Transport Packaging Market Revenues & Volume By Wood for the Period 2022-2032F
- Historical Data and Forecast of Qatar Plastic Transport Packaging Market Revenues & Volume By Others for the Period 2022-2032F
- Historical Data and Forecast of Qatar Transport Packaging Market Revenues & Volume By Packaging Types for the Period 2022-2032F
- Historical Data and Forecast of Qatar Transport Packaging Market Revenues & Volume By Cartons for the Period 2022-2032F
- Historical Data and Forecast of Qatar Transport Packaging Market Revenues & Volume By Wooden crates for the Period 2022-2032F
- Historical Data and Forecast of Qatar Transport Packaging Market Revenues & Volume By Containers for the Period 2022-2032F
- Historical Data and Forecast of Qatar Transport Packaging Market Revenues & Volume By Corrugated boxes for the Period 2022-2032F
- Historical Data and Forecast of Qatar Transport Packaging Market Revenues & Volume By Barrels for the Period 2022-2032F
- Historical Data and Forecast of Qatar Transport Packaging Market Revenues & Volume By IBCs for the Period 2022-2032F
- Historical Data and Forecast of Qatar Transport Packaging Market Revenues & Volume By Strapping for the Period 2022-2032F
- Historical Data and Forecast of Qatar Transport Packaging Market Revenues & Volume By Others for the Period 2022-2032F
- Historical Data and Forecast of Qatar Transport Packaging Market Revenues & Volume By End-users for the Period 2022-2032F
- Historical Data and Forecast of Qatar Transport Packaging Market Revenues & Volume By Agriculture for the Period 2022-2032F
- Historical Data and Forecast of Qatar Transport Packaging Market Revenues & Volume By Automotive for the Period 2022-2032F
- Historical Data and Forecast of Qatar Transport Packaging Market Revenues & Volume By Building & Construction for the Period 2022-2032F
- Historical Data and Forecast of Qatar Transport Packaging Market Revenues & Volume By Chemicals & Pharmaceuticals for the Period 2022-2032F
- Historical Data and Forecast of Qatar Transport Packaging Market Revenues & Volume By Food & Beverages for the Period 2022-2032F
- Historical Data and Forecast of Qatar Transport Packaging Market Revenues & Volume By Metallurgical for the Period 2022-2032F
- Historical Data and Forecast of Qatar Transport Packaging Market Revenues & Volume By Electrical & Electronics for the Period 2022-2032F
- Historical Data and Forecast of Qatar Transport Packaging Market Revenues & Volume By Others for the Period 2022-2032F
- Qatar Transport Packaging Import Export Trade Statistics
- Market Opportunity Assessment By Material Type
- Market Opportunity Assessment By Packaging Types
- Market Opportunity Assessment By End-users
- Qatar Transport Packaging Top Companies Market Share
- Qatar Transport Packaging Competitive Benchmarking By Technical and Operational Parameters
- Qatar Transport Packaging Company Profiles
- Qatar Transport Packaging Key Strategic Recommendations
Frequently Asked Questions About the Market Study (FAQs):
The market is projected to grow at a CAGR of 8.12% during the forecast period from 2026 to 2032.
Key factors include increasing urbanization, rising disposable incomes, and growth in the e-commerce sector, along with government regulations that encourage environmentally friendly packaging.
Challenges include fluctuating raw material prices, environmental concerns linked to production processes, and a lack of skilled labor in the industry.
The pandemic initially increased demand for packaging materials for essential goods, but it also led to supply chain disruptions and necessitated a shift towards digitalization and innovative solutions within the market.
6Wresearch actively monitors the Qatar Transport Packaging Market and publishes its comprehensive annual report, highlighting emerging trends, growth drivers, revenue analysis, and forecast outlook. Our insights help businesses to make data-backed strategic decisions with ongoing market dynamics. Our analysts track relevent industries related to the Qatar Transport Packaging Market, allowing our clients with actionable intelligence and reliable forecasts tailored to emerging regional needs.
Yes, we provide customisation as per your requirements. To learn more, feel free to contact us on sales@6wresearch.com
1 Executive Summary |
2 Introduction |
2.1 Key Highlights of the Report |
2.2 Report Description |
2.3 Market Scope & Segmentation |
2.4 Research Methodology |
2.5 Assumptions |
3 Qatar Transport Packaging Market Overview |
3.1 Qatar Country Macro Economic Indicators |
3.2 Qatar Transport Packaging Market Revenues & Volume, 2022 & 2032F |
3.3 Qatar Transport Packaging Market - Industry Life Cycle |
3.4 Qatar Transport Packaging Market - Porter's Five Forces |
3.5 Qatar Transport Packaging Market Revenues & Volume Share, By Material Type, 2022 & 2032F |
3.6 Qatar Transport Packaging Market Revenues & Volume Share, By Packaging Types, 2022 & 2032F |
3.7 Qatar Transport Packaging Market Revenues & Volume Share, By End-users, 2022 & 2032F |
4 Qatar Transport Packaging Market Dynamics |
4.1 Impact Analysis |
4.2 Market Drivers |
4.3 Market Restraints |
5 Qatar Transport Packaging Market Trends |
6 Qatar Transport Packaging Market, By Types |
6.1 Qatar Transport Packaging Market, By Material Type |
6.1.1 Overview and Analysis |
6.1.2 Qatar Transport Packaging Market Revenues & Volume, By Material Type, 2022-2032F |
6.1.3 Qatar Transport Packaging Market Revenues & Volume, By Plastic, 2022-2032F |
6.1.4 Qatar Transport Packaging Market Revenues & Volume, By Polyethylene (PE), 2022-2032F |
6.1.5 Qatar Transport Packaging Market Revenues & Volume, By Polypropylene (PP), 2022-2032F |
6.1.6 Qatar Transport Packaging Market Revenues & Volume, By Polyethylene Terephthalate (PET), 2022-2032F |
6.1.7 Qatar Transport Packaging Market Revenues & Volume, By Paper & Paperboard, 2022-2032F |
6.1.8 Qatar Transport Packaging Market Revenues & Volume, By Metal, 2022-2032F |
6.1.9 Qatar Transport Packaging Market Revenues & Volume, By Others, 2022-2032F |
6.1.10 Qatar Transport Packaging Market Revenues & Volume, By Others, 2022-2032F |
6.2 Qatar Transport Packaging Market, By Packaging Types |
6.2.1 Overview and Analysis |
6.2.2 Qatar Transport Packaging Market Revenues & Volume, By Cartons, 2022-2032F |
6.2.3 Qatar Transport Packaging Market Revenues & Volume, By Wooden crates, 2022-2032F |
6.2.4 Qatar Transport Packaging Market Revenues & Volume, By Containers, 2022-2032F |
6.2.5 Qatar Transport Packaging Market Revenues & Volume, By Corrugated boxes, 2022-2032F |
6.2.6 Qatar Transport Packaging Market Revenues & Volume, By Barrels, 2022-2032F |
6.2.7 Qatar Transport Packaging Market Revenues & Volume, By IBCs, 2022-2032F |
6.2.8 Qatar Transport Packaging Market Revenues & Volume, By Others, 2022-2032F |
6.2.9 Qatar Transport Packaging Market Revenues & Volume, By Others, 2022-2032F |
6.3 Qatar Transport Packaging Market, By End-users |
6.3.1 Overview and Analysis |
6.3.2 Qatar Transport Packaging Market Revenues & Volume, By Agriculture, 2022-2032F |
6.3.3 Qatar Transport Packaging Market Revenues & Volume, By Automotive, 2022-2032F |
6.3.4 Qatar Transport Packaging Market Revenues & Volume, By Building & Construction, 2022-2032F |
6.3.5 Qatar Transport Packaging Market Revenues & Volume, By Chemicals & Pharmaceuticals, 2022-2032F |
6.3.6 Qatar Transport Packaging Market Revenues & Volume, By Food & Beverages, 2022-2032F |
6.3.7 Qatar Transport Packaging Market Revenues & Volume, By Metallurgical, 2022-2032F |
6.3.8 Qatar Transport Packaging Market Revenues & Volume, By Others, 2022-2032F |
6.3.9 Qatar Transport Packaging Market Revenues & Volume, By Others, 2022-2032F |
7 Qatar Transport Packaging Market Import-Export Trade Statistics |
7.1 Qatar Transport Packaging Market Export to Major Countries |
7.2 Qatar Transport Packaging Market Imports from Major Countries |
8 Qatar Transport Packaging Market Key Performance Indicators |
9 Qatar Transport Packaging Market - Opportunity Assessment |
9.1 Qatar Transport Packaging Market Opportunity Assessment, By Material Type, 2022 & 2032F |
9.2 Qatar Transport Packaging Market Opportunity Assessment, By Packaging Types, 2022 & 2032F |
9.3 Qatar Transport Packaging Market Opportunity Assessment, By End-users, 2022 & 2032F |
10 Qatar Transport Packaging Market - Competitive Landscape |
10.1 Qatar Transport Packaging Market Revenue Share, By Companies, 2025 |
10.2 Qatar Transport Packaging Market Competitive Benchmarking, By Operating and Technical Parameters |
11 Company Profiles |
12 Recommendations |
13 Disclaimer |
Global Go To Market Strategy - 2030
Export potential enables firms to identify high-growth global markets with greater confidence by combining advanced trade intelligence with a structured quantitative methodology. The framework analyzes emerging demand trends and country-level import patterns while integrating macroeconomic and trade datasets such as GDP and population forecasts, bilateral import–export flows, tariff structures, elasticity differentials between developed and developing economies, geographic distance, and import demand projections. Using weighted trade values from 2020–2024 as the base period to project country-to-country export potential for 2030, these inputs are operationalized through calculated drivers such as gravity model parameters, tariff impact factors, and projected GDP per-capita growth. Through an analysis of hidden potentials, demand hotspots, and market conditions that are most favorable to success, this method enables firms to focus on target countries, maximize returns, and global expansion with data, backed by accuracy.
By factoring in the projected importer demand gap that is currently unmet and could be potential opportunity, it identifies the potential for the Exporter (Country) among 190 countries, against the general trade analysis, which identifies the biggest importer or exporter.
To discover high-growth global markets and optimize your business strategy:
Click Here
Pricing
- Single User License$ 1,995
- Department License$ 2,400
- Site License$ 3,120
- Global License$ 3,795

Leadership Perspectives from Industry Events
Search
Thought Leadership and Analyst Meet


Our Clients
6WResearch In News
- India Air Conditioner Market Set for Strong Rebound in 2026 After Weather-Led Correction and GST-Driven Recovery: 6Wresearch
- ADAS in India: How Automatic Emergency Braking, Blind Spot Detection & Driver Monitoring are Transforming Road Safety
- Doha a strategic location for EV manufacturing hub: IPA Qatar
- Demand for luxury TVs surging in the GCC, says Samsung
- Empowering Growth: The Thriving Journey of Bangladesh’s Cable Industry
- Demand for luxury TVs surging in the GCC, says Samsung
Latest Reports
- Nicaragua RPG Gaming Market (2026-2032)
- New Zealand RPG Gaming Market (2026-2032)
- Netherlands RPG Gaming Market (2026-2032)
- Nauru RPG Gaming Market (2026-2032)
- Namibia RPG Gaming Market (2026-2032)
- Mozambique RPG Gaming Market (2026-2032)
- Montenegro RPG Gaming Market (2026-2032)
- Mongolia RPG Gaming Market (2026-2032)
- Monaco RPG Gaming Market (2026-2032)
- Micronesia RPG Gaming Market (2026-2032)
Industry Events and Analyst Meet

HIMTEX 2026

India Refining Summit 2026

India EV Show 2026

EV tech India Expo 2026

Auto Tech Asia 2026
Whitepaper
- Middle East & Africa Commercial Security Market Click here to view more.
- Middle East & Africa Fire Safety Systems & Equipment Market Click here to view more.
- GCC Drone Market Click here to view more.
- Middle East Lighting Fixture Market Click here to view more.
- GCC Physical & Perimeter Security Market Click here to view more.