United States (US) Transport Packaging Market (2026-2032) | Analysis, Revenue, Outlook, Size, Forecast, Growth, Industry, Companies, Share, Value, Trends
Market Forecast By Material Type (Plastic, Polyethylene (PE), Polypropylene (PP), Polyethylene Terephthalate (PET), Paper & Paperboard, Metal, Wood, Others), By Packaging Types (Cartons, Wooden crates, Containers, Corrugated boxes, Barrels, IBCs, Strapping, Others), By End-users (Agriculture, Automotive, Building & Construction, Chemicals & Pharmaceuticals, Food & Beverages, Metallurgical, Electrical & Electronics, Others) And Competitive Landscape
| Product Code: ETC006621 | Publication Date: Sep 2020 | Updated Date: Jun 2026 | Product Type: Report | |
| Publisher: 6Wresearch | Author: Vasudha | No. of Pages: 70 | No. of Figures: 35 | No. of Tables: 5 |
United States (US) Transport Packaging Market Summary
The united states (us) transport packaging market was estimated at USD 138 Million in 2025 and is projected to reach USD 162 Million by 2032, growing at a CAGR of 2.5% from 2026 to 2032.
United States (US) Transport Packaging Market Year-wise Growth Rate and Key Drivers
This graph highlights how the United States (US) Transport Packaging Market has steadily grown over the past five years, supported by major growth factors.
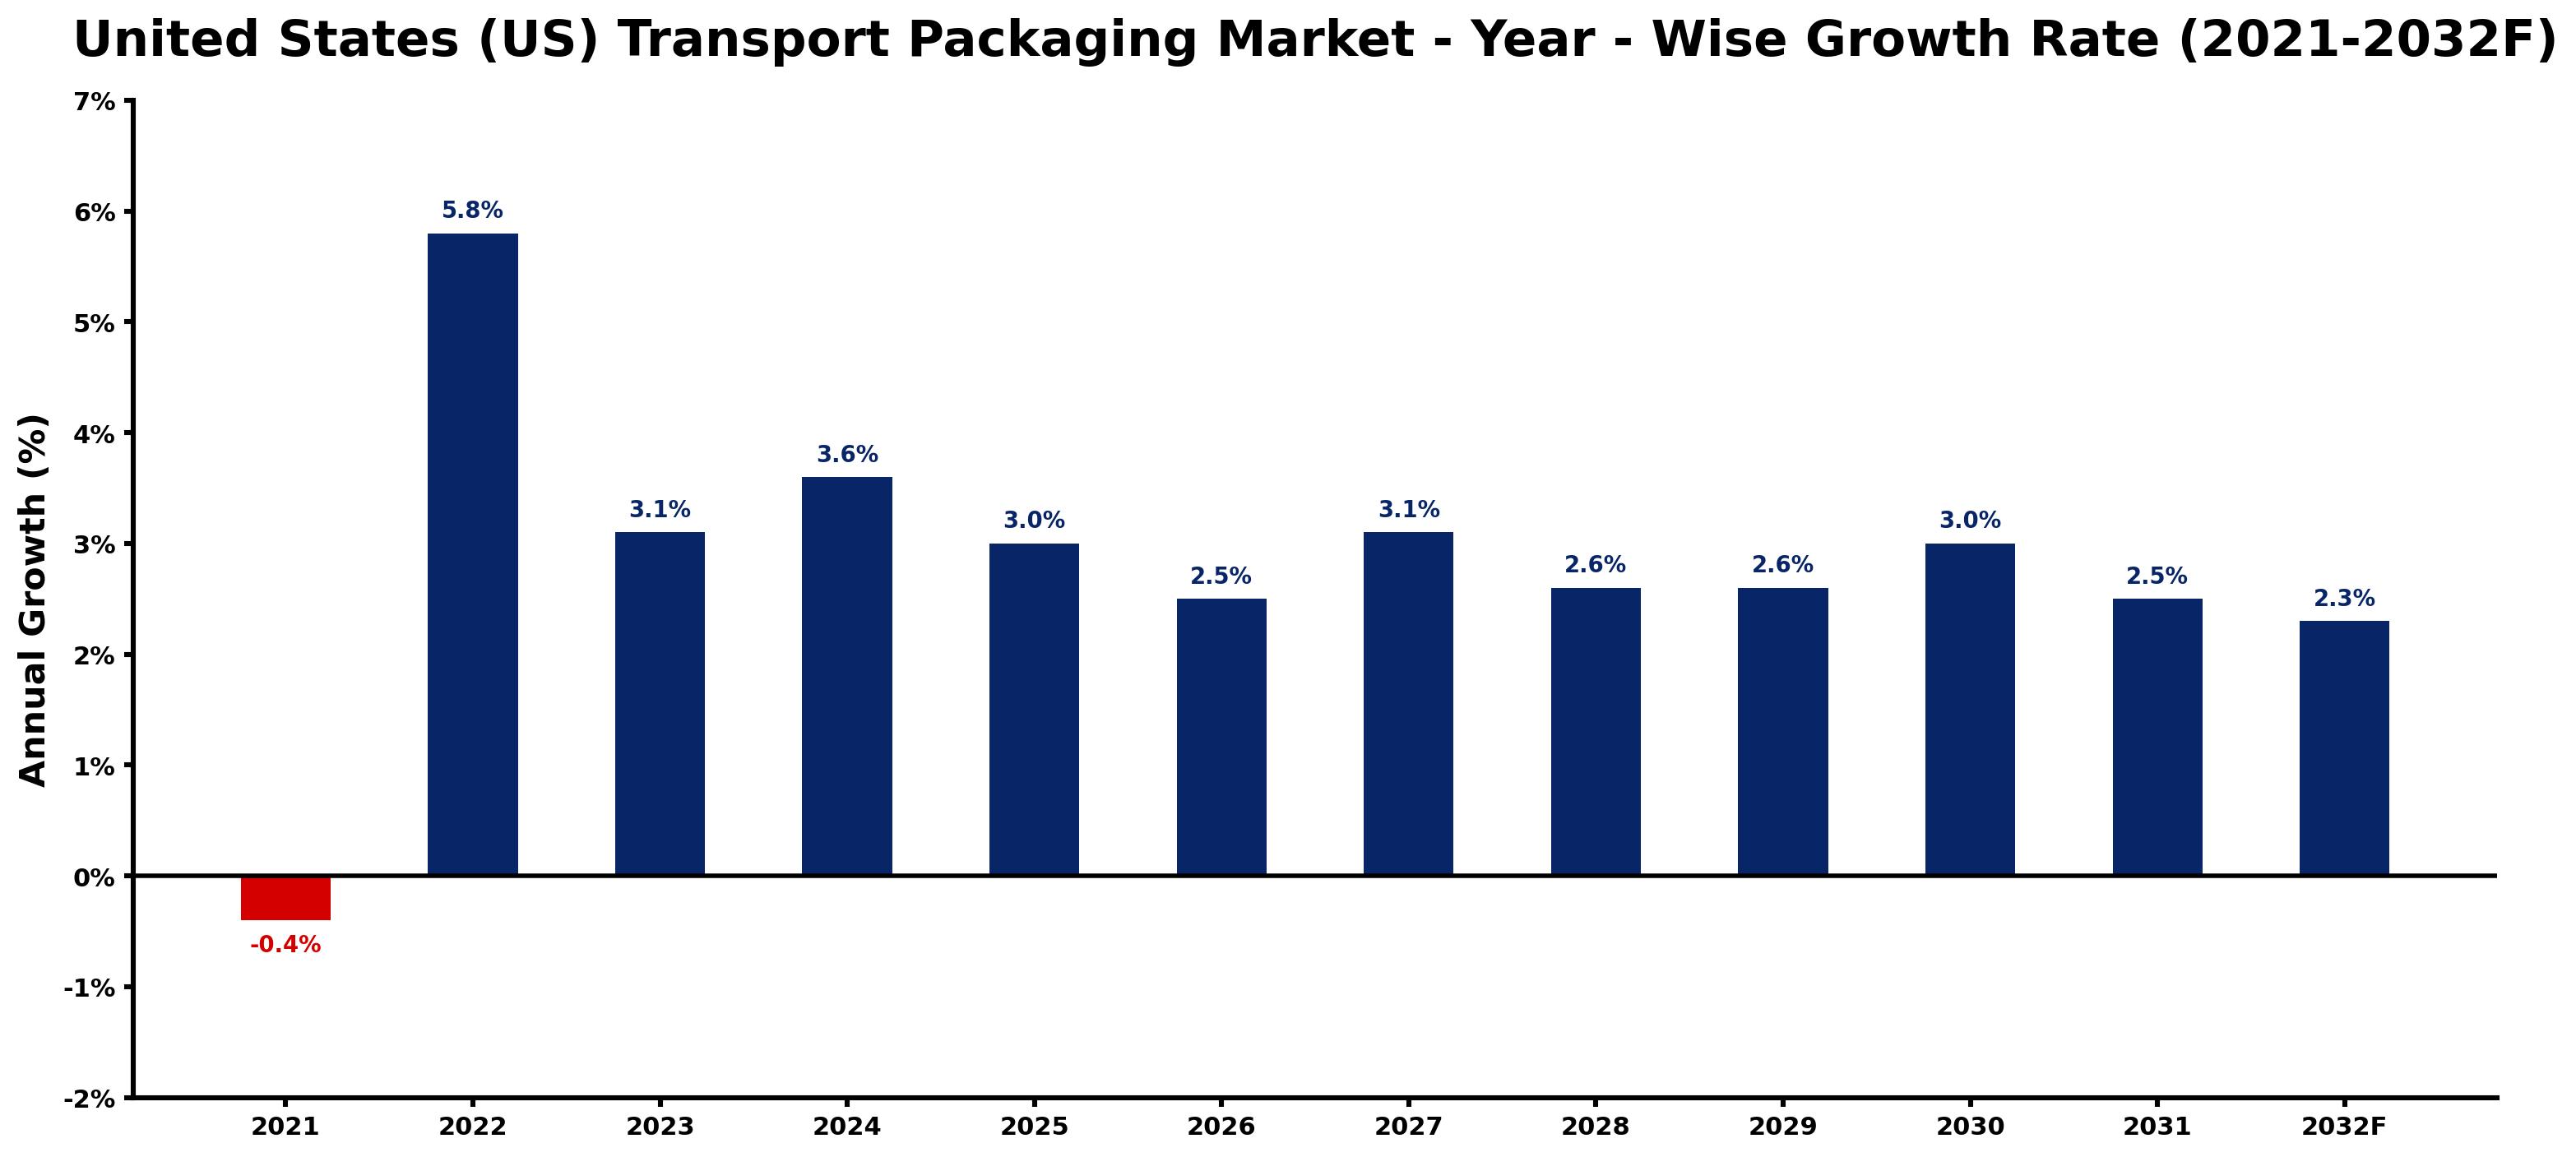
The table below presents the year wise growth rates along with the key drivers influencing the market
| Year | Growth Rate | Major Drivers |
| 2021 | -0.4% | Supply chain disruptions caused by the pandemic hampered availability and timeliness of transport packaging materials. |
| 2022 | 5.8% | E-commerce's expansion demands innovative transport packaging for last-mile delivery optimization. |
| 2023 | 3.1% | Consumer preferences shift towards eco-friendly materials, influencing packaging design strategies. |
| 2024 | 3.6% | Supply chain disruptions ignite interest in robust, resilient packaging solutions. |
| 2025 | 3.0% | Technological improvements in packaging machinery enhance production efficiency and sustainability. |
| 2026 | 2.5% | Corporate sustainability pledges stimulate investment in biodegradable and recyclable packaging options. |
| 2027 | 3.1% | Emerging market entrants focus on niche transport packaging markets, diversifying offerings. |
| 2028 | 2.6% | Retailer collaborations promote standardized packaging to simplify logistics and reduce waste. |
| 2029 | 2.6% | Innovations in smart packaging technologies provide real-time tracking and inventory management. |
| 2030 | 3.0% | Rising consumer awareness of environmental issues reshapes transport packaging industry standards. |
| 2031 | 2.5% | Integration of AI and IoT in packaging systems improves operational efficiency and analytics. |
| 2032 | 2.3% | Circular economy principles gain traction, encouraging packaging reuse and recycling initiatives. |
Note - Market size estimations and growth projections presented in this report are based on 6Wresearch's advanced forecasting approach, validated with industry datasets as of June 2026.
United States (US) Transport Packaging Market Synopsis
The United States (US) Transport Packaging Market is projected to reach 2.5% and witness significant growth during the forecast period (2026-2032). This market is characterized by a robust demand for advanced packaging solutions that ensure the safe transportation of goods across diverse sectors, including food and beverage, electronics, pharmaceuticals, and automotive. With sustainability as a growing concern, the market is evolving towards eco-friendly materials and technologies that enhance efficiency and compliance with regulatory standards.
United States (US) Transport Packaging Market Growth Drivers
Several factors are driving the expansion of the United States (US) Transport Packaging Market. Key drivers include:
- Increased e-commerce activities, which have amplified the demand for packaging solutions that can withstand various shipping conditions while ensuring product integrity.
- The globalization of supply chains necessitating reliable, efficient transport packaging to meet international shipping standards.
- Heightened awareness regarding environmental sustainability propelling the adoption of recyclable and biodegradable packaging materials.
- Technological advancements, including RFID and IoT, facilitating enhanced tracking and monitoring systems during transit.
- Regulatory requirements demanding higher safety standards in product packaging, particularly in sensitive industries such as pharmaceuticals and food.
United States (US) Transport Packaging Market Trends and Opportunities
The landscape of the United States (US) Transport Packaging Market is marked by several notable trends that present promising opportunities for stakeholders:
- A shift towards sustainable packaging solutions is evident, with companies increasingly investing in eco-friendly materials that minimize environmental impact.
- Automation in packaging processes is becoming prevalent, enhancing operational efficiency and reducing human error in packaging operations.
- Innovative packaging designs are emerging to improve consumer experience, particularly in e-commerce, where unboxing plays a pivotal role in customer satisfaction.
- There is a rising emphasis on lightweight packaging materials that reduce shipping costs and carbon footprint without compromising durability.
- Collaborations between technology providers and packaging manufacturers are fostering the development of smart packaging solutions that integrate advanced tracking technologies.
United States (US) Transport Packaging Market Challenges and Restraints
Despite its growth potential, the United States (US) Transport Packaging Market faces several challenges that could impact its trajectory:
- Fluctuations in raw material prices impacting production costs and profit margins for manufacturers.
- The increasing pressure to adopt sustainable practices leading to higher research and development investments.
- Evolving regulatory frameworks that may impose additional compliance costs and operational challenges.
- The demand for innovative packaging solutions necessitating continuous investment in technology and design.
- Competition among market players for market share, pushing companies to differentiate their offerings amidst changing consumer preferences.
United States (US) Transport Packaging Market Government Investment and Initiatives
Government initiatives in the United States are playing a significant role in shaping the transport packaging sector. Focused predominantly on sustainability, these initiatives encourage the use of eco-friendly packaging solutions. Key actions include:
- Establishment of regulations aimed at reducing carbon emissions through enhanced packaging practices.
- The promotion of programs like the Sustainable Packaging Coalition advocating for innovative and environmentally responsible packaging materials.
- Projects under the Environmental Protection Agency's SmartWay Transport Partnership focusing on improving logistic efficiency and environmental performance.
- Funding and grants allocated for research and development of sustainable packaging technologies.
- Collaboration with industry stakeholders to develop guidelines for best practices in transport packaging, ensuring compliance with safety and environmental standards.
United States (US) Transport Packaging Market Latest Developments (May 2025 - June 2026)
In the period from May 2025 to June 2026, the United States (US) Transport Packaging Market has witnessed several noteworthy developments that reflect its adaptive nature:
- A surge in demand for packaging solutions that cater to the unique requirements of the growing e-commerce sector, emphasizing durability and customer experience.
- Increased investments in smart packaging technology, supporting better supply chain visibility and efficiency.
- Enhanced focus on sustainable practices, with more companies committing to reducing their carbon footprint through innovative packaging materials.
- Ongoing collaborations between packaging firms and technology developers to create packaging solutions that provide real-time tracking capabilities.
- Regulatory changes encouraging the adoption of sustainable packaging practices have prompted many companies to reassess their packaging strategies in compliance with new standards.
United States (US) Transport Packaging Market - Key Attractiveness of the Report
- 10 Years of Market Numbers
- Historical Data Starting from 2022 to 2025
- Base Year: 2025
- Forecast Data until 2032
- Key Performance Indicators Impacting the Market
- Major Upcoming Developments and Projects
Key Highlights of the Report:
- United States (US) Transport Packaging Market Outlook
- Market Size of United States (US) Transport Packaging Market, 2025
- Forecast of United States (US) Transport Packaging Market, 2032F
- Historical Data and Forecast of United States (US) Transport Packaging Revenues & Volume for the Period 2022-2032F
- United States (US) Transport Packaging Market Trend Evolution
- United States (US) Transport Packaging Market Drivers and Challenges
- United States (US) Transport Packaging Price Trends
- United States (US) Transport Packaging Porter's Five Forces
- United States (US) Transport Packaging Industry Life Cycle
- Historical Data and Forecast of United States (US) Transport Packaging Market Revenues & Volume By Material Type for the Period 2022-2032F
- Historical Data and Forecast of United States (US) Transport Packaging Market Revenues & Volume By Plastic for the Period 2022-2032F
- Historical Data and Forecast of United States (US) Transport Packaging Market Revenues & Volume By Polyethylene (PE) for the Period 2022-2032F
- Historical Data and Forecast of United States (US) Transport Packaging Market Revenues & Volume By Polypropylene (PP) for the Period 2022-2032F
- Historical Data and Forecast of United States (US) Transport Packaging Market Revenues & Volume By Polyethylene Terephthalate (PET) for the Period 2022-2032F
- Historical Data and Forecast of United States (US) Transport Packaging Market Revenues & Volume By Paper & Paperboard for the Period 2022-2032F
- Historical Data and Forecast of United States (US) Transport Packaging Market Revenues & Volume By Metal for the Period 2022-2032F
- Historical Data and Forecast of United States (US) Transport Packaging Market Revenues & Volume By Wood for the Period 2022-2032F
- Historical Data and Forecast of United States (US) Plastic Transport Packaging Market Revenues & Volume By Others for the Period 2022-2032F
- Historical Data and Forecast of United States (US) Transport Packaging Market Revenues & Volume By Packaging Types for the Period 2022-2032F
- Historical Data and Forecast of United States (US) Transport Packaging Market Revenues & Volume By Cartons for the Period 2022-2032F
- Historical Data and Forecast of United States (US) Transport Packaging Market Revenues & Volume By Wooden crates for the Period 2022-2032F
- Historical Data and Forecast of United States (US) Transport Packaging Market Revenues & Volume By Containers for the Period 2022-2032F
- Historical Data and Forecast of United States (US) Transport Packaging Market Revenues & Volume By Corrugated boxes for the Period 2022-2032F
- Historical Data and Forecast of United States (US) Transport Packaging Market Revenues & Volume By Barrels for the Period 2022-2032F
- Historical Data and Forecast of United States (US) Transport Packaging Market Revenues & Volume By IBCs for the Period 2022-2032F
- Historical Data and Forecast of United States (US) Transport Packaging Market Revenues & Volume By Strapping for the Period 2022-2032F
- Historical Data and Forecast of United States (US) Transport Packaging Market Revenues & Volume By Others for the Period 2022-2032F
- Historical Data and Forecast of United States (US) Transport Packaging Market Revenues & Volume By End-users for the Period 2022-2032F
- Historical Data and Forecast of United States (US) Transport Packaging Market Revenues & Volume By Agriculture for the Period 2022-2032F
- Historical Data and Forecast of United States (US) Transport Packaging Market Revenues & Volume By Automotive for the Period 2022-2032F
- Historical Data and Forecast of United States (US) Transport Packaging Market Revenues & Volume By Building & Construction for the Period 2022-2032F
- Historical Data and Forecast of United States (US) Transport Packaging Market Revenues & Volume By Chemicals & Pharmaceuticals for the Period 2022-2032F
- Historical Data and Forecast of United States (US) Transport Packaging Market Revenues & Volume By Food & Beverages for the Period 2022-2032F
- Historical Data and Forecast of United States (US) Transport Packaging Market Revenues & Volume By Metallurgical for the Period 2022-2032F
- Historical Data and Forecast of United States (US) Transport Packaging Market Revenues & Volume By Electrical & Electronics for the Period 2022-2032F
- Historical Data and Forecast of United States (US) Transport Packaging Market Revenues & Volume By Others for the Period 2022-2032F
- United States (US) Transport Packaging Import Export Trade Statistics
- Market Opportunity Assessment By Material Type
- Market Opportunity Assessment By Packaging Types
- Market Opportunity Assessment By End-users
- United States (US) Transport Packaging Top Companies Market Share
- United States (US) Transport Packaging Competitive Benchmarking By Technical and Operational Parameters
- United States (US) Transport Packaging Company Profiles
- United States (US) Transport Packaging Key Strategic Recommendations
Frequently Asked Questions About the Market Study (FAQs):
Growth drivers include the rise of e-commerce, globalization of supply chains, and the demand for sustainable packaging solutions.
Trends include an increased focus on sustainability, automation in packaging processes, and innovations in packaging design aimed at enhancing customer experience.
Key challenges involve fluctuating raw material prices, evolving regulations, and the necessity for continual innovation to meet consumer demands.
Government policies focus on sustainability, supporting initiatives for eco-friendly packaging materials and driving innovation through funding and partnerships.
6Wresearch actively monitors the United States (US) Transport Packaging Market and publishes its comprehensive annual report, highlighting emerging trends, growth drivers, revenue analysis, and forecast outlook. Our insights help businesses to make data-backed strategic decisions with ongoing market dynamics. Our analysts track relevent industries related to the United States (US) Transport Packaging Market, allowing our clients with actionable intelligence and reliable forecasts tailored to emerging regional needs.
Yes, we provide customisation as per your requirements. To learn more, feel free to contact us on sales@6wresearch.com
1 Executive Summary |
2 Introduction |
2.1 Key Highlights of the Report |
2.2 Report Description |
2.3 Market Scope & Segmentation |
2.4 Research Methodology |
2.5 Assumptions |
3 United States (US) Transport Packaging Market Overview |
3.1 United States (US) Country Macro Economic Indicators |
3.2 United States (US) Transport Packaging Market Revenues & Volume, 2022 & 2032F |
3.3 United States (US) Transport Packaging Market - Industry Life Cycle |
3.4 United States (US) Transport Packaging Market - Porter's Five Forces |
3.5 United States (US) Transport Packaging Market Revenues & Volume Share, By Material Type, 2022 & 2032F |
3.6 United States (US) Transport Packaging Market Revenues & Volume Share, By Packaging Types, 2022 & 2032F |
3.7 United States (US) Transport Packaging Market Revenues & Volume Share, By End-users, 2022 & 2032F |
4 United States (US) Transport Packaging Market Dynamics |
4.1 Impact Analysis |
4.2 Market Drivers |
4.2.1 Increasing e-commerce activities leading to higher demand for transport packaging |
4.2.2 Growth in the manufacturing sector requiring efficient packaging solutions for transportation |
4.2.3 Emphasis on sustainability driving the adoption of eco-friendly transport packaging materials |
4.3 Market Restraints |
4.3.1 Fluctuating raw material prices impacting production costs |
4.3.2 Stringent regulations regarding the use of certain packaging materials |
4.3.3 Competition from alternative packaging solutions like reusable packaging systems |
5 United States (US) Transport Packaging Market Trends |
6 United States (US) Transport Packaging Market, By Types |
6.1 United States (US) Transport Packaging Market, By Material Type |
6.1.1 Overview and Analysis |
6.1.2 United States (US) Transport Packaging Market Revenues & Volume, By Material Type, 2022-2032F |
6.1.3 United States (US) Transport Packaging Market Revenues & Volume, By Plastic, 2022-2032F |
6.1.4 United States (US) Transport Packaging Market Revenues & Volume, By Polyethylene (PE), 2022-2032F |
6.1.5 United States (US) Transport Packaging Market Revenues & Volume, By Polypropylene (PP), 2022-2032F |
6.1.6 United States (US) Transport Packaging Market Revenues & Volume, By Polyethylene Terephthalate (PET), 2022-2032F |
6.1.7 United States (US) Transport Packaging Market Revenues & Volume, By Paper & Paperboard, 2022-2032F |
6.1.8 United States (US) Transport Packaging Market Revenues & Volume, By Metal, 2022-2032F |
6.1.9 United States (US) Transport Packaging Market Revenues & Volume, By Others, 2022-2032F |
6.1.10 United States (US) Transport Packaging Market Revenues & Volume, By Others, 2022-2032F |
6.2 United States (US) Transport Packaging Market, By Packaging Types |
6.2.1 Overview and Analysis |
6.2.2 United States (US) Transport Packaging Market Revenues & Volume, By Cartons, 2022-2032F |
6.2.3 United States (US) Transport Packaging Market Revenues & Volume, By Wooden crates, 2022-2032F |
6.2.4 United States (US) Transport Packaging Market Revenues & Volume, By Containers, 2022-2032F |
6.2.5 United States (US) Transport Packaging Market Revenues & Volume, By Corrugated boxes, 2022-2032F |
6.2.6 United States (US) Transport Packaging Market Revenues & Volume, By Barrels, 2022-2032F |
6.2.7 United States (US) Transport Packaging Market Revenues & Volume, By IBCs, 2022-2032F |
6.2.8 United States (US) Transport Packaging Market Revenues & Volume, By Others, 2022-2032F |
6.2.9 United States (US) Transport Packaging Market Revenues & Volume, By Others, 2022-2032F |
6.3 United States (US) Transport Packaging Market, By End-users |
6.3.1 Overview and Analysis |
6.3.2 United States (US) Transport Packaging Market Revenues & Volume, By Agriculture, 2022-2032F |
6.3.3 United States (US) Transport Packaging Market Revenues & Volume, By Automotive, 2022-2032F |
6.3.4 United States (US) Transport Packaging Market Revenues & Volume, By Building & Construction, 2022-2032F |
6.3.5 United States (US) Transport Packaging Market Revenues & Volume, By Chemicals & Pharmaceuticals, 2022-2032F |
6.3.6 United States (US) Transport Packaging Market Revenues & Volume, By Food & Beverages, 2022-2032F |
6.3.7 United States (US) Transport Packaging Market Revenues & Volume, By Metallurgical, 2022-2032F |
6.3.8 United States (US) Transport Packaging Market Revenues & Volume, By Others, 2022-2032F |
6.3.9 United States (US) Transport Packaging Market Revenues & Volume, By Others, 2022-2032F |
7 United States (US) Transport Packaging Market Import-Export Trade Statistics |
7.1 United States (US) Transport Packaging Market Export to Major Countries |
7.2 United States (US) Transport Packaging Market Imports from Major Countries |
8 United States (US) Transport Packaging Market Key Performance Indicators |
8.1 Carbon footprint reduction achieved through the use of sustainable transport packaging materials |
8.2 Percentage increase in demand for transport packaging from e-commerce businesses |
8.3 Efficiency improvements in transportation and logistics processes through the adoption of innovative packaging solutions |
9 United States (US) Transport Packaging Market - Opportunity Assessment |
9.1 United States (US) Transport Packaging Market Opportunity Assessment, By Material Type, 2022 & 2032F |
9.2 United States (US) Transport Packaging Market Opportunity Assessment, By Packaging Types, 2022 & 2032F |
9.3 United States (US) Transport Packaging Market Opportunity Assessment, By End-users, 2022 & 2032F |
10 United States (US) Transport Packaging Market - Competitive Landscape |
10.1 United States (US) Transport Packaging Market Revenue Share, By Companies, 2025 |
10.2 United States (US) Transport Packaging Market Competitive Benchmarking, By Operating and Technical Parameters |
11 Company Profiles |
12 Recommendations |
13 Disclaimer |
Global Go To Market Strategy - 2030
Export potential enables firms to identify high-growth global markets with greater confidence by combining advanced trade intelligence with a structured quantitative methodology. The framework analyzes emerging demand trends and country-level import patterns while integrating macroeconomic and trade datasets such as GDP and population forecasts, bilateral import–export flows, tariff structures, elasticity differentials between developed and developing economies, geographic distance, and import demand projections. Using weighted trade values from 2020–2024 as the base period to project country-to-country export potential for 2030, these inputs are operationalized through calculated drivers such as gravity model parameters, tariff impact factors, and projected GDP per-capita growth. Through an analysis of hidden potentials, demand hotspots, and market conditions that are most favorable to success, this method enables firms to focus on target countries, maximize returns, and global expansion with data, backed by accuracy.
By factoring in the projected importer demand gap that is currently unmet and could be potential opportunity, it identifies the potential for the Exporter (Country) among 190 countries, against the general trade analysis, which identifies the biggest importer or exporter.
To discover high-growth global markets and optimize your business strategy:
Click Here
Pricing
- Single User License$ 1,995
- Department License$ 2,400
- Site License$ 3,120
- Global License$ 3,795

Leadership Perspectives from Industry Events
Search
Thought Leadership and Analyst Meet


Our Clients
6WResearch In News
- India Air Conditioner Market Set for Strong Rebound in 2026 After Weather-Led Correction and GST-Driven Recovery: 6Wresearch
- ADAS in India: How Automatic Emergency Braking, Blind Spot Detection & Driver Monitoring are Transforming Road Safety
- Doha a strategic location for EV manufacturing hub: IPA Qatar
- Demand for luxury TVs surging in the GCC, says Samsung
- Empowering Growth: The Thriving Journey of Bangladesh’s Cable Industry
- Demand for luxury TVs surging in the GCC, says Samsung
Latest Reports
- Nicaragua RPG Gaming Market (2026-2032)
- New Zealand RPG Gaming Market (2026-2032)
- Netherlands RPG Gaming Market (2026-2032)
- Nauru RPG Gaming Market (2026-2032)
- Namibia RPG Gaming Market (2026-2032)
- Mozambique RPG Gaming Market (2026-2032)
- Montenegro RPG Gaming Market (2026-2032)
- Mongolia RPG Gaming Market (2026-2032)
- Monaco RPG Gaming Market (2026-2032)
- Micronesia RPG Gaming Market (2026-2032)
Industry Events and Analyst Meet

EV India Expo 2026

HIMTEX 2026

India Refining Summit 2026

India EV Show 2026

EV tech India Expo 2026
Whitepaper
- Middle East & Africa Commercial Security Market Click here to view more.
- Middle East & Africa Fire Safety Systems & Equipment Market Click here to view more.
- GCC Drone Market Click here to view more.
- Middle East Lighting Fixture Market Click here to view more.
- GCC Physical & Perimeter Security Market Click here to view more.