Qatar Underground Utility Mapping Market Size & Growth Rate (2026-2032)
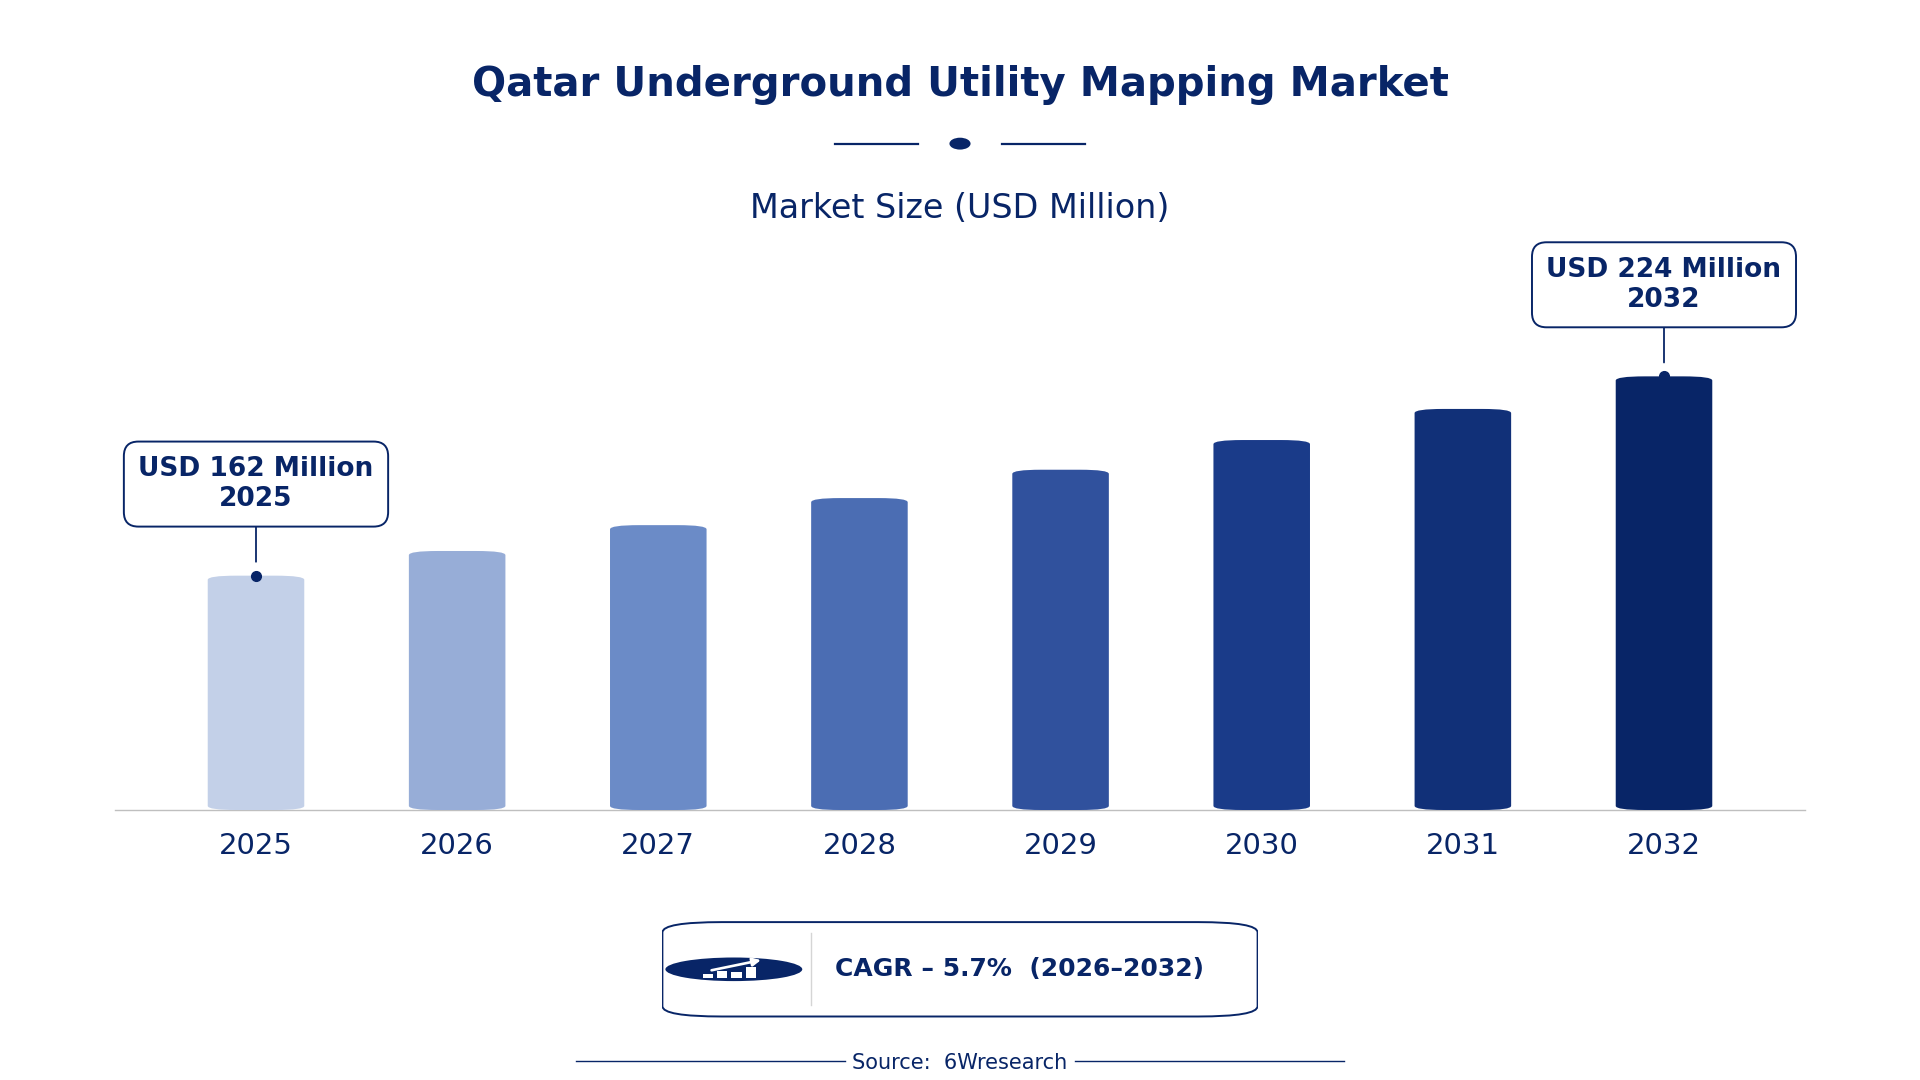
The Qatar Underground Utility Mapping Market was estimated at USD 162 Million in 2025 and is projected to reach USD 224 Million by 2032, growing at a CAGR of 5.7% from 2026 to 2032.
Qatar Underground Utility Mapping Market Synopsis
The demand for underground utility mapping in Qatar is surging, driven by ambitious urbanization efforts and extensive infrastructure projects. As construction activities ramp up, the need for accurate mapping of underground utilities becomes increasingly critical to prevent costly accidents and ensure project efficiency.
Looking ahead, this market is set for significant growth. Key collaborations between technology providers and construction firms are enhancing the precision of utility data. Government regulations prioritizing advanced mapping technologies further solidify the market's positive trajectory, promising a dynamic future for stakeholders involved.
Qatar Underground Utility Mapping Market Year-wise Growth Rate and Key Drivers
This graph illustrates the annual growth rates of the Qatar Underground Utility Mapping Market from 2021 to 2032, highlighting a steady upward trajectory and projected expansion over the forecast period.
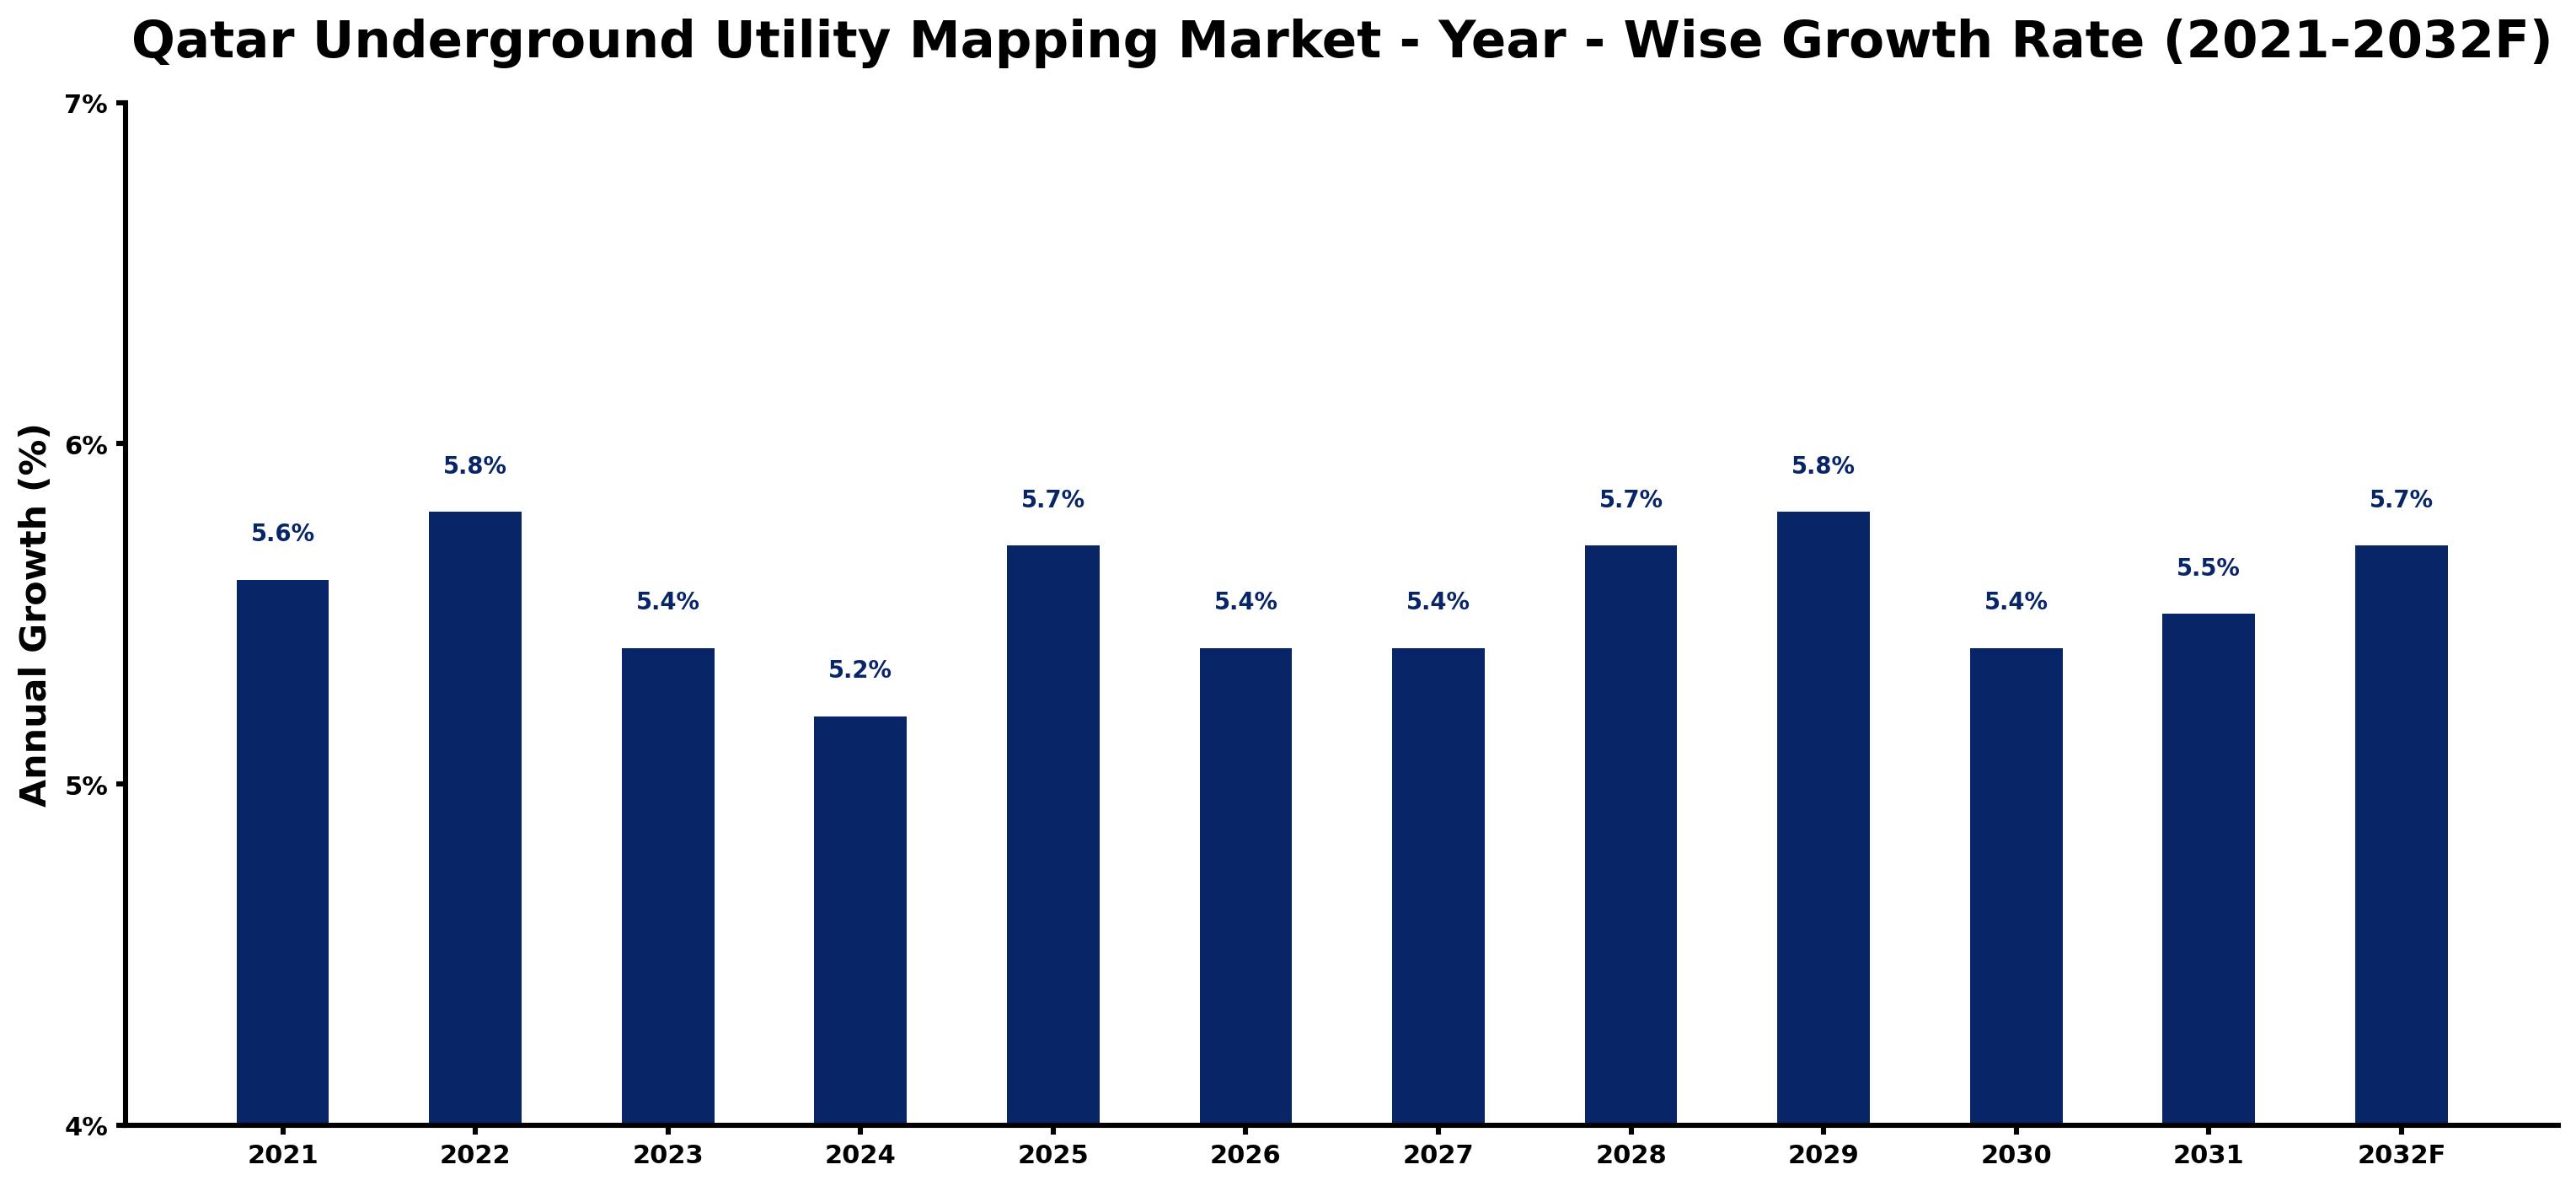
The table below presents the year‑wise growth rates along with the key drivers influencing the market
| Year | Growth Rate | Major Drivers |
| 2021 | 5.6% | Qatar National Vision 2030 infrastructure development priorities. |
| 2022 | 5.8% | Adoption of advanced geophysical surveying technologies in projects. |
| 2023 | 5.4% | Increased demand from Doha Metro construction activities. |
| 2024 | 5.2% | Government regulations enhancing underground construction safety measures. |
| 2025 | 5.7% | Growth in real estate development around Lusail City. |
| 2026 | 5.4% | Enhanced urban planning initiatives focusing on utility mapping. |
| 2027 | 5.4% | Surge in public-private partnerships for urban infrastructure projects. |
| 2028 | 5.7% | Rising foreign direct investment in Qatar's construction sector. |
| 2029 | 5.8% | Growing emphasis on sustainable urban infrastructure solutions. |
| 2030 | 5.4% | Legislation promoting transparency in utility mapping services. |
| 2031 | 5.5% | Demand for mapping in preparations for FIFA World Cup. |
| 2032 | 5.7% | Increasing collaborations with technology firms for digital solutions. |
Note: Market size estimations and growth projections presented in this report are based on 6Wresearch's proprietary forecasting methodology, utilizing the latest available industry data, government publications, and primary research inputs.
Qatar Underground Utility Mapping Market Key Takeaways
Below are some of the specific key takeaways from the market, including:
- The market is driven by increasing urbanization and infrastructure development in Qatar.
- Adoption of GIS and remote sensing technologies is becoming commonplace in utility mapping.
- Government policies emphasizing safety and accuracy are shaping market dynamics.
- Strategic collaborations between technology firms and construction companies are on the rise.
- Ongoing investments in smart infrastructure are expected to boost mapping solution demand.
Evaluation of Restraints in Qatar Underground Utility Mapping Market
The Qatar Underground Utility Mapping Market faces limitations primarily due to the complexity of accurately mapping diverse utility types and depths. The intricate networks beneath the surface require advanced technologies, yet the implementation of these can be hampered by technical constraints and a lack of standardized procedures. Additionally, coordinating efforts among various stakeholders—including utility providers, construction firms, and government agencies—adds layers of complexity to the mapping process. As Qatar pursues its ambitious infrastructure goals, addressing these challenges is critical to achieving effective utility management.
Qatar Underground Utility Mapping Market Trends
A shift towards smart city initiatives is driving the adoption of innovative mapping technologies. The integration of Geographic Information Systems (GIS) with real-time data analytics enhances the accuracy of underground utility mapping. on top of that, the increasing focus on sustainability is encouraging the use of eco-friendly methods in the mapping process. Another significant trend is the collaboration between private and public sectors to develop regulatory frameworks that enforce stringent utility mapping standards, thereby improving overall safety and efficiency.
Qatar Underground Utility Mapping Market Opportunities
Opportunities in this market are expanding as Qatar continues to invest heavily in infrastructure. The ongoing development of smart cities presents fertile ground for advanced utility mapping solutions. Additionally, the push for sustainable urban planning offers avenues for companies that can provide innovative, eco-conscious mapping technologies. The demand for training and skilled labor in underground utility mapping is also on the rise, presenting an opportunity for educational institutions and training organizations.
Government Initiatives in the Qatar Underground Utility Mapping Market
Government policies are instrumental in shaping the Qatar Underground Utility Mapping Market. With a strong emphasis on public safety and efficient infrastructure management, regulatory frameworks are being established to mandate accurate utility mapping practices. This focus is vital as Qatar embarks on numerous infrastructure projects that require meticulous planning and execution.
- A national digital infrastructure upgrade programme was launched in 2023, emphasizing accurate utility mapping integration.
- Currently, a pilot initiative focusing on the use of advanced mapping technologies is underway in Doha, enhancing data accuracy.
- A regulatory framework expected to be introduced by 2025 will enforce stricter utility mapping standards for construction projects.
- Upcoming public-private partnerships are being planned to develop a comprehensive underground utility database by 2026.
Future Insights of the Qatar Underground Utility Mapping Market
From 2026 to 2032, the Qatar Underground Utility Mapping Market is expected to evolve significantly. Technological advancements will play a crucial role, particularly as the integration of AI and machine learning into mapping practices becomes more prevalent. The emphasis on safety and efficiency will drive further investments in training and technology. As government initiatives promote smarter urban planning, utility mapping will remain a key component of Qatar’s infrastructure development strategy.
Qatar Underground Utility Mapping Market Latest Developments
Recent activities in the Qatar Underground Utility Mapping Market indicate a strong commitment to enhancing the accuracy and reliability of utility data. In the past year, various initiatives have emerged, aimed at integrating advanced technologies into the mapping process.
- A major technology vendor announced the rollout of a new GIS-based utility mapping solution in Q2 2025, designed to improve data accuracy.
- In early 2025, a collaboration between a leading regional operator and a construction firm was established to implement ground-penetrating radar for utility detection.
- Ongoing trials of a real-time mapping system began in late 2025, aimed at facilitating better decision-making during construction projects.
- Plans for a comprehensive underground utility mapping training programme were unveiled in Q3 2025, focusing on skills development for professionals in the field.
Qatar Underground Utility Mapping Market - Key Attractiveness of the Report
- 10 Years of Market Numbers
- Historical Data Starting from 2022 to 2025
- Base Year: 2025
- Forecast Data until 2032
- Key Performance Indicators Impacting the Market
- Major Upcoming Developments and Projects
Key Highlights of the Report:
- Qatar Underground Utility Mapping Market Outlook
- Market Size of Qatar Underground Utility Mapping Market, 2025
- Forecast of Qatar Underground Utility Mapping Market, 2032
- Historical Data and Forecast of Qatar Underground Utility Mapping Revenues & Volume for the Period 2022-2032F
- Qatar Underground Utility Mapping Market Trend Evolution
- Qatar Underground Utility Mapping Market Drivers and Challenges
- Qatar Underground Utility Mapping Price Trends
- Qatar Underground Utility Mapping Porter's Five Forces
- Qatar Underground Utility Mapping Industry Life Cycle
- Historical Data and Forecast of Qatar Underground Utility Mapping Market Revenues & Volume By Component for the Period 2022-2032F
- Historical Data and Forecast of Qatar Underground Utility Mapping Market Revenues & Volume By Technological Solutions for the Period 2022-2032F
- Historical Data and Forecast of Qatar Underground Utility Mapping Market Revenues & Volume By Services for the Period 2022-2032F
- Historical Data and Forecast of Qatar Underground Utility Mapping Market Revenues & Volume By Vertical for the Period 2022-2032F
- Historical Data and Forecast of Qatar Underground Utility Mapping Market Revenues & Volume By Oil & Gas for the Period 2022-2032F
- Historical Data and Forecast of Qatar Underground Utility Mapping Market Revenues & Volume By Electricity for the Period 2022-2032F
- Historical Data and Forecast of Qatar Underground Utility Mapping Market Revenues & Volume By Government & Public Safety for the Period 2022-2032F
- Historical Data and Forecast of Qatar Underground Utility Mapping Market Revenues & Volume By Construction for the Period 2022-2032F
- Historical Data and Forecast of Qatar Underground Utility Mapping Market Revenues & Volume By Telecommunication for the Period 2022-2032F
- Historical Data and Forecast of Qatar Underground Utility Mapping Market Revenues & Volume By Others for the Period 2022-2032F
- Qatar Underground Utility Mapping Import Export Trade Statistics
- Market Opportunity Assessment By Component
- Market Opportunity Assessment By Vertical
- Qatar Underground Utility Mapping Top Companies Market Share
- Qatar Underground Utility Mapping Competitive Benchmarking By Technical and Operational Parameters
- Qatar Underground Utility Mapping Company Profiles
- Qatar Underground Utility Mapping Key Strategic Recommendations