Romania Cathode ray tube display Market (2026-2032) Outlook | Share, Revenue, Growth, Size, Industry, Companies, Forecast, Analysis, Trends & Value
Market Forecast By Type (Random Scan Display, Raster Scan Display), By Screen Type (Curved Screen, Flat Screen), By Application (Television Screen, Desktop Computer Monitor, Wireless Phone, Portable IT Devices, Others), By Industry Vertical (Consumer Electronics, Automotive, Industrial, Healthcare, Others) And Competitive Landscape
| Product Code: ETC099217 | Publication Date: Jun 2021 | Updated Date: Apr 2026 | Product Type: Report | |
| Publisher: 6Wresearch | Author: Ravi Bhandari | No. of Pages: 70 | No. of Figures: 35 | No. of Tables: 5 |
Romania Cathode Ray Tube Display Market Size (2020-2030)
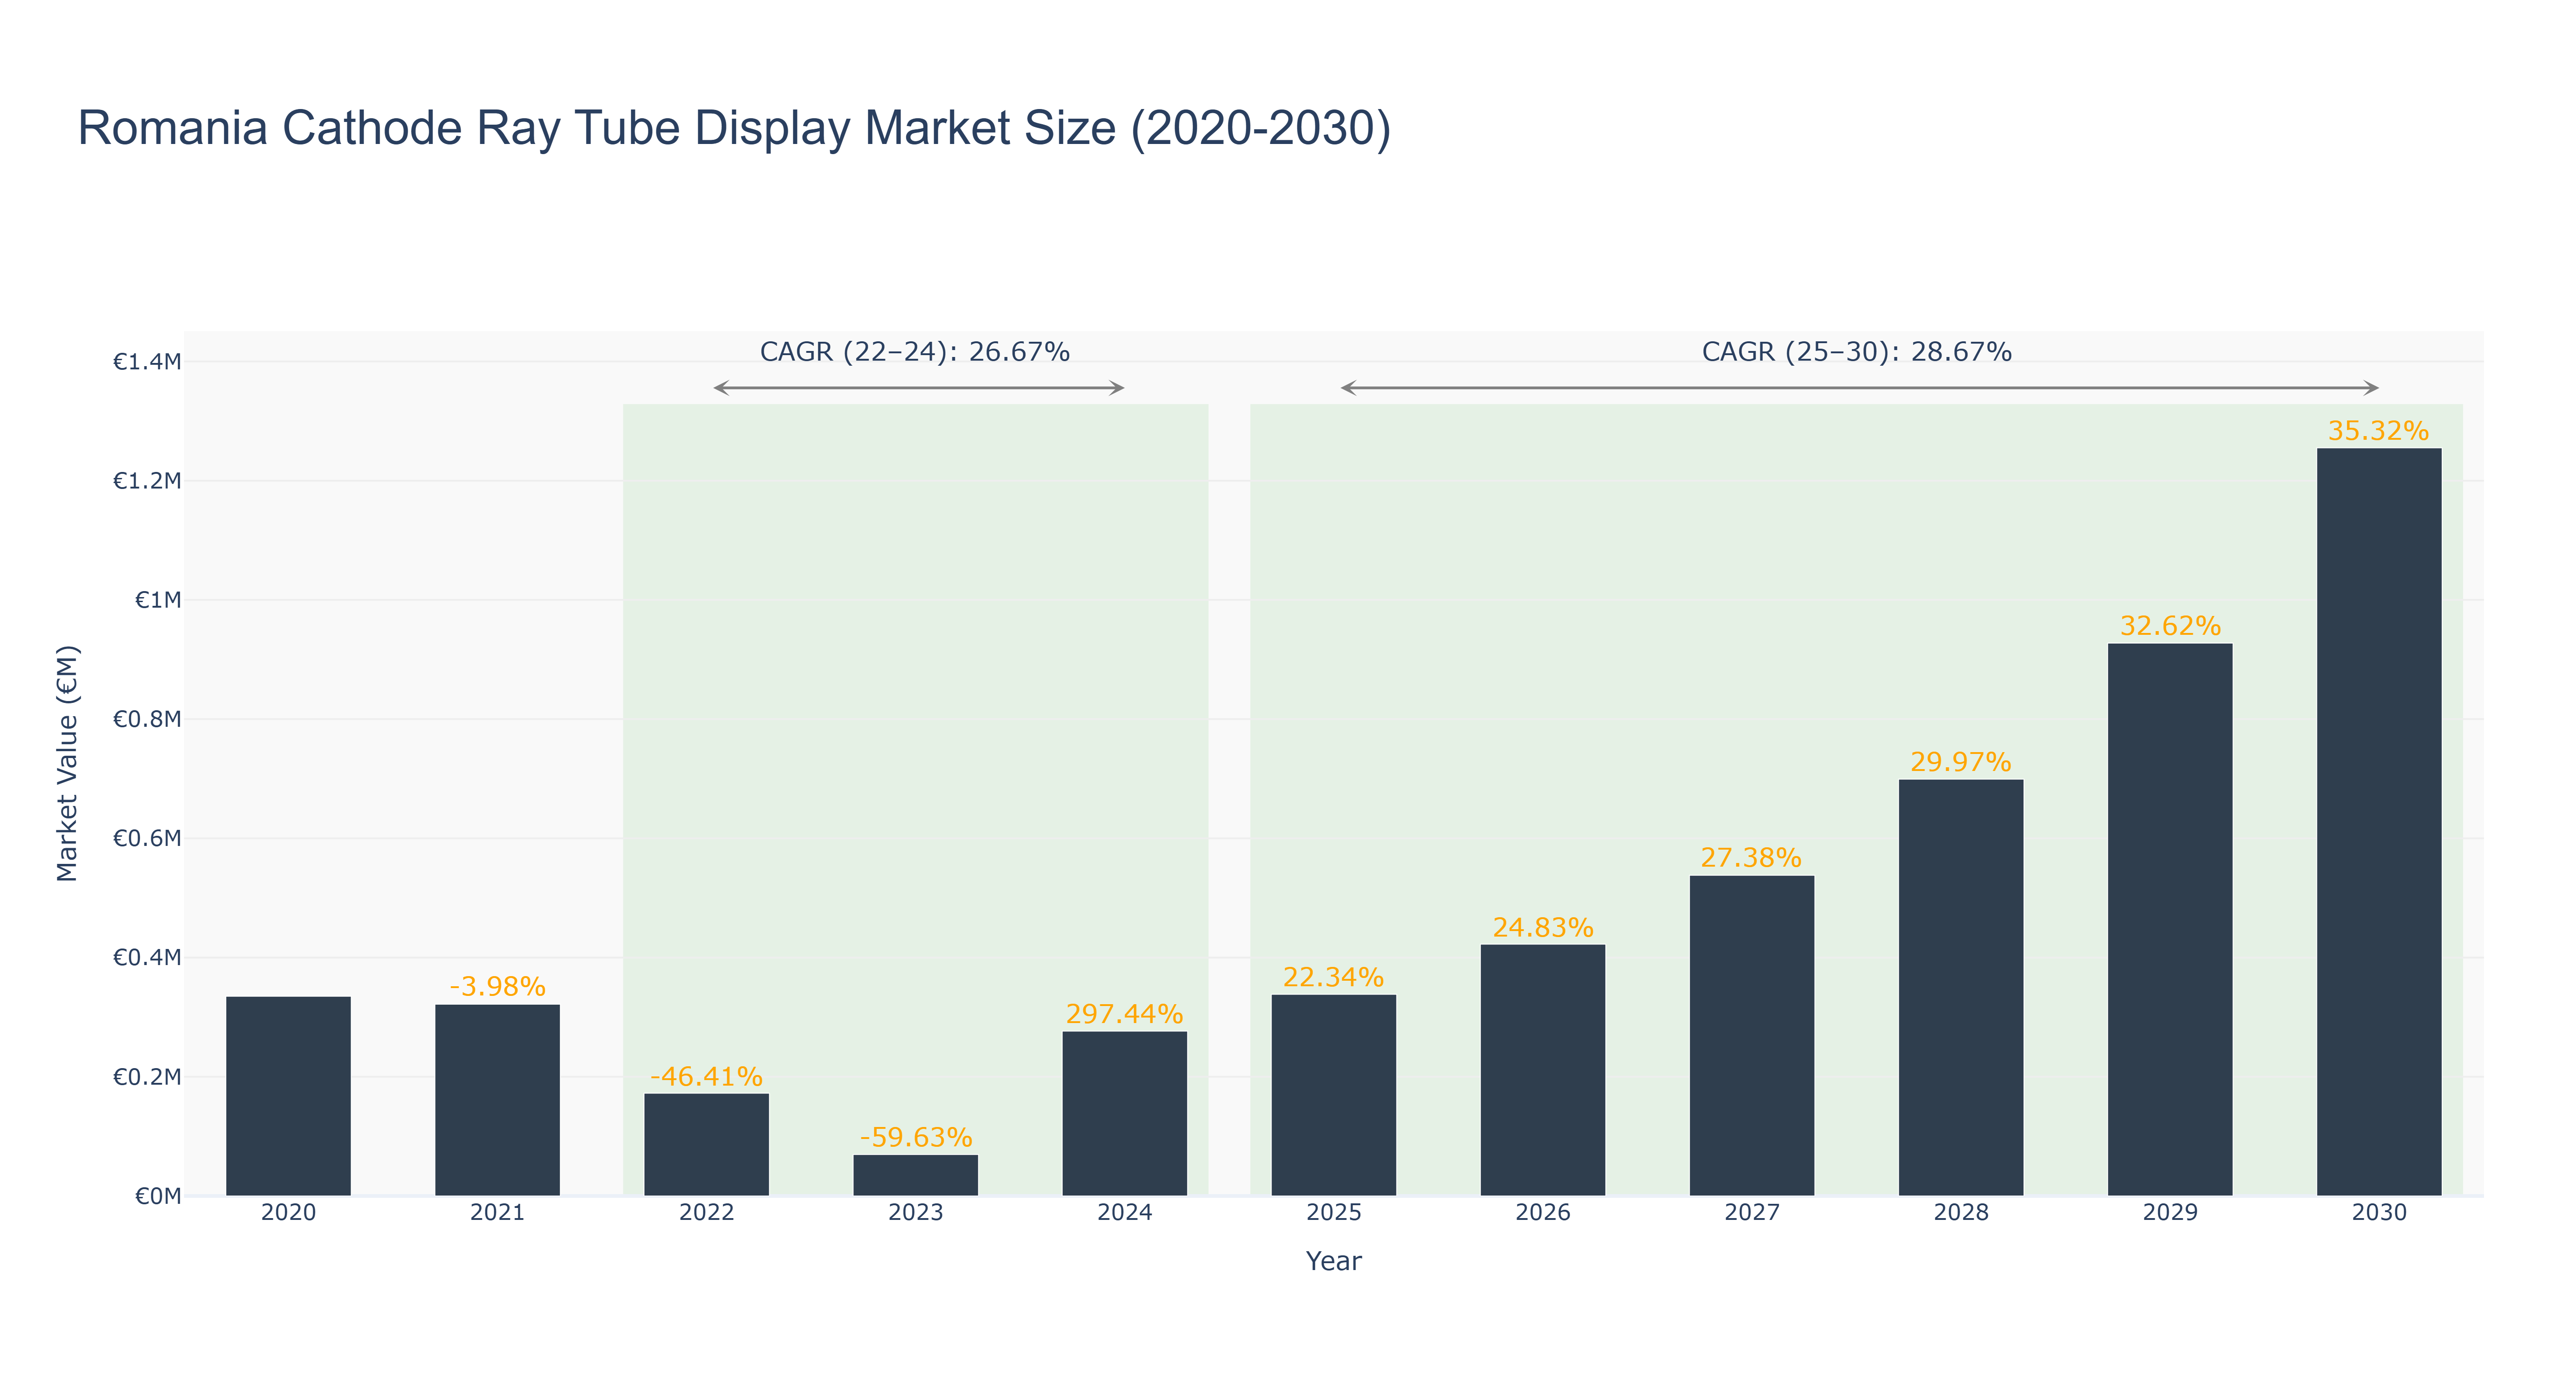
Romania's Cathode Ray Tube Display Market experienced a peak market size of €1.26 million in 2030, with a steady growth trajectory. The actual market size declined from €0.34 million in 2020 to €0.07 million in 2023, before rebounding significantly to €0.70 million in 2028. The forecasted market size is expected to continue growing, reaching €1.26 million by 2030. The CAGR for the period 2022-24 was 26.67%, while the CAGR for 2025-30 is projected to be 28.67%. The market faced challenges due to technological advancements leading to the decline in demand for cathode ray tube displays, but recent developments in the market, such as the shift towards more energy-efficient and higher-resolution display technologies, are expected to drive future growth in the industry.
Romania Cathode Ray Tube Display Market: Production & Trade Performance (2019-2025)
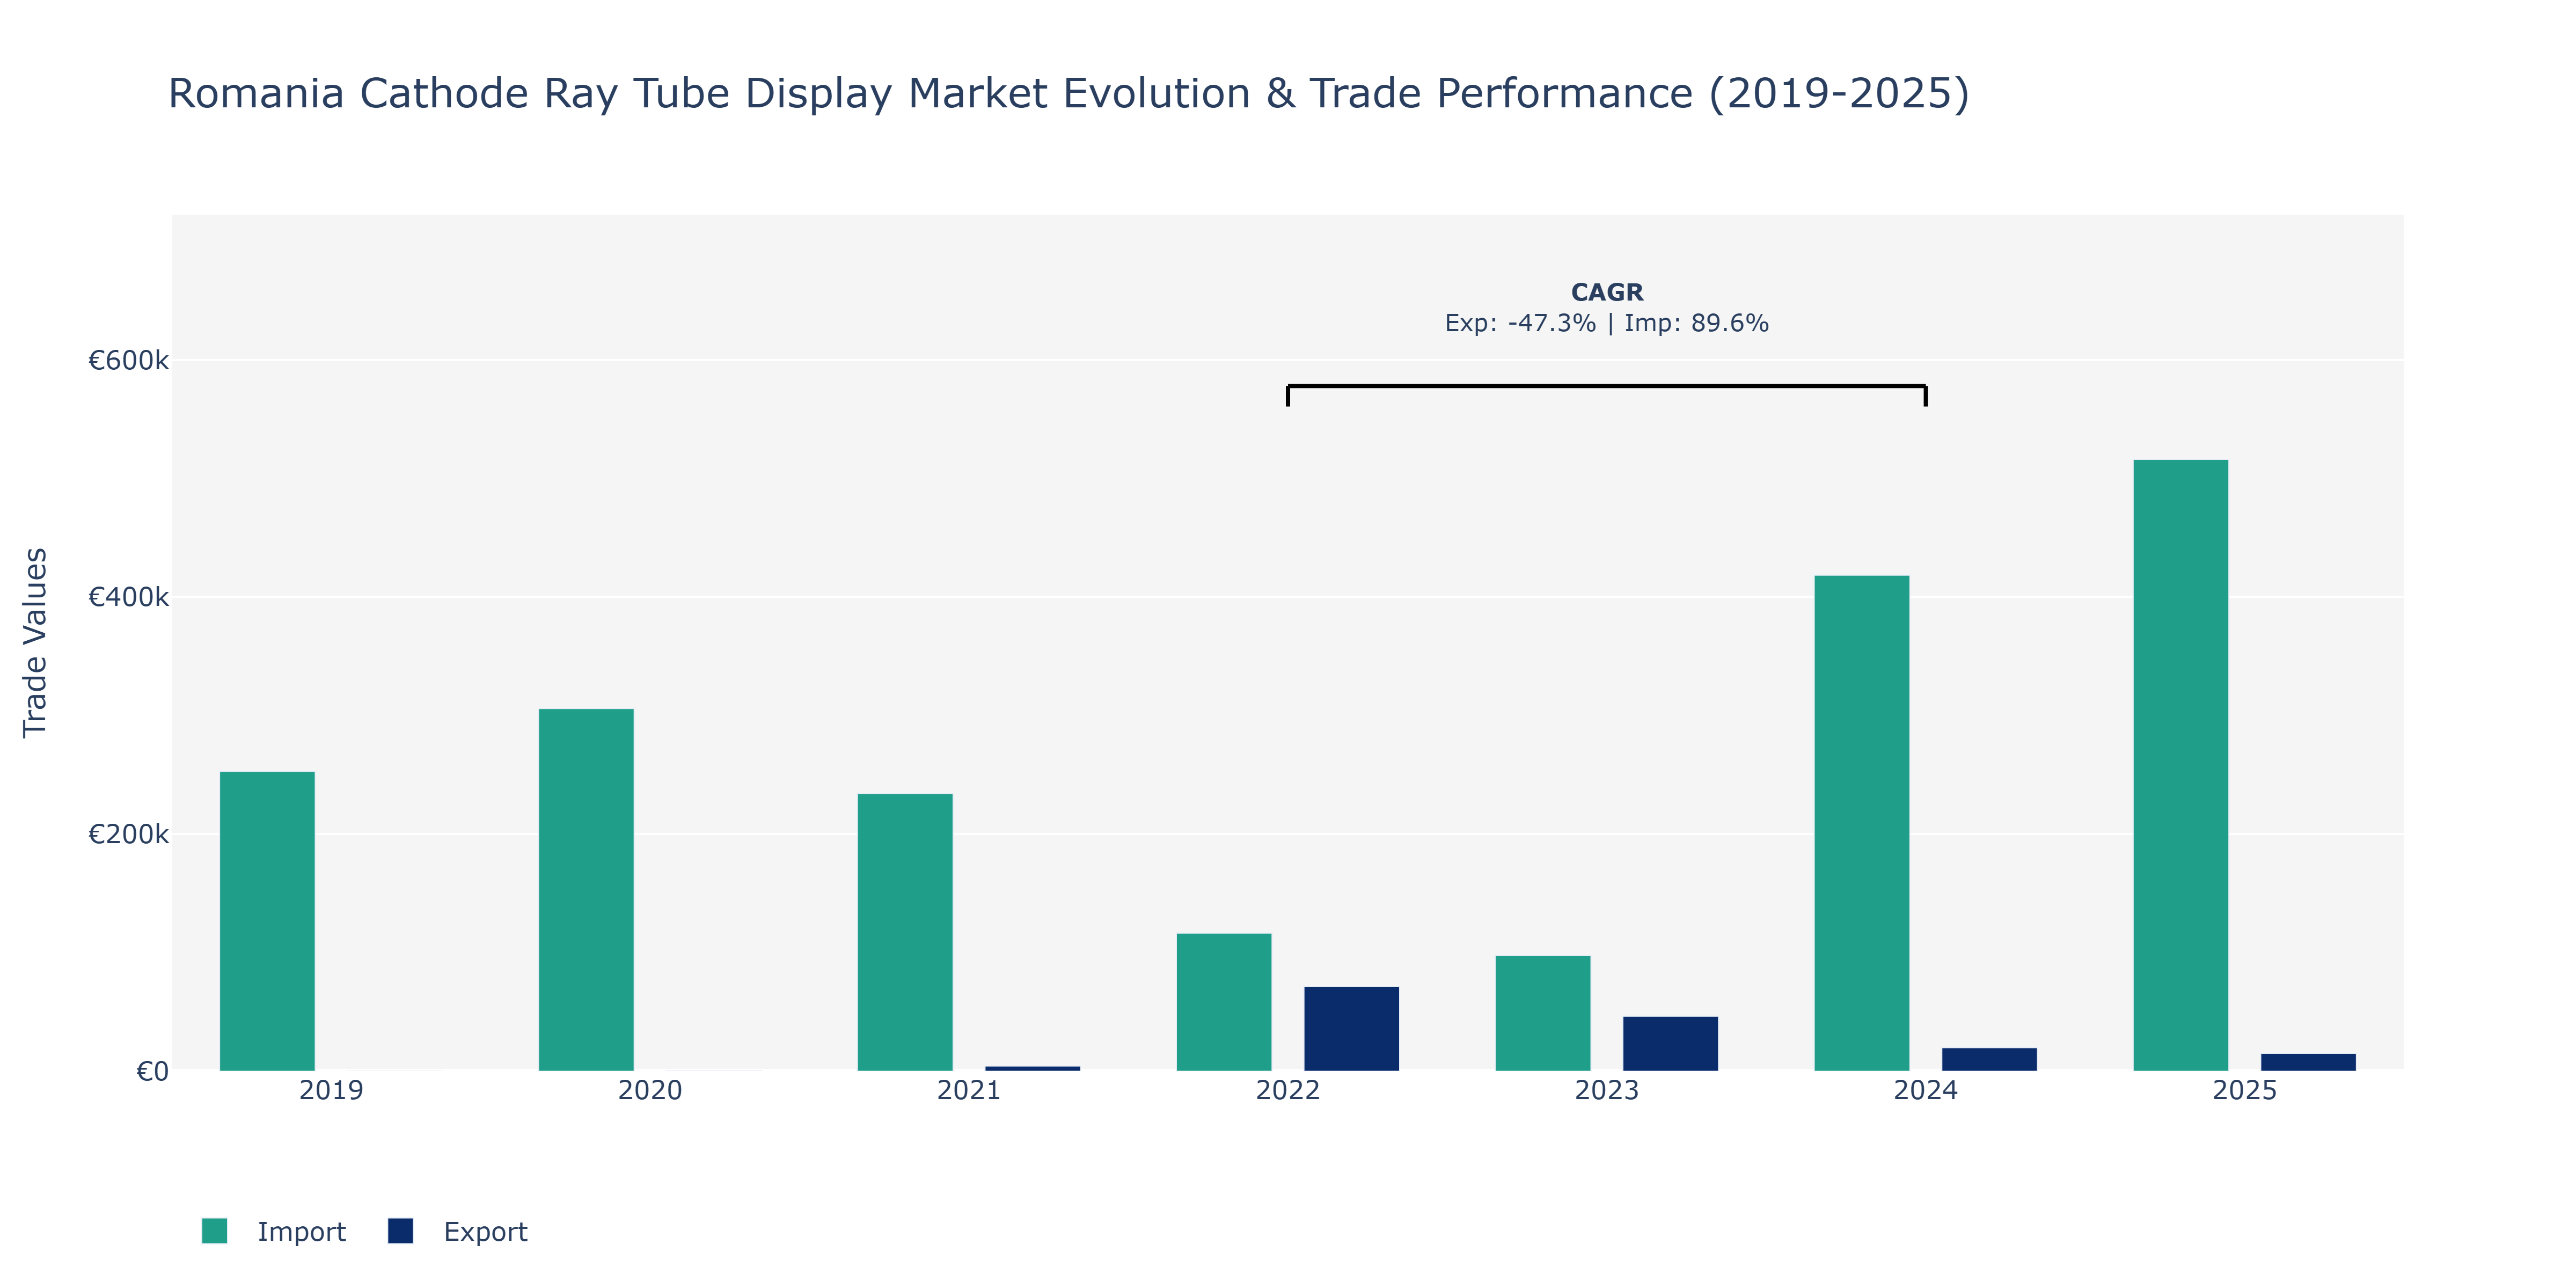
The Romania Cathode Ray Tube Display Market saw notable fluctuations in both exports and imports during the specified period. In 2019, exports were at €170 thousand, increasing slightly to €178 thousand in 2020. A significant surge was observed in 2021, reaching €4.32 thousand, attributed to potential market demand or new trade agreements. However, a drastic decline occurred in 2022, dropping to €71.49 thousand, potentially due to changes in international demand or supply chain disruptions. The following year, exports decreased further to €46.34 thousand before rebounding to €19.83 thousand in 2024. On the imports side, there was a steady rise from €252.89 thousand in 2019 to a peak of €516.16 thousand in 2025, indicating a growing demand for foreign CRT displays. The sharp increase in imports in 2025 could be linked to technological advancements shifting towards other display technologies. This suggests a need for local manufacturers to adapt to changing market preferences and invest in alternative display technologies to stay competitive in the global market.
Key Highlights of the Report:
- Romania Cathode ray tube display Market Outlook
- Market Size of Romania Cathode ray tube display Market, 2025
- Forecast of Romania Cathode ray tube display Market, 2032
- Historical Data and Forecast of Romania Cathode ray tube display Revenues & Volume for the Period 2022-2032F
- Romania Cathode ray tube display Market Trend Evolution
- Romania Cathode ray tube display Market Drivers and Challenges
- Romania Cathode ray tube display Price Trends
- Romania Cathode ray tube display Porter's Five Forces
- Romania Cathode ray tube display Industry Life Cycle
- Historical Data and Forecast of Romania Cathode ray tube display Market Revenues & Volume By Type for the Period 2022-2032F
- Historical Data and Forecast of Romania Cathode ray tube display Market Revenues & Volume By Random Scan Display for the Period 2022-2032F
- Historical Data and Forecast of Romania Cathode ray tube display Market Revenues & Volume By Raster Scan Display for the Period 2022-2032F
- Historical Data and Forecast of Romania Cathode ray tube display Market Revenues & Volume By Screen Type for the Period 2022-2032F
- Historical Data and Forecast of Romania Cathode ray tube display Market Revenues & Volume By Curved Screen for the Period 2022-2032F
- Historical Data and Forecast of Romania Cathode ray tube display Market Revenues & Volume By Flat Screen for the Period 2022-2032F
- Historical Data and Forecast of Romania Cathode ray tube display Market Revenues & Volume By Application for the Period 2022-2032F
- Historical Data and Forecast of Romania Cathode ray tube display Market Revenues & Volume By Television Screen for the Period 2022-2032F
- Historical Data and Forecast of Romania Cathode ray tube display Market Revenues & Volume By Desktop Computer Monitor for the Period 2022-2032F
- Historical Data and Forecast of Romania Cathode ray tube display Market Revenues & Volume By Wireless Phone for the Period 2022-2032F
- Historical Data and Forecast of Romania Cathode ray tube display Market Revenues & Volume By Portable IT Devices for the Period 2022-2032F
- Historical Data and Forecast of Romania Cathode ray tube display Market Revenues & Volume By Others for the Period 2022-2032F
- Historical Data and Forecast of Romania Cathode ray tube display Market Revenues & Volume By Industry Vertical for the Period 2022-2032F
- Historical Data and Forecast of Romania Cathode ray tube display Market Revenues & Volume By Consumer Electronics for the Period 2022-2032F
- Historical Data and Forecast of Romania Cathode ray tube display Market Revenues & Volume By Automotive for the Period 2022-2032F
- Historical Data and Forecast of Romania Cathode ray tube display Market Revenues & Volume By Industrial for the Period 2022-2032F
- Historical Data and Forecast of Romania Cathode ray tube display Market Revenues & Volume By Healthcare for the Period 2022-2032F
- Historical Data and Forecast of Romania Cathode ray tube display Market Revenues & Volume By Others for the Period 2022-2032F
- Romania Cathode ray tube display Import Export Trade Statistics
- Market Opportunity Assessment By Type
- Market Opportunity Assessment By Screen Type
- Market Opportunity Assessment By Application
- Market Opportunity Assessment By Industry Vertical
- Romania Cathode ray tube display Top Companies Market Share
- Romania Cathode ray tube display Competitive Benchmarking By Technical and Operational Parameters
- Romania Cathode ray tube display Company Profiles
- Romania Cathode ray tube display Key Strategic Recommendations
Frequently Asked Questions About the Market Study (FAQs):
6Wresearch actively monitors the Romania Cathode ray tube display Market and publishes its comprehensive annual report, highlighting emerging trends, growth drivers, revenue analysis, and forecast outlook. Our insights help businesses to make data-backed strategic decisions with ongoing market dynamics. Our analysts track relevent industries related to the Romania Cathode ray tube display Market, allowing our clients with actionable intelligence and reliable forecasts tailored to emerging regional needs.
Yes, we provide customisation as per your requirements. To learn more, feel free to contact us on sales@6wresearch.com
1 Executive Summary |
2 Introduction |
2.1 Key Highlights of the Report |
2.2 Report Description |
2.3 Market Scope & Segmentation |
2.4 Research Methodology |
2.5 Assumptions |
3 Romania Cathode ray tube display Market Overview |
3.1 Romania Country Macro Economic Indicators |
3.2 Romania Cathode ray tube display Market Revenues & Volume, 2022 & 2032F |
3.3 Romania Cathode ray tube display Market - Industry Life Cycle |
3.4 Romania Cathode ray tube display Market - Porter's Five Forces |
3.5 Romania Cathode ray tube display Market Revenues & Volume Share, By Type, 2022 & 2032F |
3.6 Romania Cathode ray tube display Market Revenues & Volume Share, By Screen Type, 2022 & 2032F |
3.7 Romania Cathode ray tube display Market Revenues & Volume Share, By Form, 2022 & 2032F |
3.8 Romania Cathode ray tube display Market Revenues & Volume Share, By Industry Vertical, 2022 & 2032F |
4 Romania Cathode ray tube display Market Dynamics |
4.1 Impact Analysis |
4.2 Market Drivers |
4.3 Market Restraints |
5 Romania Cathode ray tube display Market Trends |
6 Romania Cathode ray tube display Market, By Types |
6.1 Romania Cathode ray tube display Market, By Type |
6.1.1 Overview and Analysis |
6.1.2 Romania Cathode ray tube display Market Revenues & Volume, By Type, 2022 - 2032F |
6.1.3 Romania Cathode ray tube display Market Revenues & Volume, By Random Scan Display, 2022 - 2032F |
6.1.4 Romania Cathode ray tube display Market Revenues & Volume, By Raster Scan Display, 2022 - 2032F |
6.2 Romania Cathode ray tube display Market, By Screen Type |
6.2.1 Overview and Analysis |
6.2.2 Romania Cathode ray tube display Market Revenues & Volume, By Curved Screen, 2022 - 2032F |
6.2.3 Romania Cathode ray tube display Market Revenues & Volume, By Flat Screen, 2022 - 2032F |
6.3 Romania Cathode ray tube display Market, By Application |
6.3.1 Overview and Analysis |
6.3.2 Romania Cathode ray tube display Market Revenues & Volume, By Television Screen, 2022 - 2032F |
6.3.3 Romania Cathode ray tube display Market Revenues & Volume, By Desktop Computer Monitor, 2022 - 2032F |
6.3.4 Romania Cathode ray tube display Market Revenues & Volume, By Wireless Phone, 2022 - 2032F |
6.3.5 Romania Cathode ray tube display Market Revenues & Volume, By Portable IT Devices, 2022 - 2032F |
6.3.6 Romania Cathode ray tube display Market Revenues & Volume, By Others, 2022 - 2032F |
6.4 Romania Cathode ray tube display Market, By Industry Vertical |
6.4.1 Overview and Analysis |
6.4.2 Romania Cathode ray tube display Market Revenues & Volume, By Consumer Electronics, 2022 - 2032F |
6.4.3 Romania Cathode ray tube display Market Revenues & Volume, By Automotive, 2022 - 2032F |
6.4.4 Romania Cathode ray tube display Market Revenues & Volume, By Industrial, 2022 - 2032F |
6.4.5 Romania Cathode ray tube display Market Revenues & Volume, By Healthcare, 2022 - 2032F |
6.4.6 Romania Cathode ray tube display Market Revenues & Volume, By Others, 2022 - 2032F |
7 Romania Cathode ray tube display Market Import-Export Trade Statistics |
7.1 Romania Cathode ray tube display Market Export to Major Countries |
7.2 Romania Cathode ray tube display Market Imports from Major Countries |
8 Romania Cathode ray tube display Market Key Performance Indicators |
9 Romania Cathode ray tube display Market - Opportunity Assessment |
9.1 Romania Cathode ray tube display Market Opportunity Assessment, By Type, 2022 & 2032F |
9.2 Romania Cathode ray tube display Market Opportunity Assessment, By Screen Type, 2022 & 2032F |
9.3 Romania Cathode ray tube display Market Opportunity Assessment, By Application, 2022 & 2032F |
9.4 Romania Cathode ray tube display Market Opportunity Assessment, By Industry Vertical, 2022 & 2032F |
10 Romania Cathode ray tube display Market - Competitive Landscape |
10.1 Romania Cathode ray tube display Market Revenue Share, By Companies, 2025 |
10.2 Romania Cathode ray tube display Market Competitive Benchmarking, By Operating and Technical Parameters |
11 Company Profiles |
12 Recommendations |
13 Disclaimer |
Global Go To Market Strategy - 2030
Export potential enables firms to identify high-growth global markets with greater confidence by combining advanced trade intelligence with a structured quantitative methodology. The framework analyzes emerging demand trends and country-level import patterns while integrating macroeconomic and trade datasets such as GDP and population forecasts, bilateral import–export flows, tariff structures, elasticity differentials between developed and developing economies, geographic distance, and import demand projections. Using weighted trade values from 2020–2024 as the base period to project country-to-country export potential for 2030, these inputs are operationalized through calculated drivers such as gravity model parameters, tariff impact factors, and projected GDP per-capita growth. Through an analysis of hidden potentials, demand hotspots, and market conditions that are most favorable to success, this method enables firms to focus on target countries, maximize returns, and global expansion with data, backed by accuracy.
By factoring in the projected importer demand gap that is currently unmet and could be potential opportunity, it identifies the potential for the Exporter (Country) among 190 countries, against the general trade analysis, which identifies the biggest importer or exporter.
To discover high-growth global markets and optimize your business strategy:
Click Here
Pricing
- Single User License$ 1,995
- Department License$ 2,400
- Site License$ 3,120
- Global License$ 3,795

Leadership Perspectives from Industry Events
Search
Thought Leadership and Analyst Meet


Our Clients
6WResearch In News
- India Export Attractiveness Tracker 2026
- India Air Conditioner Market Set for Strong Rebound in 2026 After Weather-Led Correction and GST-Driven Recovery: 6Wresearch
- ADAS in India: How Automatic Emergency Braking, Blind Spot Detection & Driver Monitoring are Transforming Road Safety
- Doha a strategic location for EV manufacturing hub: IPA Qatar
- Demand for luxury TVs surging in the GCC, says Samsung
- Empowering Growth: The Thriving Journey of Bangladesh’s Cable Industry
Latest Reports
- Nicaragua RPG Gaming Market (2026-2032)
- New Zealand RPG Gaming Market (2026-2032)
- Netherlands RPG Gaming Market (2026-2032)
- Nauru RPG Gaming Market (2026-2032)
- Namibia RPG Gaming Market (2026-2032)
- Mozambique RPG Gaming Market (2026-2032)
- Montenegro RPG Gaming Market (2026-2032)
- Mongolia RPG Gaming Market (2026-2032)
- Monaco RPG Gaming Market (2026-2032)
- Micronesia RPG Gaming Market (2026-2032)
Industry Events and Analyst Meet

EV India Expo 2026

HIMTEX 2026

India Refining Summit 2026

India EV Show 2026

EV tech India Expo 2026
Whitepaper
- Middle East & Africa Commercial Security Market Click here to view more.
- Middle East & Africa Fire Safety Systems & Equipment Market Click here to view more.
- GCC Drone Market Click here to view more.
- Middle East Lighting Fixture Market Click here to view more.
- GCC Physical & Perimeter Security Market Click here to view more.