Romania Colorants Market (2026-2032) Outlook | Revenue, Industry, Analysis, Size, Share, Companies, Value, Growth, Forecast & Trends
Market Forecast By Type (Dyes, Pigments, Masterbatches, Color Concentrates), By End Use Industry (Packaging, Building & Construction, Automotive, Textiles, Paper & Printing) And Competitive Landscape
| Product Code: ETC4480699 | Publication Date: Jul 2023 | Updated Date: Mar 2026 | Product Type: Report | |
| Publisher: 6Wresearch | Author: Dhaval Chaurasia | No. of Pages: 85 | No. of Figures: 45 | No. of Tables: 25 |
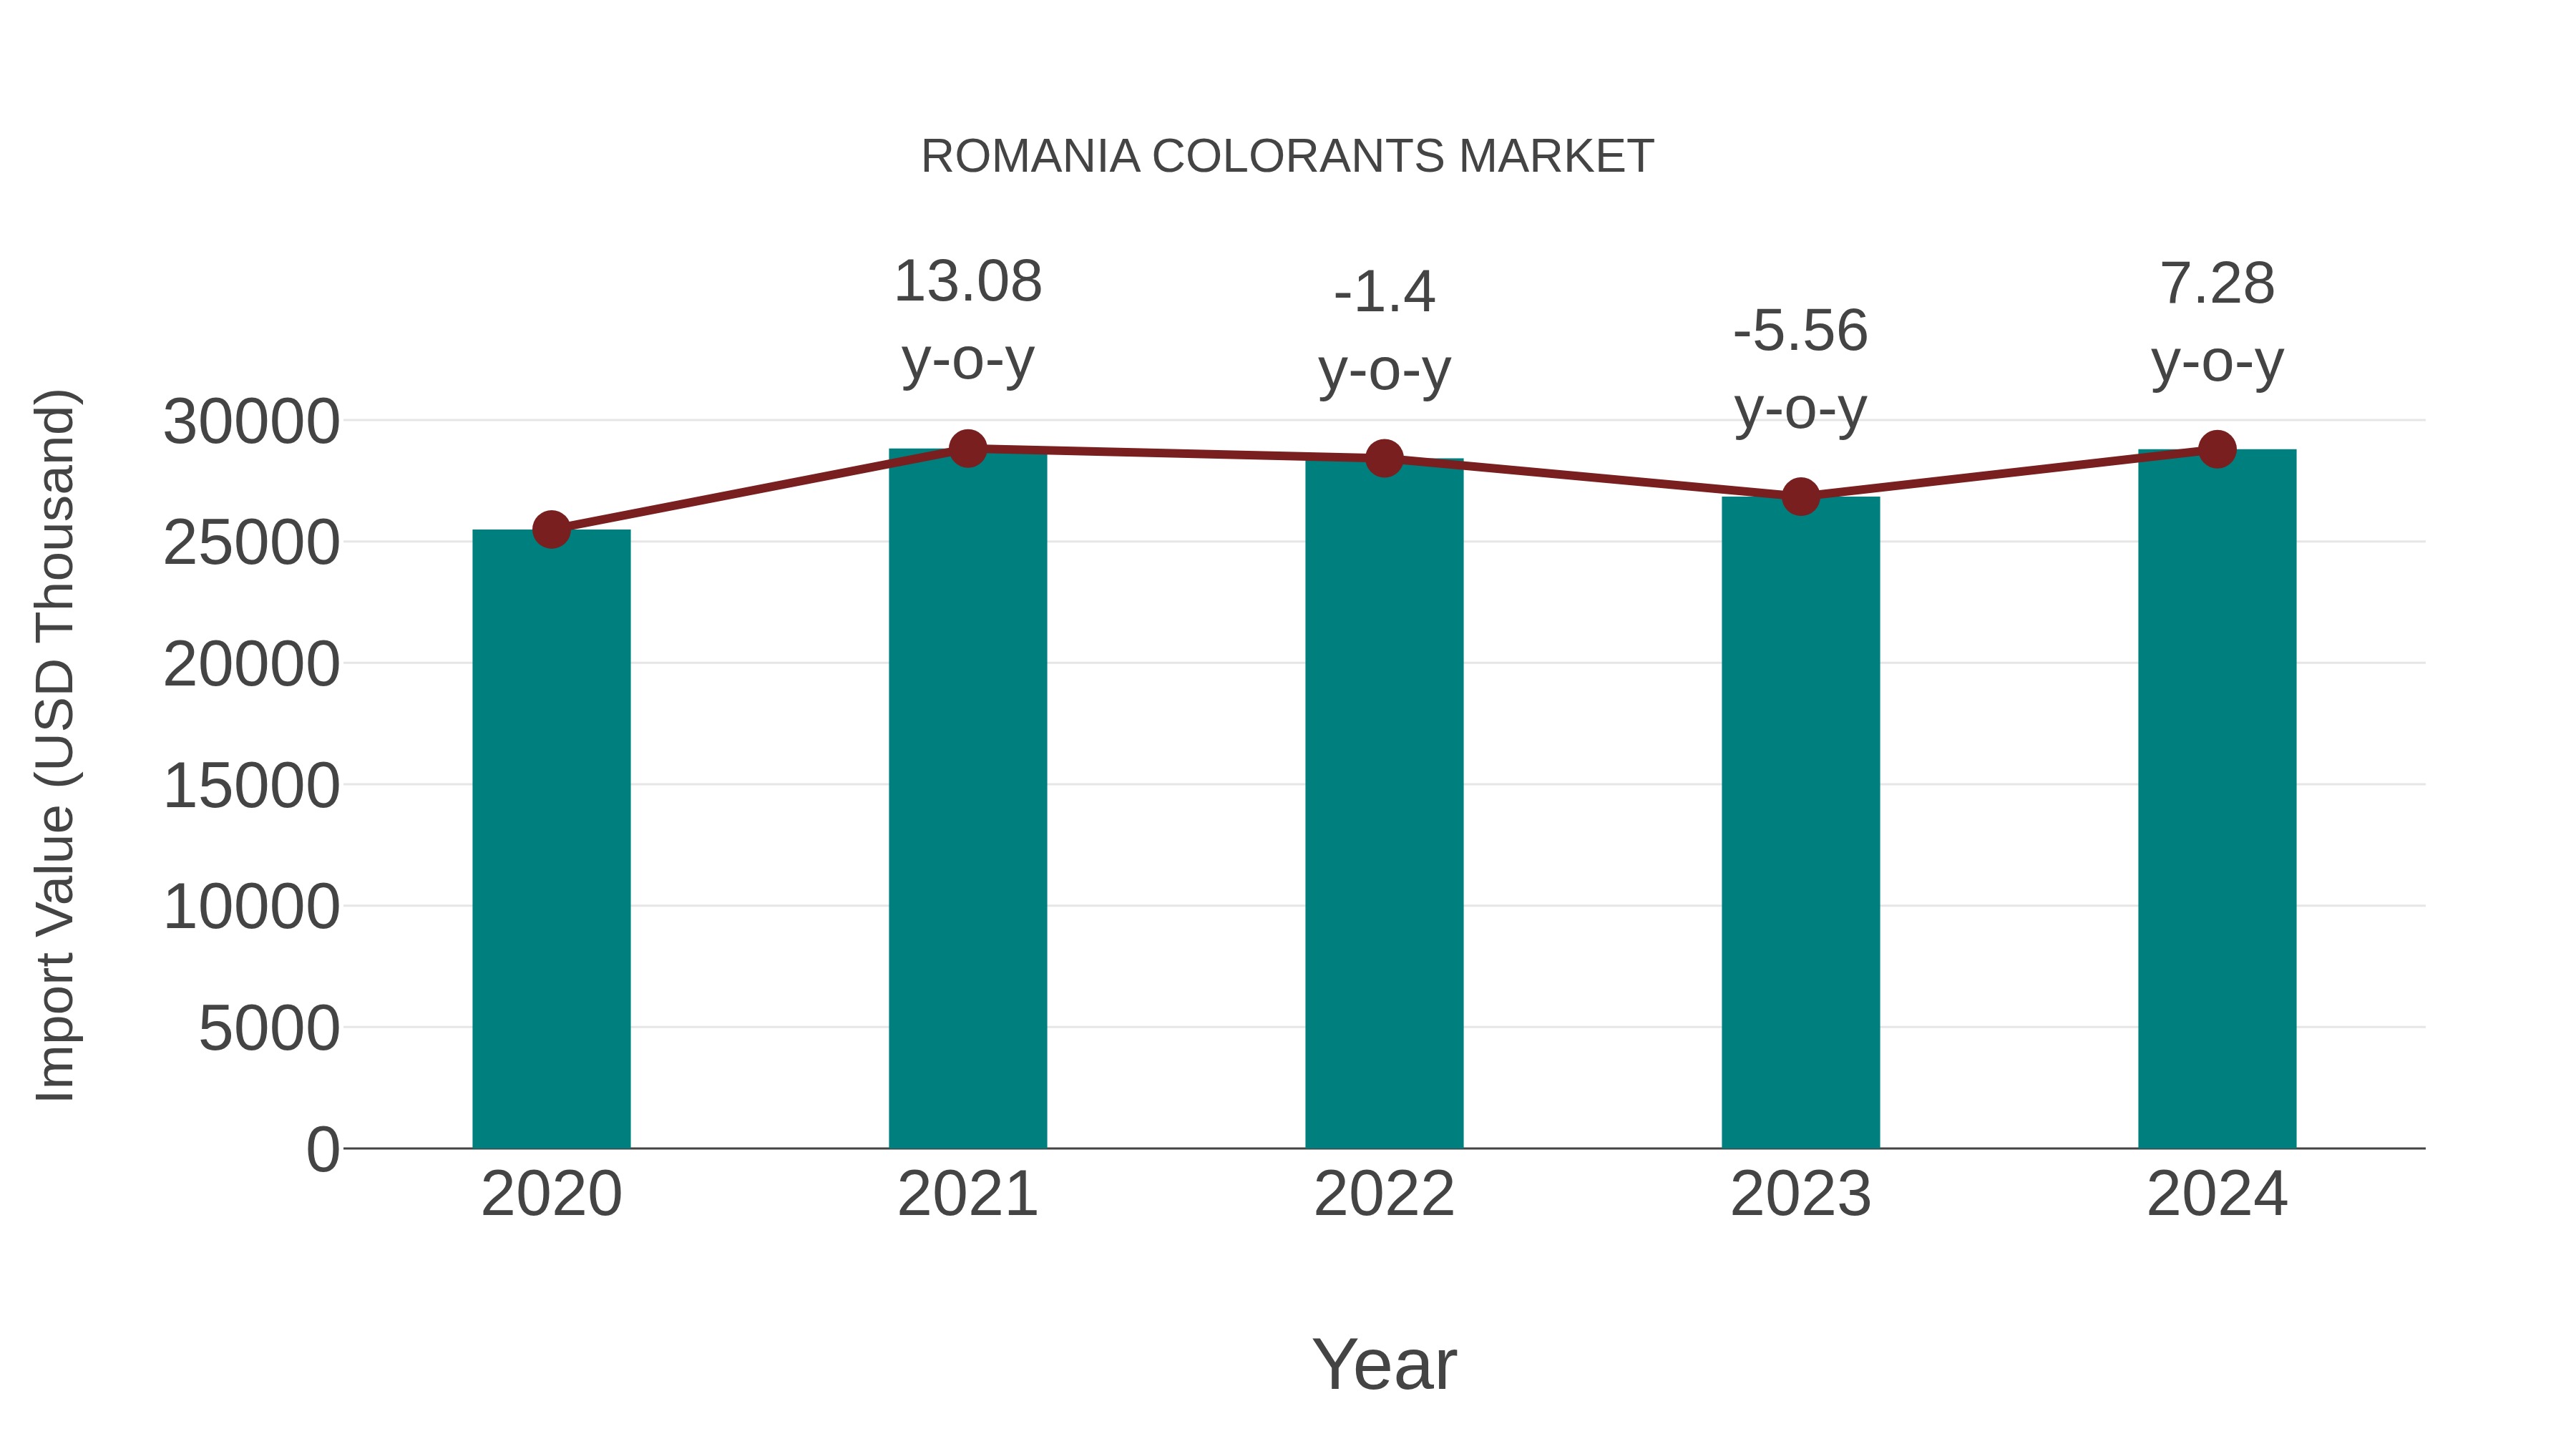
Romania Colorants Market: Import Trend Analysis
In the Romania colorants market, the import trend showed a growth rate of 7.28% from 2023 to 2024, with a compound annual growth rate (CAGR) of 3.09% from 2020 to 2024. This increase in import momentum could be attributed to a shift in demand towards more diverse colorant options or changes in trade policies impacting market dynamics.
Romania Colorants Market Overview
The Romania Colorants Market encompasses a variety of pigments, dyes, and additives used across industries such as textiles, plastics, paints, and coatings. The market growth is driven by the demand for vibrant and durable colors, along with the development of environmentally friendly and sustainable colorants to meet regulatory and consumer preferences.
Drivers of the market
Growth in the Romania Colorants Market is fueled by the increasing use of colorants in various end-user industries such as textiles, plastics, and coatings. The demand for vibrant and long-lasting colors in consumer products is a key driver. Additionally, advancements in dyeing and pigment technologies, along with the rising trend towards natural and organic colorants, are contributing to market expansion.
Challenges of the market
The colorants market in Romania is confronted with several obstacles, such as regulatory compliance and environmental concerns. Manufacturers must adhere to stringent regulations related to the safety and environmental impact of colorants, which can increase production costs and complicate manufacturing processes. Additionally, the market is highly competitive, with continuous pressure to innovate and provide high-quality, sustainable products. Fluctuating raw material prices also pose a significant challenge, impacting cost stability and profit margins.
Government Policy of the market
The colorants market in Romania benefits from governmental policies that support the chemical and manufacturing sectors. Environmental regulations are increasingly shaping the market, with a focus on reducing the environmental impact of colorants. Policies promoting the use of eco-friendly and sustainable colorants are driving innovation and adoption in various industries, including textiles, plastics, and food.
Key Highlights of the Report:
- Romania Colorants Market Outlook
- Market Size of Romania Colorants Market, 2025
- Forecast of Romania Colorants Market, 2032
- Historical Data and Forecast of Romania Colorants Revenues & Volume for the Period 2022-2032F
- Romania Colorants Market Trend Evolution
- Romania Colorants Market Drivers and Challenges
- Romania Colorants Price Trends
- Romania Colorants Porter's Five Forces
- Romania Colorants Industry Life Cycle
- Historical Data and Forecast of Romania Colorants Market Revenues & Volume By Type for the Period 2022-2032F
- Historical Data and Forecast of Romania Colorants Market Revenues & Volume By Dyes for the Period 2022-2032F
- Historical Data and Forecast of Romania Colorants Market Revenues & Volume By Pigments for the Period 2022-2032F
- Historical Data and Forecast of Romania Colorants Market Revenues & Volume By Masterbatches for the Period 2022-2032F
- Historical Data and Forecast of Romania Colorants Market Revenues & Volume By Color Concentrates for the Period 2022-2032F
- Historical Data and Forecast of Romania Colorants Market Revenues & Volume By End Use Industry for the Period 2022-2032F
- Historical Data and Forecast of Romania Colorants Market Revenues & Volume By Packaging for the Period 2022-2032F
- Historical Data and Forecast of Romania Colorants Market Revenues & Volume By Building & Construction for the Period 2022-2032F
- Historical Data and Forecast of Romania Colorants Market Revenues & Volume By Automotive for the Period 2022-2032F
- Historical Data and Forecast of Romania Colorants Market Revenues & Volume By Textiles for the Period 2022-2032F
- Historical Data and Forecast of Romania Colorants Market Revenues & Volume By Paper & Printing for the Period 2022-2032F
- Romania Colorants Import Export Trade Statistics
- Market Opportunity Assessment By Type
- Market Opportunity Assessment By End Use Industry
- Romania Colorants Top Companies Market Share
- Romania Colorants Competitive Benchmarking By Technical and Operational Parameters
- Romania Colorants Company Profiles
- Romania Colorants Key Strategic Recommendations
Romania Colorants Market (2026-2032): FAQs
6Wresearch actively monitors the Romania Colorants Market and publishes its comprehensive annual report, highlighting emerging trends, growth drivers, revenue analysis, and forecast outlook. Our insights help businesses to make data-backed strategic decisions with ongoing market dynamics. Our analysts track relevent industries related to the Romania Colorants Market, allowing our clients with actionable intelligence and reliable forecasts tailored to emerging regional needs.
Yes, we provide customisation as per your requirements. To learn more, feel free to contact us on sales@6wresearch.com
1 Executive Summary |
2 Introduction |
2.1 Key Highlights of the Report |
2.2 Report Description |
2.3 Market Scope & Segmentation |
2.4 Research Methodology |
2.5 Assumptions |
3 Romania Colorants Market Overview |
3.1 Romania Country Macro Economic Indicators |
3.2 Romania Colorants Market Revenues & Volume, 2022 & 2032F |
3.3 Romania Colorants Market - Industry Life Cycle |
3.4 Romania Colorants Market - Porter's Five Forces |
3.5 Romania Colorants Market Revenues & Volume Share, By Type, 2022 & 2032F |
3.6 Romania Colorants Market Revenues & Volume Share, By End Use Industry, 2022 & 2032F |
4 Romania Colorants Market Dynamics |
4.1 Impact Analysis |
4.2 Market Drivers |
4.2.1 Increasing demand for natural and organic colorants in Romania due to rising health and environmental awareness. |
4.2.2 Growth in the food and beverage industry in Romania leading to higher demand for colorants for product differentiation. |
4.2.3 Rising disposable income and changing consumer preferences driving the demand for innovative and visually appealing products. |
4.3 Market Restraints |
4.3.1 Stringent regulations and quality standards in Romania impacting the availability and usage of certain colorants. |
4.3.2 Fluctuating prices of raw materials affecting the production costs of colorants in the market. |
5 Romania Colorants Market Trends |
6 Romania Colorants Market, By Types |
6.1 Romania Colorants Market, By Type |
6.1.1 Overview and Analysis |
6.1.2 Romania Colorants Market Revenues & Volume, By Type, 2022-2032F |
6.1.3 Romania Colorants Market Revenues & Volume, By Dyes, 2022-2032F |
6.1.4 Romania Colorants Market Revenues & Volume, By Pigments, 2022-2032F |
6.1.5 Romania Colorants Market Revenues & Volume, By Masterbatches, 2022-2032F |
6.1.6 Romania Colorants Market Revenues & Volume, By Color Concentrates, 2022-2032F |
6.2 Romania Colorants Market, By End Use Industry |
6.2.1 Overview and Analysis |
6.2.2 Romania Colorants Market Revenues & Volume, By Packaging, 2022-2032F |
6.2.3 Romania Colorants Market Revenues & Volume, By Building & Construction, 2022-2032F |
6.2.4 Romania Colorants Market Revenues & Volume, By Automotive, 2022-2032F |
6.2.5 Romania Colorants Market Revenues & Volume, By Textiles, 2022-2032F |
6.2.6 Romania Colorants Market Revenues & Volume, By Paper & Printing, 2022-2032F |
7 Romania Colorants Market Import-Export Trade Statistics |
7.1 Romania Colorants Market Export to Major Countries |
7.2 Romania Colorants Market Imports from Major Countries |
8 Romania Colorants Market Key Performance Indicators |
8.1 Consumer preference surveys indicating the shift towards natural and organic colorants. |
8.2 Number of new product launches in the food and beverage industry incorporating innovative colorants. |
8.3 Environmental impact assessments highlighting the adoption of sustainable colorant production practices. |
9 Romania Colorants Market - Opportunity Assessment |
9.1 Romania Colorants Market Opportunity Assessment, By Type, 2022 & 2032F |
9.2 Romania Colorants Market Opportunity Assessment, By End Use Industry, 2022 & 2032F |
10 Romania Colorants Market - Competitive Landscape |
10.1 Romania Colorants Market Revenue Share, By Companies, 2025 |
10.2 Romania Colorants Market Competitive Benchmarking, By Operating and Technical Parameters |
11 Company Profiles |
12 Recommendations |
13 Disclaimer |
Global Go To Market Strategy - 2030
Export potential enables firms to identify high-growth global markets with greater confidence by combining advanced trade intelligence with a structured quantitative methodology. The framework analyzes emerging demand trends and country-level import patterns while integrating macroeconomic and trade datasets such as GDP and population forecasts, bilateral import–export flows, tariff structures, elasticity differentials between developed and developing economies, geographic distance, and import demand projections. Using weighted trade values from 2020–2024 as the base period to project country-to-country export potential for 2030, these inputs are operationalized through calculated drivers such as gravity model parameters, tariff impact factors, and projected GDP per-capita growth. Through an analysis of hidden potentials, demand hotspots, and market conditions that are most favorable to success, this method enables firms to focus on target countries, maximize returns, and global expansion with data, backed by accuracy.
By factoring in the projected importer demand gap that is currently unmet and could be potential opportunity, it identifies the potential for the Exporter (Country) among 190 countries, against the general trade analysis, which identifies the biggest importer or exporter.
To discover high-growth global markets and optimize your business strategy:
Click Here
Pricing
- Single User License$ 1,995
- Department License$ 2,400
- Site License$ 3,120
- Global License$ 3,795

Leadership Perspectives from Industry Events
Search
Thought Leadership and Analyst Meet


Our Clients
6WResearch In News
- India Export Attractiveness Tracker 2026
- India Air Conditioner Market Set for Strong Rebound in 2026 After Weather-Led Correction and GST-Driven Recovery: 6Wresearch
- ADAS in India: How Automatic Emergency Braking, Blind Spot Detection & Driver Monitoring are Transforming Road Safety
- Doha a strategic location for EV manufacturing hub: IPA Qatar
- Demand for luxury TVs surging in the GCC, says Samsung
- Empowering Growth: The Thriving Journey of Bangladesh’s Cable Industry
Latest Reports
- Nicaragua RPG Gaming Market (2026-2032)
- New Zealand RPG Gaming Market (2026-2032)
- Netherlands RPG Gaming Market (2026-2032)
- Nauru RPG Gaming Market (2026-2032)
- Namibia RPG Gaming Market (2026-2032)
- Mozambique RPG Gaming Market (2026-2032)
- Montenegro RPG Gaming Market (2026-2032)
- Mongolia RPG Gaming Market (2026-2032)
- Monaco RPG Gaming Market (2026-2032)
- Micronesia RPG Gaming Market (2026-2032)
Industry Events and Analyst Meet

EV India Expo 2026

HIMTEX 2026

India Refining Summit 2026

India EV Show 2026

EV tech India Expo 2026
Whitepaper
- Middle East & Africa Commercial Security Market Click here to view more.
- Middle East & Africa Fire Safety Systems & Equipment Market Click here to view more.
- GCC Drone Market Click here to view more.
- Middle East Lighting Fixture Market Click here to view more.
- GCC Physical & Perimeter Security Market Click here to view more.