Romania Expandable Polystyrene EPS Market (2026-2032) | Companies, Forecast, Share, Trends, Growth, Analysis, Value, Competitive Landscape, Outlook, Industry, Segmentation, Size & Revenue
Market Forecast By Type (White, Grey, Silver), By End User (Building and Construction, Packaging, Other End Users) And Competitive Landscape
| Product Code: ETC8970531 | Publication Date: Sep 2024 | Updated Date: Apr 2026 | Product Type: Market Research Report | |
| Publisher: 6Wresearch | Author: Vasudha | No. of Pages: 75 | No. of Figures: 35 | No. of Tables: 20 |
Romania Expandable Polystyrene Eps Market Size (2020-2030)
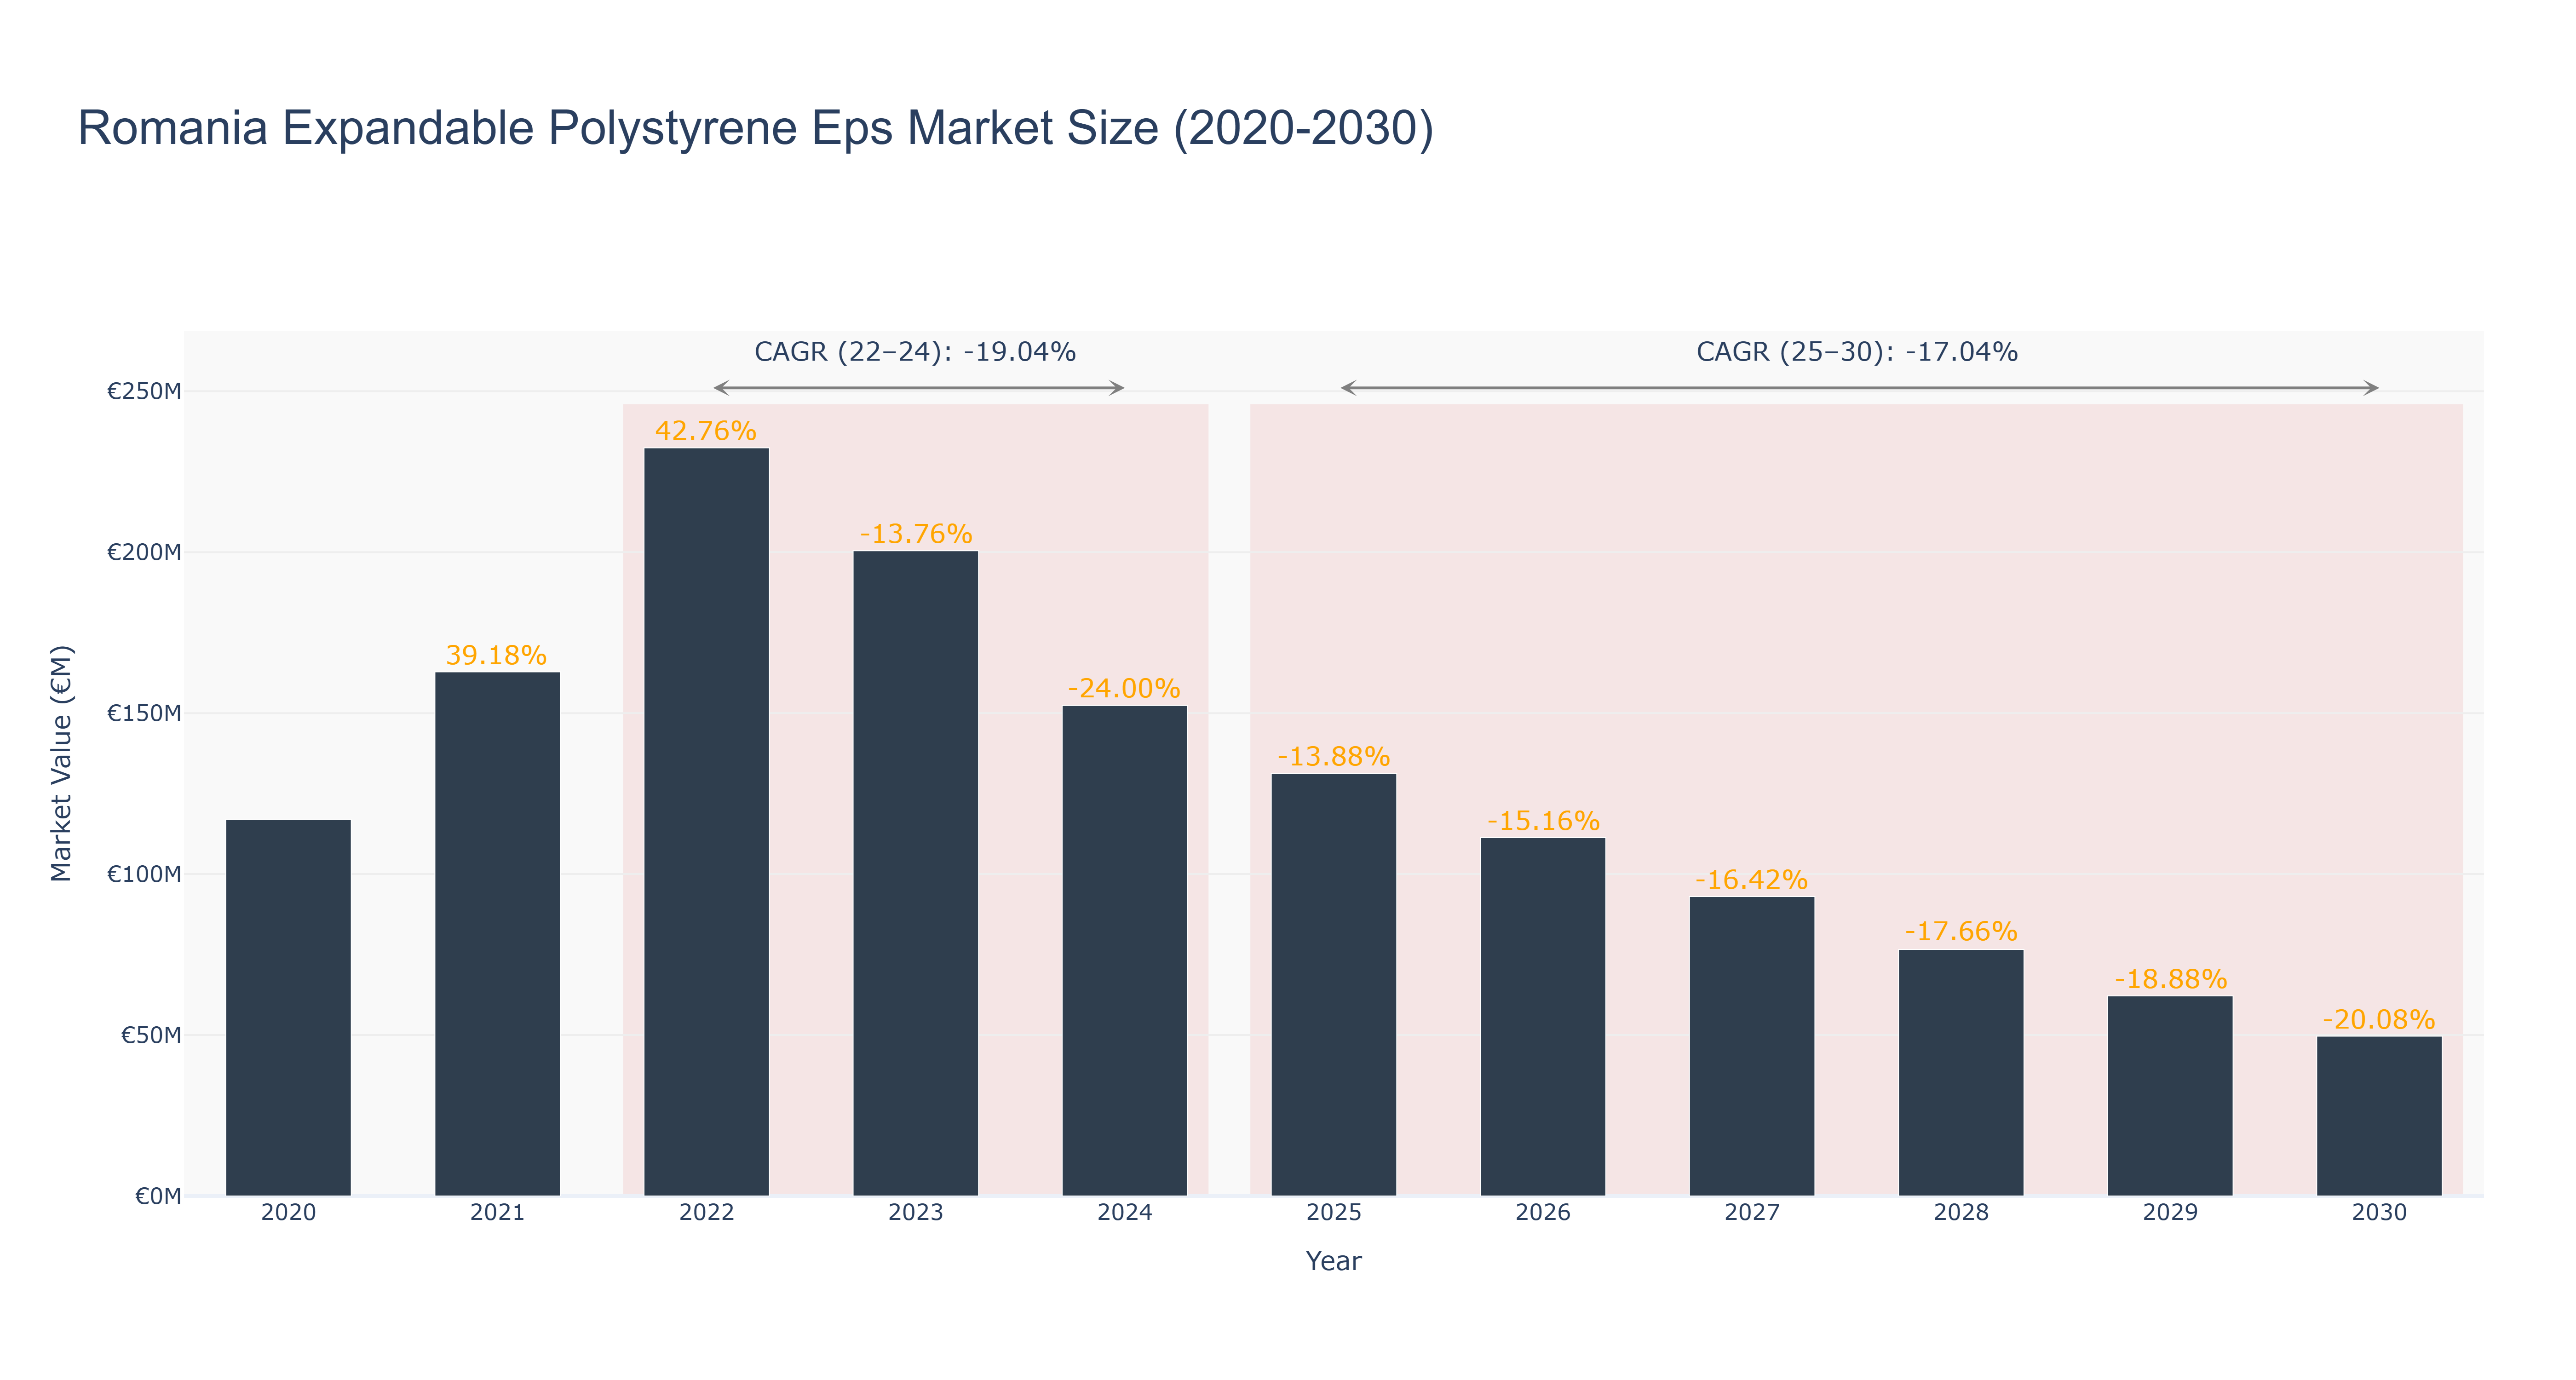
The Romania Expandable Polystyrene EPS Market experienced a peak market size of €232.40 million in 2022. From 2020 to 2024, the market size decreased steadily, reaching €152.33 million in 2024. Forecasted market size from 2025 to 2030 shows a continued decline, with the market expected to reach €49.66 million in 2030. The CAGR for the period 2022-24 was -19.04%, while for 2025-30, it is projected to be -17.04%. The downward trend can be attributed to various factors such as changing consumer preferences, economic conditions affecting construction activities, and environmental concerns driving the shift towards more sustainable materials. Despite the challenging market conditions, upcoming projects in Romania focusing on sustainable construction practices are expected to drive growth in the EPS market in the near future.
Romania Expandable Polystyrene Eps Market: Production & Trade Performance (2019-2025)
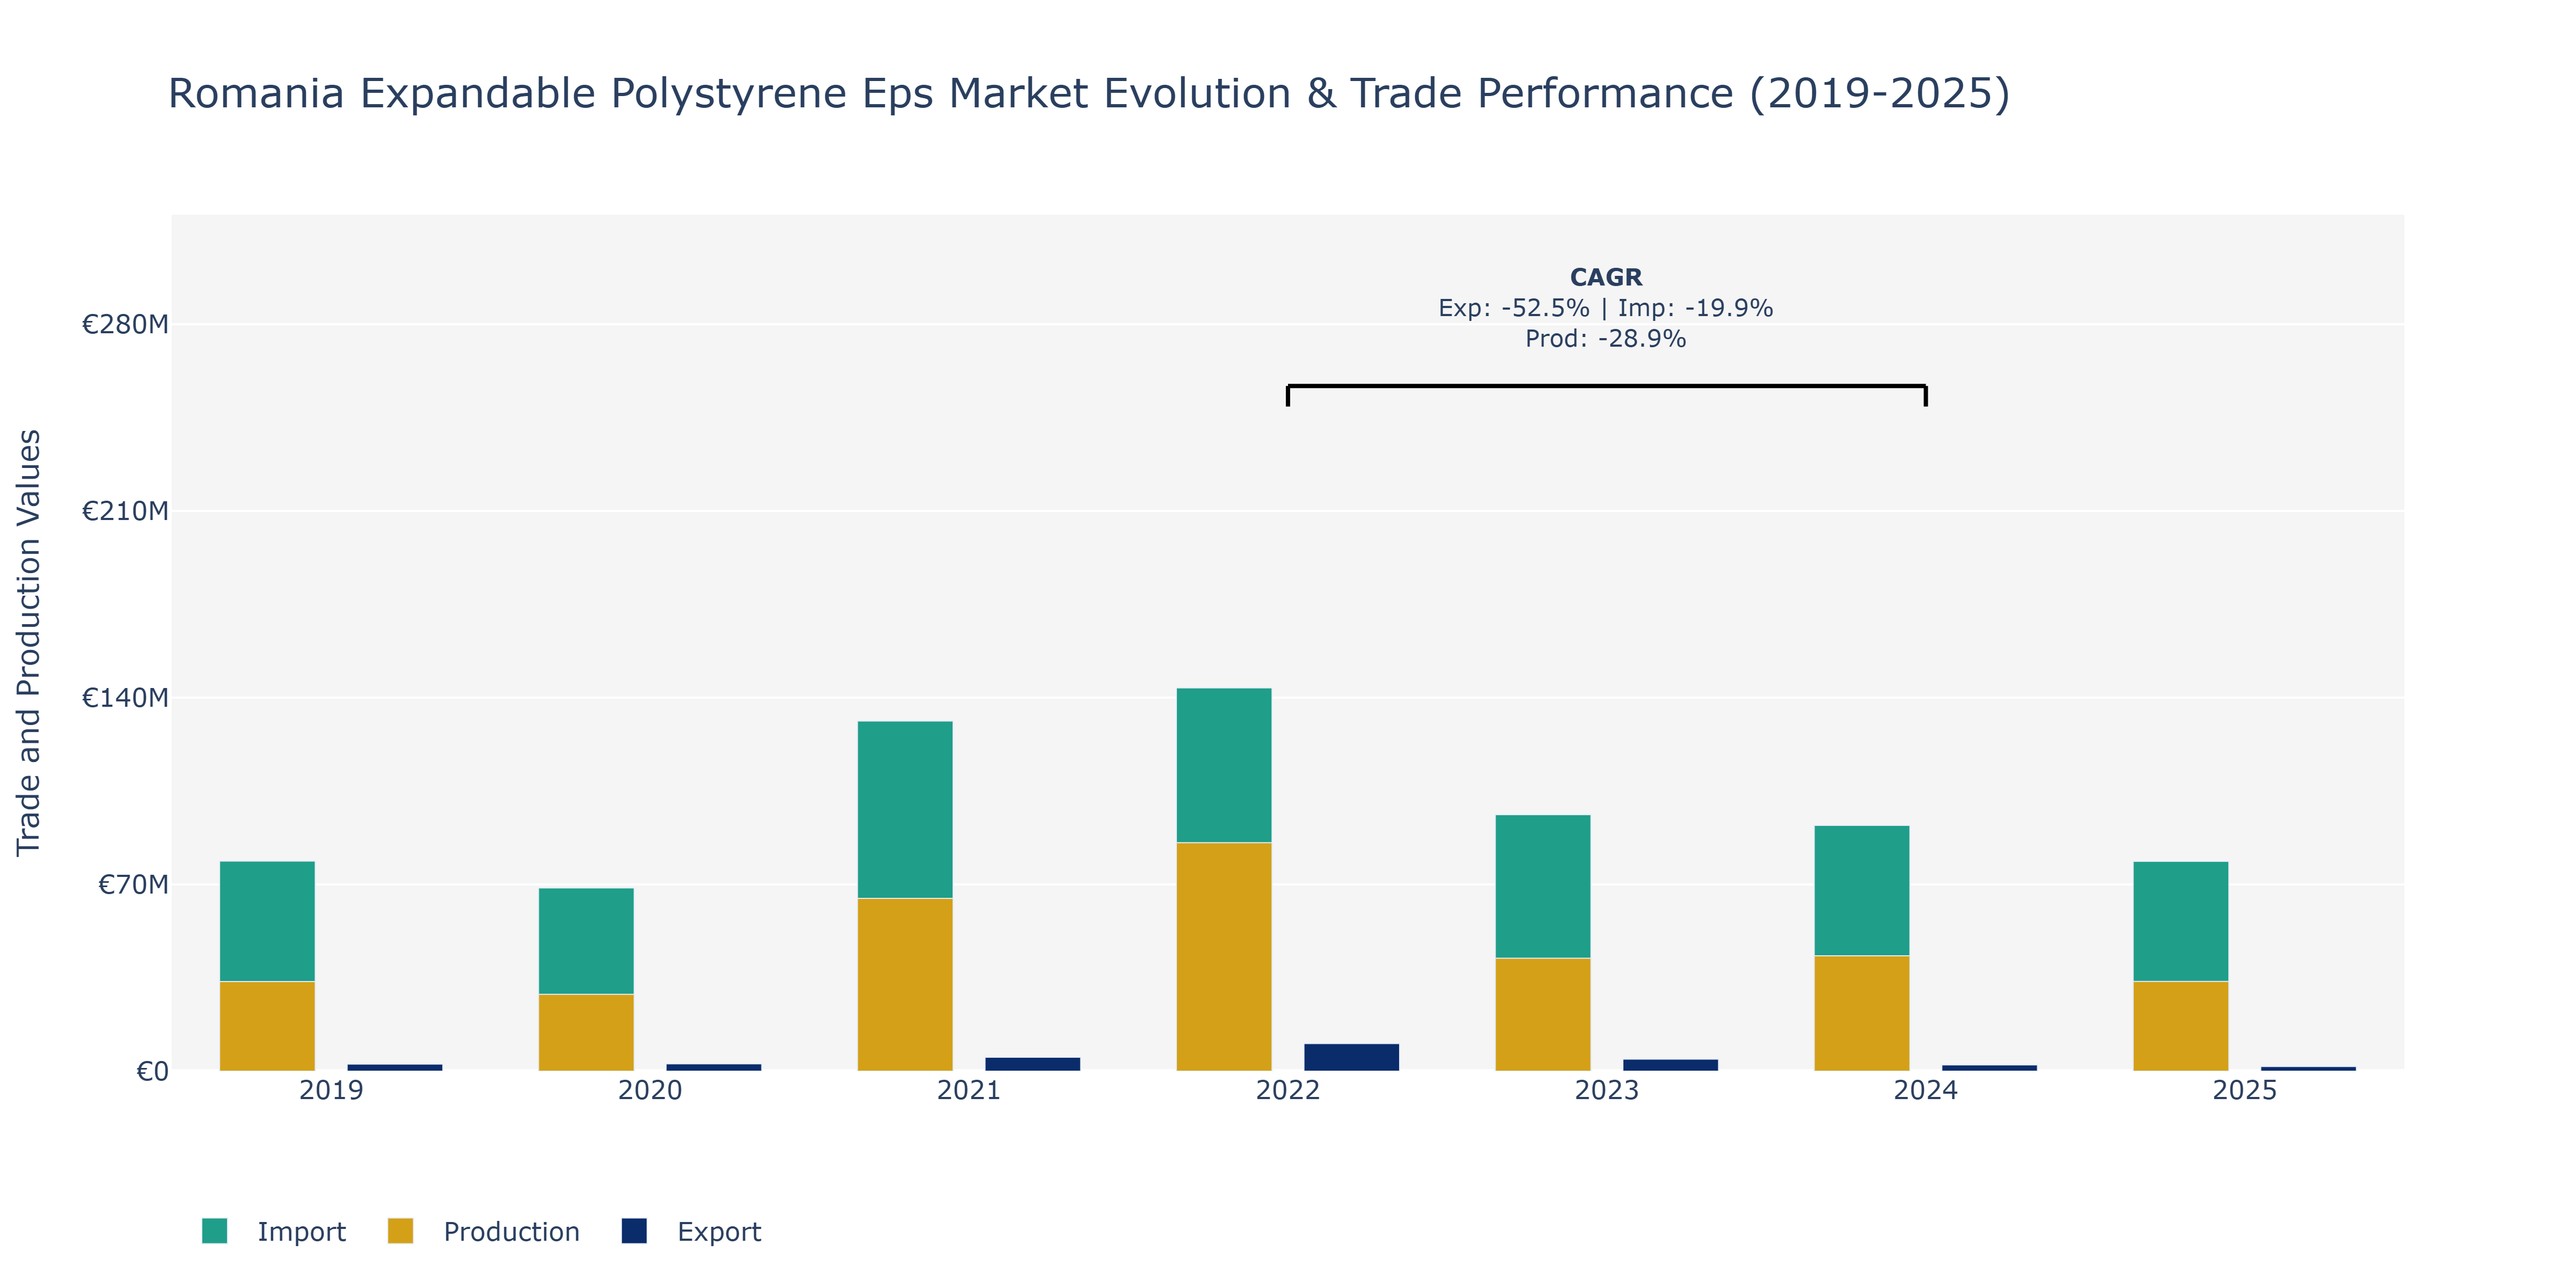
In the Romania Expandable Polystyrene EPS market, from 2019 to 2025, Exports saw fluctuations with a peak in 2022 at €10.38 million and a decline in subsequent years to €1.76 million in 2025. Imports followed a similar pattern, peaking in 2022 at €143.69 million and dropping to €78.67 million in 2025. Production also experienced a peak in 2021 at €64.80 million, followed by a decrease to €33.67 million in 2025. The notable decline in Exports and Production could be attributed to factors such as changes in global demand for EPS products, shifts in raw material costs affecting production, and evolving trade policies impacting both exports and imports. To remain competitive, companies in the Romanian EPS market may need to focus on product innovation, cost-efficiency, and market diversification strategies. Keeping abreast of sustainable practices and investing in green EPS solutions could also help navigate market challenges.
Key Highlights of the Report:
- Romania Expandable Polystyrene EPS Market Outlook
- Market Size of Romania Expandable Polystyrene EPS Market, 2025
- Forecast of Romania Expandable Polystyrene EPS Market, 2032
- Historical Data and Forecast of Romania Expandable Polystyrene EPS Revenues & Volume for the Period 2022-2032F
- Romania Expandable Polystyrene EPS Market Trend Evolution
- Romania Expandable Polystyrene EPS Market Drivers and Challenges
- Romania Expandable Polystyrene EPS Price Trends
- Romania Expandable Polystyrene EPS Porter's Five Forces
- Romania Expandable Polystyrene EPS Industry Life Cycle
- Historical Data and Forecast of Romania Expandable Polystyrene EPS Market Revenues & Volume By Type for the Period 2022-2032F
- Historical Data and Forecast of Romania Expandable Polystyrene EPS Market Revenues & Volume By White for the Period 2022-2032F
- Historical Data and Forecast of Romania Expandable Polystyrene EPS Market Revenues & Volume By Grey for the Period 2022-2032F
- Historical Data and Forecast of Romania Expandable Polystyrene EPS Market Revenues & Volume By Silver for the Period 2022-2032F
- Historical Data and Forecast of Romania Expandable Polystyrene EPS Market Revenues & Volume By End User for the Period 2022-2032F
- Historical Data and Forecast of Romania Expandable Polystyrene EPS Market Revenues & Volume By Building and Construction for the Period 2022-2032F
- Historical Data and Forecast of Romania Expandable Polystyrene EPS Market Revenues & Volume By Packaging for the Period 2022-2032F
- Historical Data and Forecast of Romania Expandable Polystyrene EPS Market Revenues & Volume By Other End Users for the Period 2022-2032F
- Romania Expandable Polystyrene EPS Import Export Trade Statistics
- Market Opportunity Assessment By Type
- Market Opportunity Assessment By End User
- Romania Expandable Polystyrene EPS Top Companies Market Share
- Romania Expandable Polystyrene EPS Competitive Benchmarking By Technical and Operational Parameters
- Romania Expandable Polystyrene EPS Company Profiles
- Romania Expandable Polystyrene EPS Key Strategic Recommendations
Frequently Asked Questions About the Market Study (FAQs):
6Wresearch actively monitors the Romania Expandable Polystyrene EPS Market and publishes its comprehensive annual report, highlighting emerging trends, growth drivers, revenue analysis, and forecast outlook. Our insights help businesses to make data-backed strategic decisions with ongoing market dynamics. Our analysts track relevent industries related to the Romania Expandable Polystyrene EPS Market, allowing our clients with actionable intelligence and reliable forecasts tailored to emerging regional needs.
Yes, we provide customisation as per your requirements. To learn more, feel free to contact us on sales@6wresearch.com
1 Executive Summary |
2 Introduction |
2.1 Key Highlights of the Report |
2.2 Report Description |
2.3 Market Scope & Segmentation |
2.4 Research Methodology |
2.5 Assumptions |
3 Romania Expandable Polystyrene EPS Market Overview |
3.1 Romania Country Macro Economic Indicators |
3.2 Romania Expandable Polystyrene EPS Market Revenues & Volume, 2022 & 2032F |
3.3 Romania Expandable Polystyrene EPS Market - Industry Life Cycle |
3.4 Romania Expandable Polystyrene EPS Market - Porter's Five Forces |
3.5 Romania Expandable Polystyrene EPS Market Revenues & Volume Share, By Type, 2022 & 2032F |
3.6 Romania Expandable Polystyrene EPS Market Revenues & Volume Share, By End User, 2022 & 2032F |
4 Romania Expandable Polystyrene EPS Market Dynamics |
4.1 Impact Analysis |
4.2 Market Drivers |
4.2.1 Increasing demand for packaging solutions in various industries |
4.2.2 Growing construction sector in Romania |
4.2.3 Rising disposable income leading to higher consumer spending |
4.3 Market Restraints |
4.3.1 Fluctuating raw material prices |
4.3.2 Stringent regulations regarding environmental impact and recycling of EPS |
4.3.3 Competition from alternative packaging materials |
5 Romania Expandable Polystyrene EPS Market Trends |
6 Romania Expandable Polystyrene EPS Market, By Types |
6.1 Romania Expandable Polystyrene EPS Market, By Type |
6.1.1 Overview and Analysis |
6.1.2 Romania Expandable Polystyrene EPS Market Revenues & Volume, By Type, 2022-2032F |
6.1.3 Romania Expandable Polystyrene EPS Market Revenues & Volume, By White, 2022-2032F |
6.1.4 Romania Expandable Polystyrene EPS Market Revenues & Volume, By Grey, 2022-2032F |
6.1.5 Romania Expandable Polystyrene EPS Market Revenues & Volume, By Silver, 2022-2032F |
6.2 Romania Expandable Polystyrene EPS Market, By End User |
6.2.1 Overview and Analysis |
6.2.2 Romania Expandable Polystyrene EPS Market Revenues & Volume, By Building and Construction, 2022-2032F |
6.2.3 Romania Expandable Polystyrene EPS Market Revenues & Volume, By Packaging, 2022-2032F |
6.2.4 Romania Expandable Polystyrene EPS Market Revenues & Volume, By Other End Users, 2022-2032F |
7 Romania Expandable Polystyrene EPS Market Import-Export Trade Statistics |
7.1 Romania Expandable Polystyrene EPS Market Export to Major Countries |
7.2 Romania Expandable Polystyrene EPS Market Imports from Major Countries |
8 Romania Expandable Polystyrene EPS Market Key Performance Indicators |
8.1 Recycling rate of EPS in Romania |
8.2 Number of new construction projects utilizing EPS |
8.3 Adoption rate of EPS in packaging applications in key industries |
9 Romania Expandable Polystyrene EPS Market - Opportunity Assessment |
9.1 Romania Expandable Polystyrene EPS Market Opportunity Assessment, By Type, 2022 & 2032F |
9.2 Romania Expandable Polystyrene EPS Market Opportunity Assessment, By End User, 2022 & 2032F |
10 Romania Expandable Polystyrene EPS Market - Competitive Landscape |
10.1 Romania Expandable Polystyrene EPS Market Revenue Share, By Companies, 2025 |
10.2 Romania Expandable Polystyrene EPS Market Competitive Benchmarking, By Operating and Technical Parameters |
11 Company Profiles |
12 Recommendations |
13 Disclaimer |
Global Go To Market Strategy - 2030
Export potential enables firms to identify high-growth global markets with greater confidence by combining advanced trade intelligence with a structured quantitative methodology. The framework analyzes emerging demand trends and country-level import patterns while integrating macroeconomic and trade datasets such as GDP and population forecasts, bilateral import–export flows, tariff structures, elasticity differentials between developed and developing economies, geographic distance, and import demand projections. Using weighted trade values from 2020–2024 as the base period to project country-to-country export potential for 2030, these inputs are operationalized through calculated drivers such as gravity model parameters, tariff impact factors, and projected GDP per-capita growth. Through an analysis of hidden potentials, demand hotspots, and market conditions that are most favorable to success, this method enables firms to focus on target countries, maximize returns, and global expansion with data, backed by accuracy.
By factoring in the projected importer demand gap that is currently unmet and could be potential opportunity, it identifies the potential for the Exporter (Country) among 190 countries, against the general trade analysis, which identifies the biggest importer or exporter.
To discover high-growth global markets and optimize your business strategy:
Click Here
Pricing
- Single User License$ 1,995
- Department License$ 2,400
- Site License$ 3,120
- Global License$ 3,795

Leadership Perspectives from Industry Events
Search
Thought Leadership and Analyst Meet


Our Clients
6WResearch In News
- Doha a strategic location for EV manufacturing hub: IPA Qatar
- Demand for luxury TVs surging in the GCC, says Samsung
- Empowering Growth: The Thriving Journey of Bangladesh’s Cable Industry
- Demand for luxury TVs surging in the GCC, says Samsung
- Video call with a traditional healer? Once unthinkable, it’s now common in South Africa
- Intelligent Buildings To Smooth GCC’s Path To Net Zero
Latest Reports
- New Zealand Aseptic Manufacturing Market (2026-2032)
- Netherlands Aseptic Manufacturing Market (2026-2032)
- Nauru Aseptic Manufacturing Market (2026-2032)
- Namibia Aseptic Manufacturing Market (2026-2032)
- Mozambique Aseptic Manufacturing Market (2026-2032)
- Montenegro Aseptic Manufacturing Market (2026-2032)
- Mongolia Aseptic Manufacturing Market (2026-2032)
- Monaco Aseptic Manufacturing Market (2026-2032)
- Micronesia Aseptic Manufacturing Market (2026-2032)
- Mauritius Aseptic Manufacturing Market (2026-2032)
Industry Events and Analyst Meet

HIMTEX 2026

India Refining Summit 2026

India EV Show 2026

EV tech India Expo 2026

Auto Tech Asia 2026
Whitepaper
- Middle East & Africa Commercial Security Market Click here to view more.
- Middle East & Africa Fire Safety Systems & Equipment Market Click here to view more.
- GCC Drone Market Click here to view more.
- Middle East Lighting Fixture Market Click here to view more.
- GCC Physical & Perimeter Security Market Click here to view more.