Romania Food Colors Market Outlook | Analysis, Growth, Revenue, Industry, Size, Companies, Forecast, COVID-19 IMPACT, Value, Share & Trends
Market Forecast By Type (Natural, Synthetic, Nature Identical), By Application (Food Products, Beverages), By Form (Liquid, Powder, Gel), By Solubility (Dyes, Lakes) And Competitive Landscape
| Product Code: ETC325698 | Publication Date: Aug 2022 | Updated Date: Aug 2025 | Product Type: Market Research Report | |
| Publisher: 6Wresearch | Author: Shubham Padhi | No. of Pages: 75 | No. of Figures: 35 | No. of Tables: 20 |
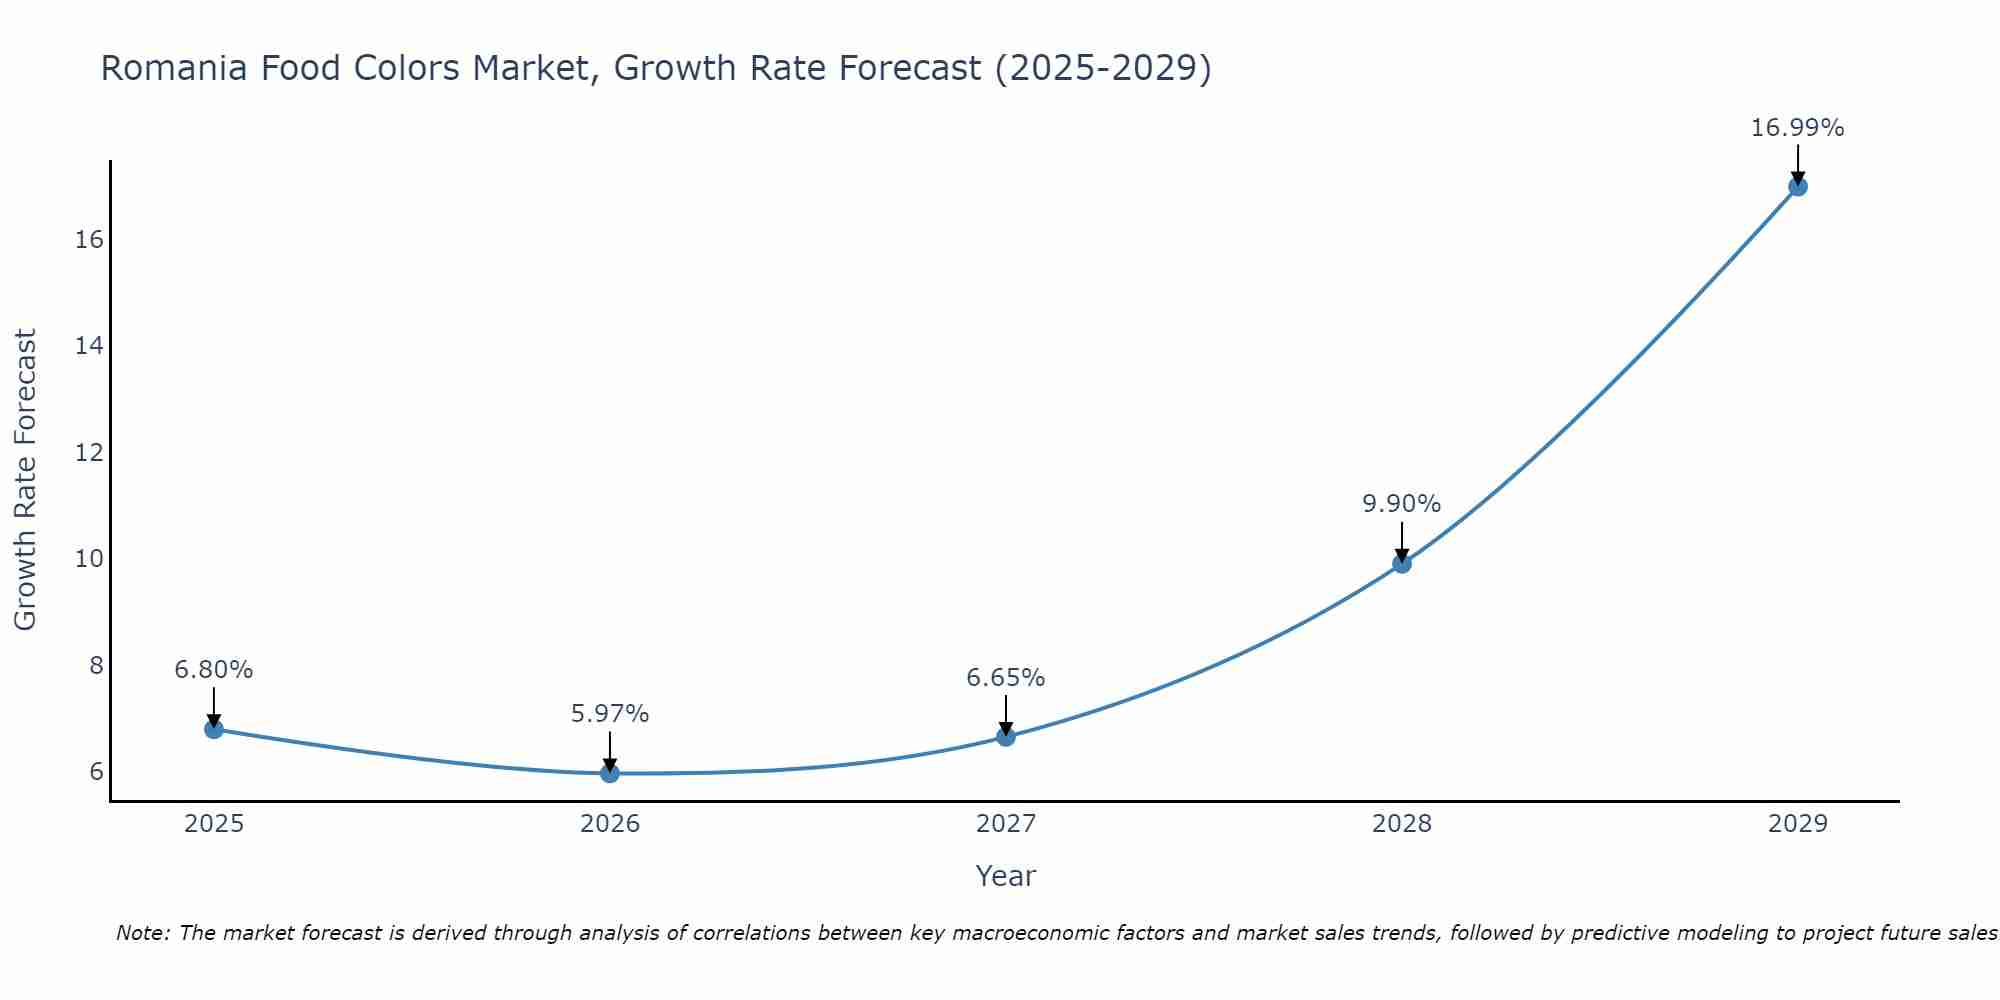
Romania Food Colors Market Size Growth Rate
The Romania Food Colors Market is projected to witness mixed growth rate patterns during 2025 to 2029. The growth rate starts at 6.80% in 2025 and reaches 16.99% by 2029.
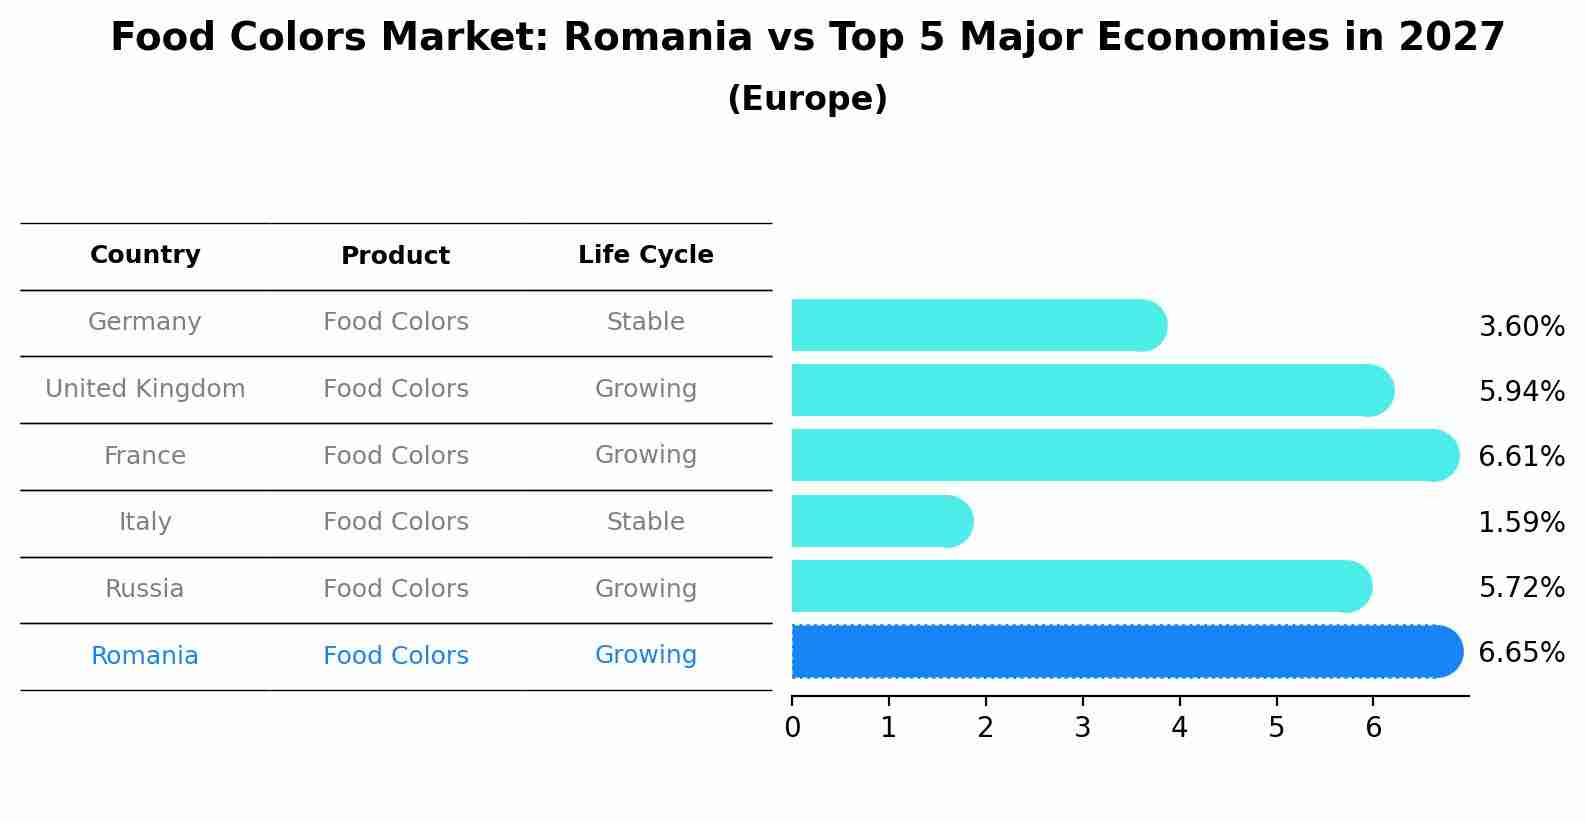
Food Colors Market: Romania vs Top 5 Major Economies in 2027 (Europe)
In the Europe region, the Food Colors market in Romania is projected to expand at a growing growth rate of 6.65% by 2027. The largest economy is Germany, followed by United Kingdom, France, Italy and Russia.
Romania Food Colors Market Overview
The market for food colors includes natural and synthetic colorants used to enhance the appearance of food and beverages.
Drivers of the market
Growing food and beverage industry, consumer preference for visually appealing products, and innovation in natural and clean label food colors.
Challenges of the market
The food colors market in Romania encounters challenges related to consumer demand for natural and clean-label ingredients, regulatory compliance, and technological innovations in color formulation. Meeting stringent food safety regulations and addressing health concerns associated with synthetic colors are significant hurdles. Additionally, achieving stability, solubility, and color consistency in diverse food applications poses challenges for manufacturers. Innovations in natural color extraction methods, microencapsulation technologies, and sustainable color solutions will shape market trends and growth opportunities.
Government Policy of the market
In the Romania food colors market, government policies prioritize food safety, consumer preferences, and regulatory compliance. Policies support use of food colorants, permissible levels in food products, and labeling transparency. Regulatory frameworks address color additive safety, usage guidelines, and approval processes to ensure food product safety, protect public health, and meet international food regulatory standards, fostering consumer confidence and promoting market growth in the food and beverage industry.
Key Highlights of the Report:
- Romania Food Colors Market Outlook
- Market Size of Romania Food Colors Market, 2024
- Forecast of Romania Food Colors Market, 2031
- Historical Data and Forecast of Romania Food Colors Revenues & Volume for the Period 2018 - 2031
- Romania Food Colors Market Trend Evolution
- Romania Food Colors Market Drivers and Challenges
- Romania Food Colors Price Trends
- Romania Food Colors Porter's Five Forces
- Romania Food Colors Industry Life Cycle
- Historical Data and Forecast of Romania Food Colors Market Revenues & Volume By Type for the Period 2018 - 2031
- Historical Data and Forecast of Romania Food Colors Market Revenues & Volume By Natural for the Period 2018 - 2031
- Historical Data and Forecast of Romania Food Colors Market Revenues & Volume By Synthetic for the Period 2018 - 2031
- Historical Data and Forecast of Romania Food Colors Market Revenues & Volume By Nature Identical for the Period 2018 - 2031
- Historical Data and Forecast of Romania Food Colors Market Revenues & Volume By Application for the Period 2018 - 2031
- Historical Data and Forecast of Romania Food Colors Market Revenues & Volume By Food Products for the Period 2018 - 2031
- Historical Data and Forecast of Romania Food Colors Market Revenues & Volume By Beverages for the Period 2018 - 2031
- Historical Data and Forecast of Romania Food Colors Market Revenues & Volume By Form for the Period 2018 - 2031
- Historical Data and Forecast of Romania Food Colors Market Revenues & Volume By Liquid for the Period 2018 - 2031
- Historical Data and Forecast of Romania Food Colors Market Revenues & Volume By Powder for the Period 2018 - 2031
- Historical Data and Forecast of Romania Food Colors Market Revenues & Volume By Gel for the Period 2018 - 2031
- Historical Data and Forecast of Romania Food Colors Market Revenues & Volume By Solubility for the Period 2018 - 2031
- Historical Data and Forecast of Romania Food Colors Market Revenues & Volume By Dyes for the Period 2018 - 2031
- Historical Data and Forecast of Romania Food Colors Market Revenues & Volume By Lakes for the Period 2018 - 2031
- Romania Food Colors Import Export Trade Statistics
- Market Opportunity Assessment By Type
- Market Opportunity Assessment By Application
- Market Opportunity Assessment By Form
- Market Opportunity Assessment By Solubility
- Romania Food Colors Top Companies Market Share
- Romania Food Colors Competitive Benchmarking By Technical and Operational Parameters
- Romania Food Colors Company Profiles
- Romania Food Colors Key Strategic Recommendations
Frequently Asked Questions About the Market Study (FAQs):
6Wresearch actively monitors the Romania Food Colors Market and publishes its comprehensive annual report, highlighting emerging trends, growth drivers, revenue analysis, and forecast outlook. Our insights help businesses to make data-backed strategic decisions with ongoing market dynamics. Our analysts track relevent industries related to the Romania Food Colors Market, allowing our clients with actionable intelligence and reliable forecasts tailored to emerging regional needs.
Yes, we provide customisation as per your requirements. To learn more, feel free to contact us on sales@6wresearch.com
1 Executive Summary |
2 Introduction |
2.1 Key Highlights of the Report |
2.2 Report Description |
2.3 Market Scope & Segmentation |
2.4 Research Methodology |
2.5 Assumptions |
3 Romania Food Colors Market Overview |
3.1 Romania Country Macro Economic Indicators |
3.2 Romania Food Colors Market Revenues & Volume, 2021 & 2031F |
3.3 Romania Food Colors Market - Industry Life Cycle |
3.4 Romania Food Colors Market - Porter's Five Forces |
3.5 Romania Food Colors Market Revenues & Volume Share, By Type, 2021 & 2031F |
3.6 Romania Food Colors Market Revenues & Volume Share, By Application, 2021 & 2031F |
3.7 Romania Food Colors Market Revenues & Volume Share, By Form, 2021 & 2031F |
3.8 Romania Food Colors Market Revenues & Volume Share, By Solubility, 2021 & 2031F |
4 Romania Food Colors Market Dynamics |
4.1 Impact Analysis |
4.2 Market Drivers |
4.2.1 Increasing consumer demand for natural and organic food products |
4.2.2 Growth in the food and beverage industry in Romania |
4.2.3 Rising awareness about the health benefits of using natural food colors |
4.3 Market Restraints |
4.3.1 Stringent regulations related to the use of food colors in Romania |
4.3.2 Fluctuating prices of raw materials for food color production |
5 Romania Food Colors Market Trends |
6 Romania Food Colors Market, By Types |
6.1 Romania Food Colors Market, By Type |
6.1.1 Overview and Analysis |
6.1.2 Romania Food Colors Market Revenues & Volume, By Type, 2021-2031F |
6.1.3 Romania Food Colors Market Revenues & Volume, By Natural, 2021-2031F |
6.1.4 Romania Food Colors Market Revenues & Volume, By Synthetic, 2021-2031F |
6.1.5 Romania Food Colors Market Revenues & Volume, By Nature Identical, 2021-2031F |
6.2 Romania Food Colors Market, By Application |
6.2.1 Overview and Analysis |
6.2.2 Romania Food Colors Market Revenues & Volume, By Food Products, 2021-2031F |
6.2.3 Romania Food Colors Market Revenues & Volume, By Beverages, 2021-2031F |
6.3 Romania Food Colors Market, By Form |
6.3.1 Overview and Analysis |
6.3.2 Romania Food Colors Market Revenues & Volume, By Liquid, 2021-2031F |
6.3.3 Romania Food Colors Market Revenues & Volume, By Powder, 2021-2031F |
6.3.4 Romania Food Colors Market Revenues & Volume, By Gel, 2021-2031F |
6.4 Romania Food Colors Market, By Solubility |
6.4.1 Overview and Analysis |
6.4.2 Romania Food Colors Market Revenues & Volume, By Dyes, 2021-2031F |
6.4.3 Romania Food Colors Market Revenues & Volume, By Lakes, 2021-2031F |
7 Romania Food Colors Market Import-Export Trade Statistics |
7.1 Romania Food Colors Market Export to Major Countries |
7.2 Romania Food Colors Market Imports from Major Countries |
8 Romania Food Colors Market Key Performance Indicators |
8.1 Consumer preference for natural food colors over synthetic ones |
8.2 Adoption rate of natural food colors by food manufacturers in Romania |
8.3 Number of new product launches using natural food colors in the market |
9 Romania Food Colors Market - Opportunity Assessment |
9.1 Romania Food Colors Market Opportunity Assessment, By Type, 2021 & 2031F |
9.2 Romania Food Colors Market Opportunity Assessment, By Application, 2021 & 2031F |
9.3 Romania Food Colors Market Opportunity Assessment, By Form, 2021 & 2031F |
9.4 Romania Food Colors Market Opportunity Assessment, By Solubility, 2021 & 2031F |
10 Romania Food Colors Market - Competitive Landscape |
10.1 Romania Food Colors Market Revenue Share, By Companies, 2024 |
10.2 Romania Food Colors Market Competitive Benchmarking, By Operating and Technical Parameters |
11 Company Profiles |
12 Recommendations |
13 Disclaimer |
Global Go To Market Strategy - 2030
Export potential enables firms to identify high-growth global markets with greater confidence by combining advanced trade intelligence with a structured quantitative methodology. The framework analyzes emerging demand trends and country-level import patterns while integrating macroeconomic and trade datasets such as GDP and population forecasts, bilateral import–export flows, tariff structures, elasticity differentials between developed and developing economies, geographic distance, and import demand projections. Using weighted trade values from 2020–2024 as the base period to project country-to-country export potential for 2030, these inputs are operationalized through calculated drivers such as gravity model parameters, tariff impact factors, and projected GDP per-capita growth. Through an analysis of hidden potentials, demand hotspots, and market conditions that are most favorable to success, this method enables firms to focus on target countries, maximize returns, and global expansion with data, backed by accuracy.
By factoring in the projected importer demand gap that is currently unmet and could be potential opportunity, it identifies the potential for the Exporter (Country) among 190 countries, against the general trade analysis, which identifies the biggest importer or exporter.
To discover high-growth global markets and optimize your business strategy:
Click Here
Pricing
- Single User License$ 1,995
- Department License$ 2,400
- Site License$ 3,120
- Global License$ 3,795

Leadership Perspectives from Industry Events
Search
Thought Leadership and Analyst Meet


Our Clients
6WResearch In News
- India Air Conditioner Market Set for Strong Rebound in 2026 After Weather-Led Correction and GST-Driven Recovery: 6Wresearch
- ADAS in India: How Automatic Emergency Braking, Blind Spot Detection & Driver Monitoring are Transforming Road Safety
- Doha a strategic location for EV manufacturing hub: IPA Qatar
- Demand for luxury TVs surging in the GCC, says Samsung
- Empowering Growth: The Thriving Journey of Bangladesh’s Cable Industry
- Demand for luxury TVs surging in the GCC, says Samsung
Latest Reports
- Nicaragua RPG Gaming Market (2026-2032)
- New Zealand RPG Gaming Market (2026-2032)
- Netherlands RPG Gaming Market (2026-2032)
- Nauru RPG Gaming Market (2026-2032)
- Namibia RPG Gaming Market (2026-2032)
- Mozambique RPG Gaming Market (2026-2032)
- Montenegro RPG Gaming Market (2026-2032)
- Mongolia RPG Gaming Market (2026-2032)
- Monaco RPG Gaming Market (2026-2032)
- Micronesia RPG Gaming Market (2026-2032)
Industry Events and Analyst Meet

EV India Expo 2026

HIMTEX 2026

India Refining Summit 2026

India EV Show 2026

EV tech India Expo 2026
Whitepaper
- Middle East & Africa Commercial Security Market Click here to view more.
- Middle East & Africa Fire Safety Systems & Equipment Market Click here to view more.
- GCC Drone Market Click here to view more.
- Middle East Lighting Fixture Market Click here to view more.
- GCC Physical & Perimeter Security Market Click here to view more.