Romania Portable Filtration Systems Market (2026-2032) Outlook | Analysis, Share, Industry, Trends, Companies, Growth, Size, Value, Forecast & Revenue
Market Forecast By End-User (Power Generation, Manufacturing, Oil & Gas), By Flow Rate (0“10, >10“20, >20“60, >60“100, Above 100 GPM), By Technology (Pressure, Centrifugal, Vacuum Filtration) And Competitive Landscape
| Product Code: ETC4529419 | Publication Date: Jul 2023 | Updated Date: Mar 2026 | Product Type: Report | |
| Publisher: 6Wresearch | Author: Dhaval Chaurasia | No. of Pages: 85 | No. of Figures: 45 | No. of Tables: 25 |
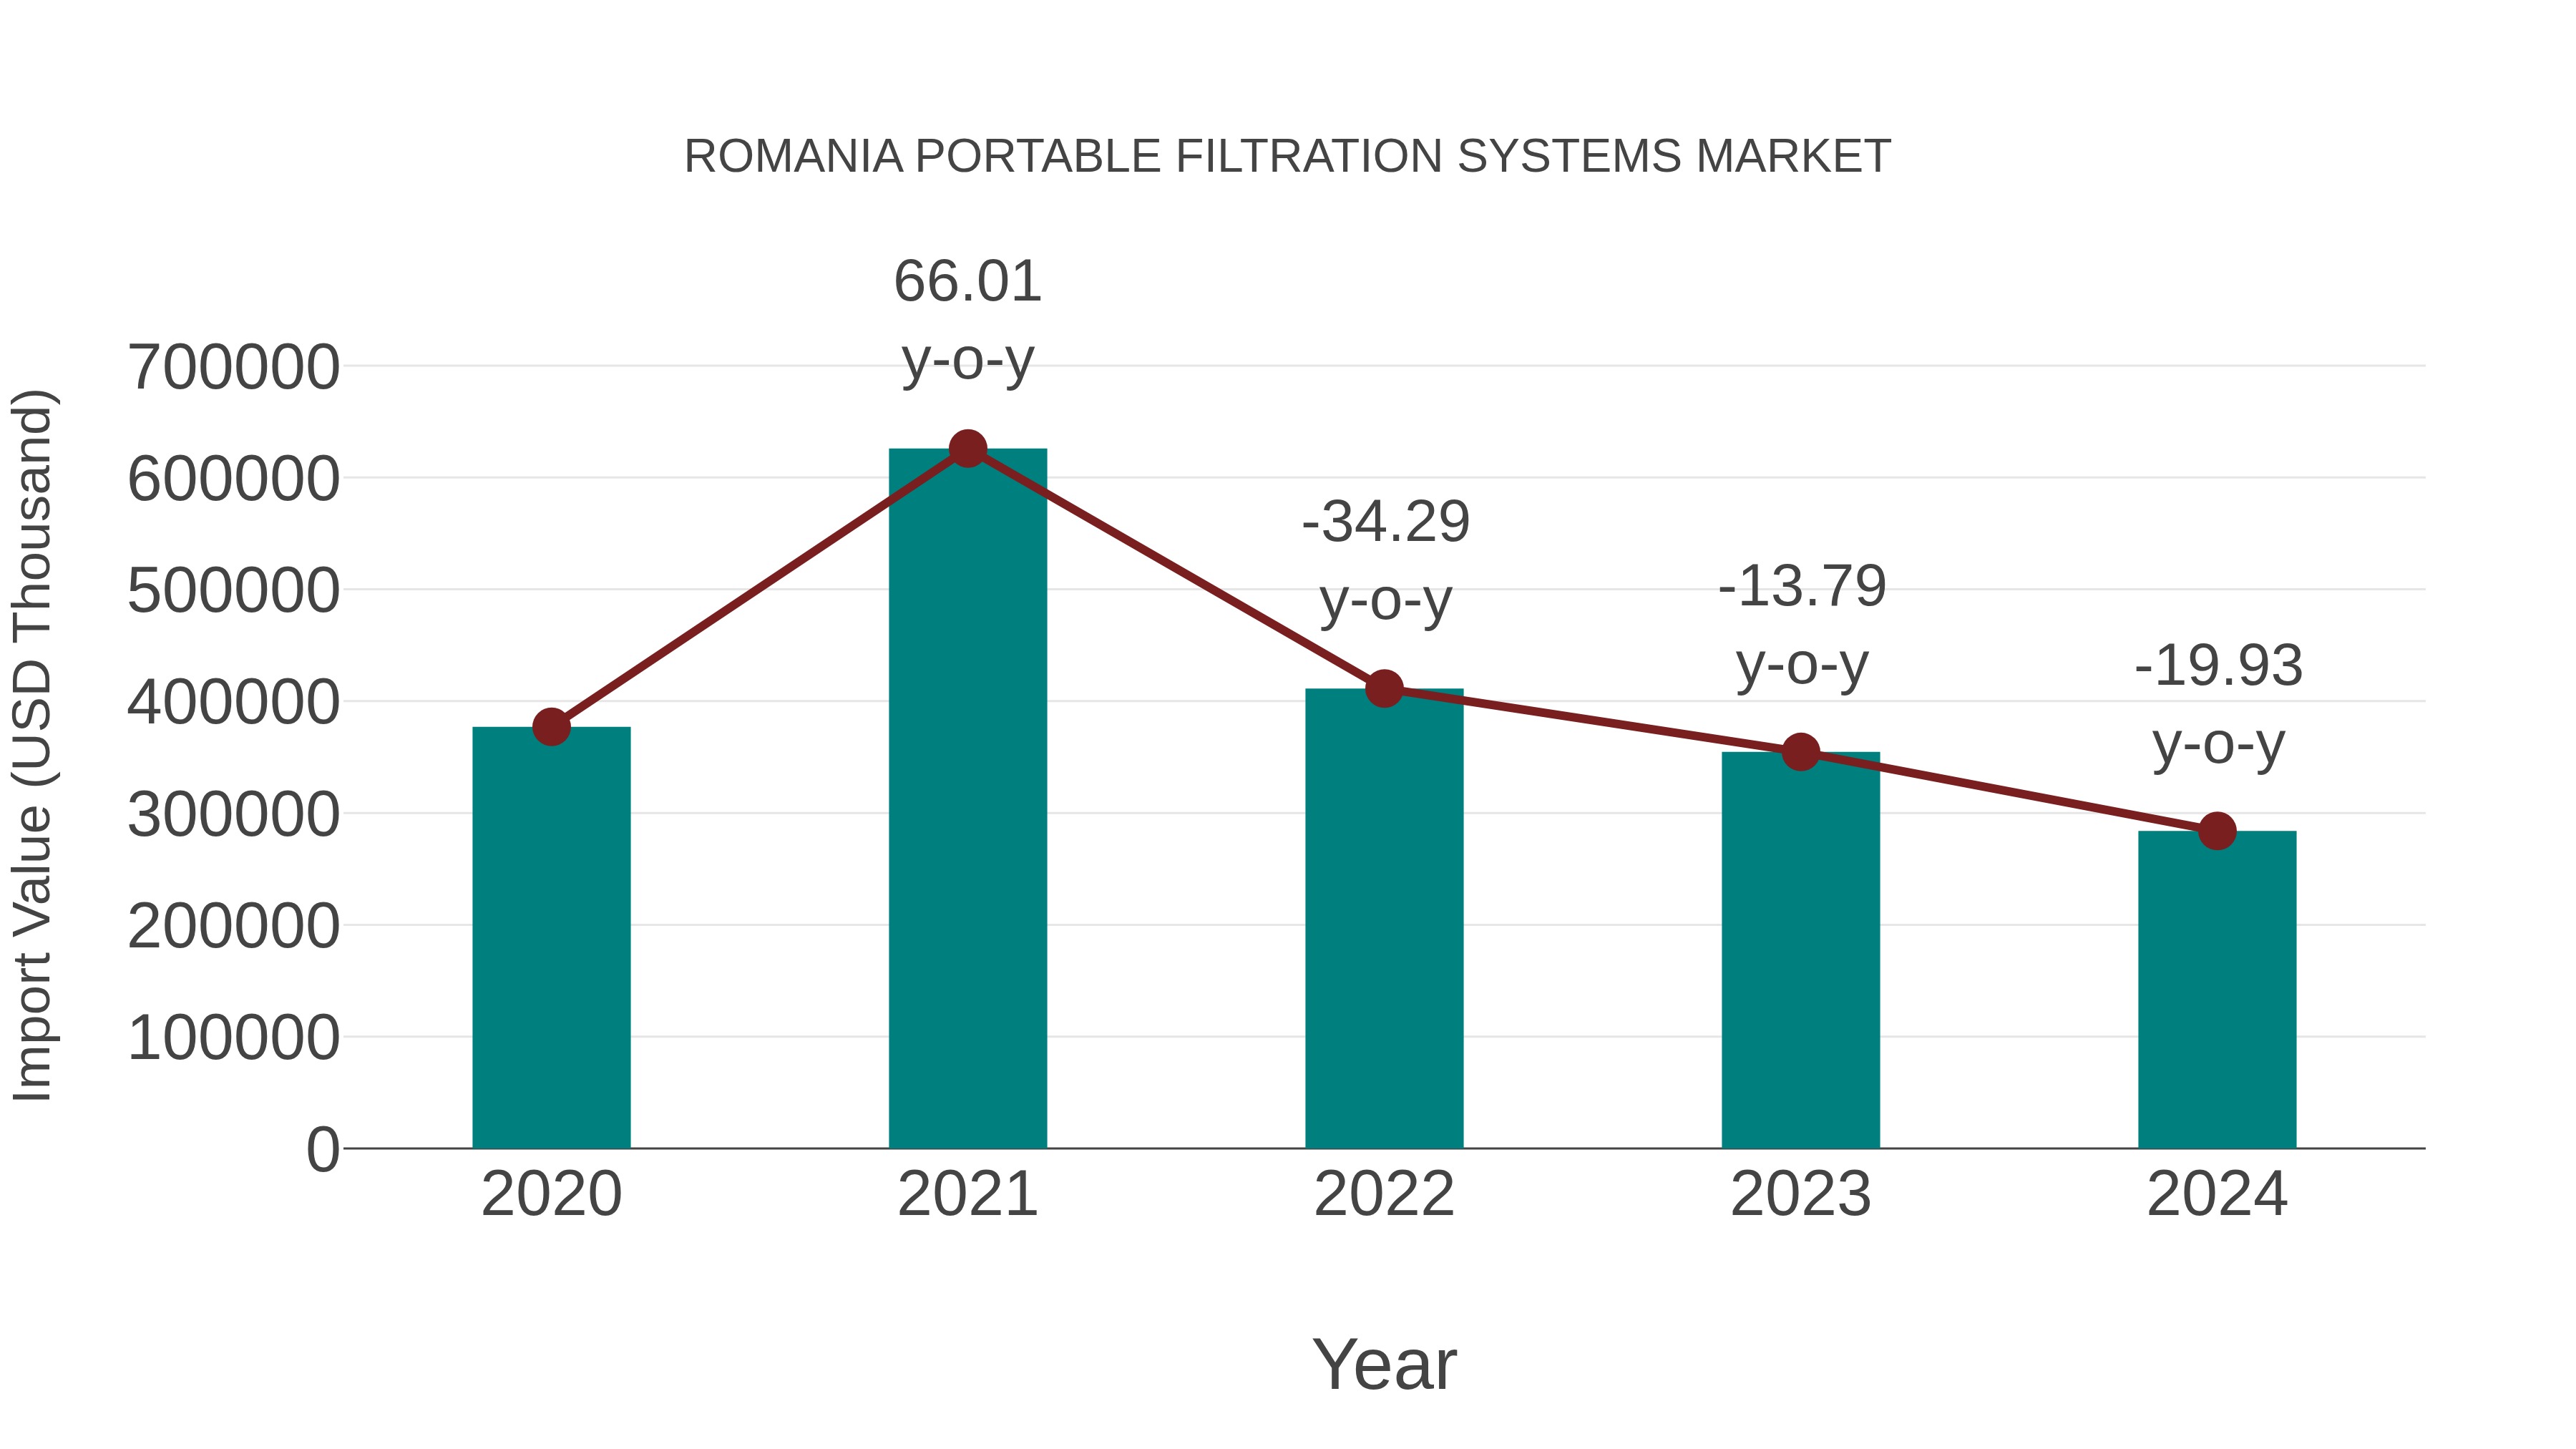
Romania Portable Filtration Systems Market: Import Trend Analysis
In 2024, Romania`s import trend for portable filtration systems experienced a decline, with a growth rate of -19.93% compared to the previous year. The compound annual growth rate (CAGR) for the period 2020-2024 stood at -6.85%. This negative import momentum could be attributed to shifting demand patterns or market saturation, impacting the market`s stability during this period.
Romania Portable Filtration Systems Market Overview
The portable filtration systems market in Romania is driven by the need for clean water and air in industrial, residential, and commercial sectors. These systems are essential for removing contaminants and ensuring safety and compliance with environmental standards.
Drivers of the market
In Romania, the portable filtration systems market is driven by its applications in water treatment, healthcare, and emergency response sectors. Advantages such as mobility, ease of deployment, and effectiveness in providing clean water and air contribute to market growth.
Challenges of the market
Adapting to water quality standards and addressing reliability in remote applications pose challenges in the Romania portable filtration systems market. Developing compact and efficient filtration solutions for emergency response, military, and outdoor recreation are critical for market acceptance.
Government Policy of the market
The Romanian government regulates the portable filtration systems market to ensure water quality, filtration efficiency, and environmental protection. Policies include filtration system standards, water purification guidelines, and support for portable filtration technology innovations.
Key Highlights of the Report:
- Romania Portable Filtration Systems Market Outlook
- Market Size of Romania Portable Filtration Systems Market, 2025
- Forecast of Romania Portable Filtration Systems Market, 2032
- Historical Data and Forecast of Romania Portable Filtration Systems Revenues & Volume for the Period 2022-2032F
- Romania Portable Filtration Systems Market Trend Evolution
- Romania Portable Filtration Systems Market Drivers and Challenges
- Romania Portable Filtration Systems Price Trends
- Romania Portable Filtration Systems Porter's Five Forces
- Romania Portable Filtration Systems Industry Life Cycle
- Historical Data and Forecast of Romania Portable Filtration Systems Market Revenues & Volume By End-User for the Period 2022-2032F
- Historical Data and Forecast of Romania Portable Filtration Systems Market Revenues & Volume By Power Generation for the Period 2022-2032F
- Historical Data and Forecast of Romania Portable Filtration Systems Market Revenues & Volume By Manufacturing for the Period 2022-2032F
- Historical Data and Forecast of Romania Portable Filtration Systems Market Revenues & Volume By Oil & Gas for the Period 2022-2032F
- Historical Data and Forecast of Romania Portable Filtration Systems Market Revenues & Volume By Flow Rate for the Period 2022-2032F
- Historical Data and Forecast of Romania Portable Filtration Systems Market Revenues & Volume By 0??10 for the Period 2022-2032F
- Historical Data and Forecast of Romania Portable Filtration Systems Market Revenues & Volume By >10??20 for the Period 2022-2032F
- Historical Data and Forecast of Romania Portable Filtration Systems Market Revenues & Volume By >20??60 for the Period 2022-2032F
- Historical Data and Forecast of Romania Portable Filtration Systems Market Revenues & Volume By >60??100 for the Period 2022-2032F
- Historical Data and Forecast of Romania Portable Filtration Systems Market Revenues & Volume By Above 100 GPM for the Period 2022-2032F
- Historical Data and Forecast of Romania Portable Filtration Systems Market Revenues & Volume By Technology for the Period 2022-2032F
- Historical Data and Forecast of Romania Portable Filtration Systems Market Revenues & Volume By Pressure for the Period 2022-2032F
- Historical Data and Forecast of Romania Portable Filtration Systems Market Revenues & Volume By Centrifugal for the Period 2022-2032F
- Historical Data and Forecast of Romania Portable Filtration Systems Market Revenues & Volume By Vacuum Filtration for the Period 2022-2032F
- Romania Portable Filtration Systems Import Export Trade Statistics
- Market Opportunity Assessment By End-User
- Market Opportunity Assessment By Flow Rate
- Market Opportunity Assessment By Technology
- Romania Portable Filtration Systems Top Companies Market Share
- Romania Portable Filtration Systems Competitive Benchmarking By Technical and Operational Parameters
- Romania Portable Filtration Systems Company Profiles
- Romania Portable Filtration Systems Key Strategic Recommendations
Romania Portable Filtration Systems Market (2026-2032): FAQs
6Wresearch actively monitors the Romania Portable Filtration Systems Market and publishes its comprehensive annual report, highlighting emerging trends, growth drivers, revenue analysis, and forecast outlook. Our insights help businesses to make data-backed strategic decisions with ongoing market dynamics. Our analysts track relevent industries related to the Romania Portable Filtration Systems Market, allowing our clients with actionable intelligence and reliable forecasts tailored to emerging regional needs.
Yes, we provide customisation as per your requirements. To learn more, feel free to contact us on sales@6wresearch.com
1 Executive Summary |
2 Introduction |
2.1 Key Highlights of the Report |
2.2 Report Description |
2.3 Market Scope & Segmentation |
2.4 Research Methodology |
2.5 Assumptions |
3 Romania Portable Filtration Systems Market Overview |
3.1 Romania Country Macro Economic Indicators |
3.2 Romania Portable Filtration Systems Market Revenues & Volume, 2022 & 2032F |
3.3 Romania Portable Filtration Systems Market - Industry Life Cycle |
3.4 Romania Portable Filtration Systems Market - Porter's Five Forces |
3.5 Romania Portable Filtration Systems Market Revenues & Volume Share, By End-User, 2022 & 2032F |
3.6 Romania Portable Filtration Systems Market Revenues & Volume Share, By Flow Rate, 2022 & 2032F |
3.7 Romania Portable Filtration Systems Market Revenues & Volume Share, By Technology, 2022 & 2032F |
4 Romania Portable Filtration Systems Market Dynamics |
4.1 Impact Analysis |
4.2 Market Drivers |
4.2.1 Increasing awareness about the importance of clean water and its impact on health |
4.2.2 Growing demand for portable filtration systems due to frequent water quality issues |
4.2.3 Rise in outdoor recreational activities boosting the need for portable filtration systems |
4.3 Market Restraints |
4.3.1 High initial cost of portable filtration systems |
4.3.2 Limited access to clean water sources hindering market penetration |
4.3.3 Lack of infrastructure for proper disposal of filter cartridges |
5 Romania Portable Filtration Systems Market Trends |
6 Romania Portable Filtration Systems Market, By Types |
6.1 Romania Portable Filtration Systems Market, By End-User |
6.1.1 Overview and Analysis |
6.1.2 Romania Portable Filtration Systems Market Revenues & Volume, By End-User, 2022-2032F |
6.1.3 Romania Portable Filtration Systems Market Revenues & Volume, By Power Generation, 2022-2032F |
6.1.4 Romania Portable Filtration Systems Market Revenues & Volume, By Manufacturing, 2022-2032F |
6.1.5 Romania Portable Filtration Systems Market Revenues & Volume, By Oil & Gas, 2022-2032F |
6.2 Romania Portable Filtration Systems Market, By Flow Rate |
6.2.1 Overview and Analysis |
6.2.2 Romania Portable Filtration Systems Market Revenues & Volume, By 0??10, 2022-2032F |
6.2.3 Romania Portable Filtration Systems Market Revenues & Volume, By >10??20, 2022-2032F |
6.2.4 Romania Portable Filtration Systems Market Revenues & Volume, By >20??60, 2022-2032F |
6.2.5 Romania Portable Filtration Systems Market Revenues & Volume, By >60??100, 2022-2032F |
6.2.6 Romania Portable Filtration Systems Market Revenues & Volume, By Above 100 GPM, 2022-2032F |
6.3 Romania Portable Filtration Systems Market, By Technology |
6.3.1 Overview and Analysis |
6.3.2 Romania Portable Filtration Systems Market Revenues & Volume, By Pressure, 2022-2032F |
6.3.3 Romania Portable Filtration Systems Market Revenues & Volume, By Centrifugal, 2022-2032F |
6.3.4 Romania Portable Filtration Systems Market Revenues & Volume, By Vacuum Filtration, 2022-2032F |
7 Romania Portable Filtration Systems Market Import-Export Trade Statistics |
7.1 Romania Portable Filtration Systems Market Export to Major Countries |
7.2 Romania Portable Filtration Systems Market Imports from Major Countries |
8 Romania Portable Filtration Systems Market Key Performance Indicators |
8.1 Average time taken to purify a specified volume of water |
8.2 Percentage increase in the adoption of portable filtration systems in rural areas |
8.3 Number of partnerships with outdoor activity organizations for promoting portable filtration systems |
9 Romania Portable Filtration Systems Market - Opportunity Assessment |
9.1 Romania Portable Filtration Systems Market Opportunity Assessment, By End-User, 2022 & 2032F |
9.2 Romania Portable Filtration Systems Market Opportunity Assessment, By Flow Rate, 2022 & 2032F |
9.3 Romania Portable Filtration Systems Market Opportunity Assessment, By Technology, 2022 & 2032F |
10 Romania Portable Filtration Systems Market - Competitive Landscape |
10.1 Romania Portable Filtration Systems Market Revenue Share, By Companies, 2025 |
10.2 Romania Portable Filtration Systems Market Competitive Benchmarking, By Operating and Technical Parameters |
11 Company Profiles |
12 Recommendations |
13 Disclaimer |
Global Go To Market Strategy - 2030
Export potential enables firms to identify high-growth global markets with greater confidence by combining advanced trade intelligence with a structured quantitative methodology. The framework analyzes emerging demand trends and country-level import patterns while integrating macroeconomic and trade datasets such as GDP and population forecasts, bilateral import–export flows, tariff structures, elasticity differentials between developed and developing economies, geographic distance, and import demand projections. Using weighted trade values from 2020–2024 as the base period to project country-to-country export potential for 2030, these inputs are operationalized through calculated drivers such as gravity model parameters, tariff impact factors, and projected GDP per-capita growth. Through an analysis of hidden potentials, demand hotspots, and market conditions that are most favorable to success, this method enables firms to focus on target countries, maximize returns, and global expansion with data, backed by accuracy.
By factoring in the projected importer demand gap that is currently unmet and could be potential opportunity, it identifies the potential for the Exporter (Country) among 190 countries, against the general trade analysis, which identifies the biggest importer or exporter.
To discover high-growth global markets and optimize your business strategy:
Click Here
Pricing
- Single User License$ 1,995
- Department License$ 2,400
- Site License$ 3,120
- Global License$ 3,795

Leadership Perspectives from Industry Events
Search
Thought Leadership and Analyst Meet


Our Clients
6WResearch In News
- India Export Attractiveness Tracker 2026
- India Air Conditioner Market Set for Strong Rebound in 2026 After Weather-Led Correction and GST-Driven Recovery: 6Wresearch
- ADAS in India: How Automatic Emergency Braking, Blind Spot Detection & Driver Monitoring are Transforming Road Safety
- Doha a strategic location for EV manufacturing hub: IPA Qatar
- Demand for luxury TVs surging in the GCC, says Samsung
- Empowering Growth: The Thriving Journey of Bangladesh’s Cable Industry
Latest Reports
- Nicaragua RPG Gaming Market (2026-2032)
- New Zealand RPG Gaming Market (2026-2032)
- Netherlands RPG Gaming Market (2026-2032)
- Nauru RPG Gaming Market (2026-2032)
- Namibia RPG Gaming Market (2026-2032)
- Mozambique RPG Gaming Market (2026-2032)
- Montenegro RPG Gaming Market (2026-2032)
- Mongolia RPG Gaming Market (2026-2032)
- Monaco RPG Gaming Market (2026-2032)
- Micronesia RPG Gaming Market (2026-2032)
Industry Events and Analyst Meet

EV India Expo 2026

HIMTEX 2026

India Refining Summit 2026

India EV Show 2026

EV tech India Expo 2026
Whitepaper
- Middle East & Africa Commercial Security Market Click here to view more.
- Middle East & Africa Fire Safety Systems & Equipment Market Click here to view more.
- GCC Drone Market Click here to view more.
- Middle East Lighting Fixture Market Click here to view more.
- GCC Physical & Perimeter Security Market Click here to view more.