Saudi Arabia Non Alcoholic Beverages Market (2026-2032) Outlook | Companies, Trends, Revenue, Size, Forecast, Share, Value, Industry, Analysis & Growth
Market Forecast By Type (Alcoholic Beverages, Non-Alcoholic Beverages, Bottled Water, Carbonated Soft Drinks, Fruit Juice, Milk), By Packaging Type (Cartons, Cans, Bottles, Others), By Distribution Channel (Online, Offline, Supermarkets, Departmental Stores, Specialty Stores) And Competitive Landscape
| Product Code: ETC189111 | Publication Date: May 2022 | Updated Date: Mar 2026 | Product Type: Market Research Report | |
| Publisher: 6Wresearch | Author: Ravi Bhandari | No. of Pages: 60 | No. of Figures: 40 | No. of Tables: 7 |
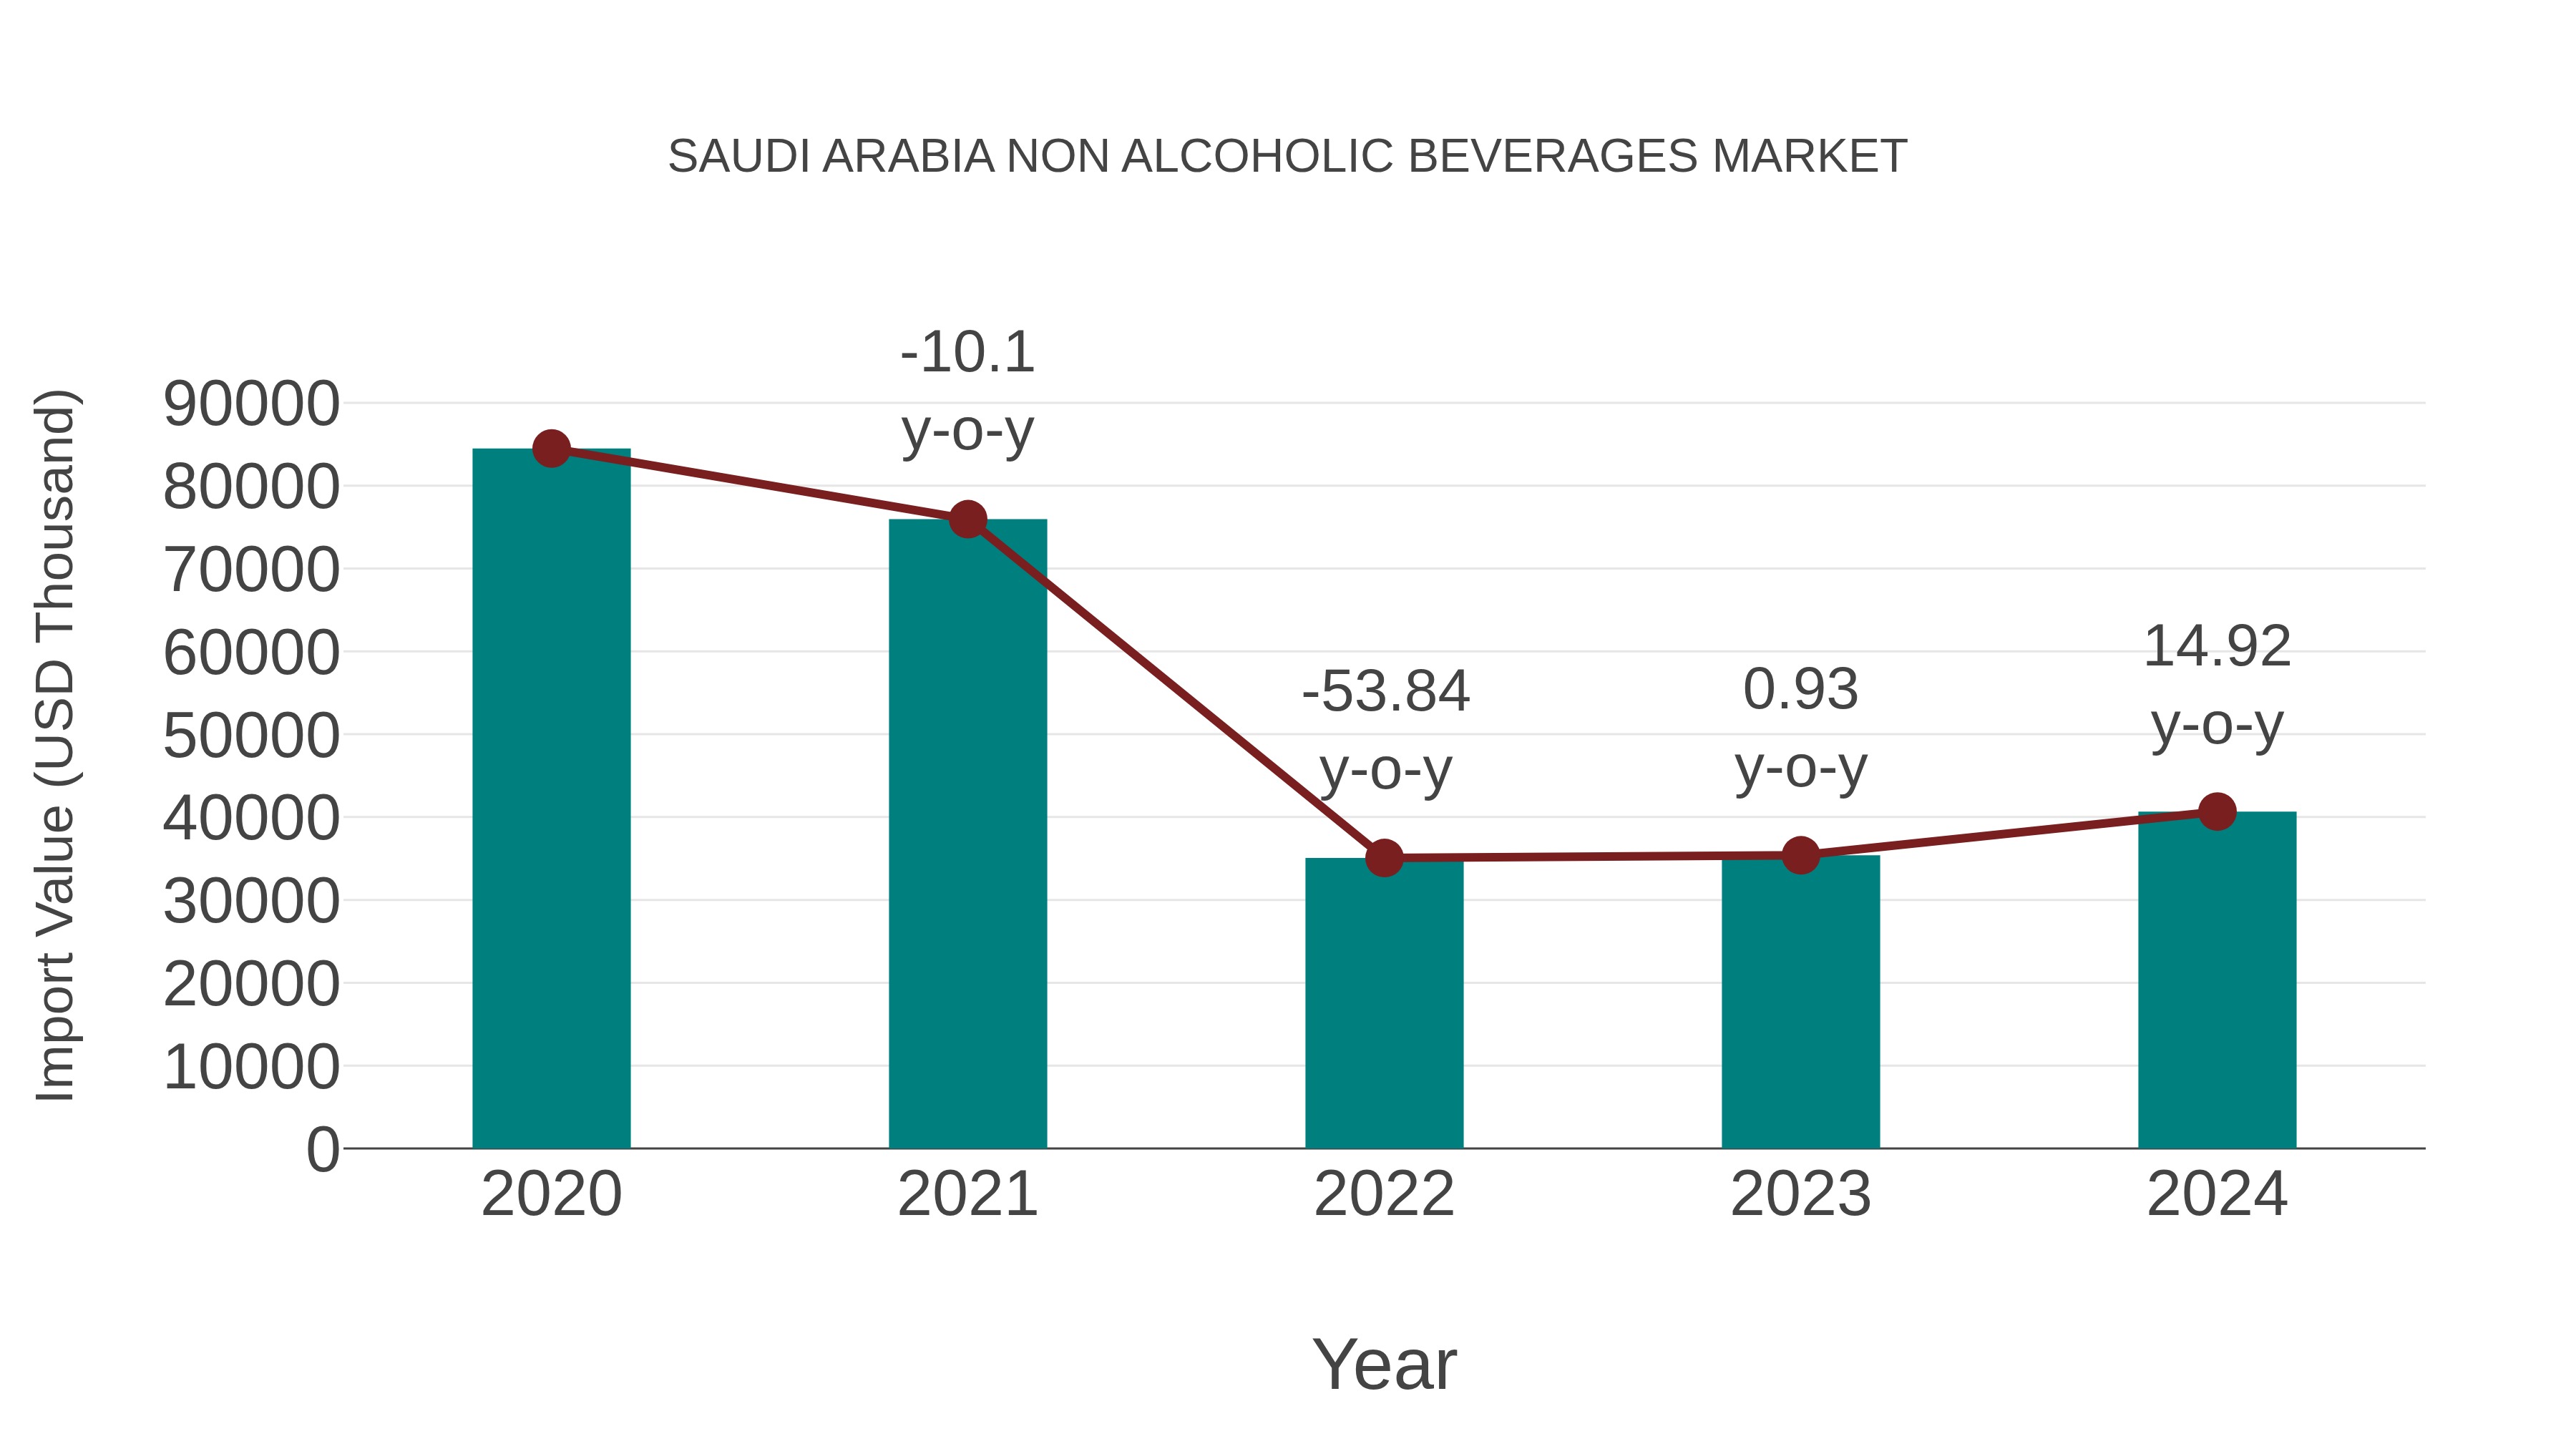
Saudi Arabia Non Alcoholic Beverages Market: Import Trend Analysis
In the Saudi Arabia non-alcoholic beverages market, the import trend showed notable fluctuations. From 2023 to 2024, there was a significant growth rate of 14.92%, contrasting with a negative Compound Annual Growth Rate (CAGR) of -16.71% from 2020 to 2024. This divergence could be attributed to shifting consumer preferences or changes in trade policies impacting market dynamics.
Saudi Arabia Non Alcoholic Beverages Market Synopsis
The non-alcoholic beverages market in Saudi Arabia offers a diverse range of refreshing drinks, including carbonated soft drinks, fruit juices, and flavored waters.As consumer preferences shift toward healthier and non-alcoholic beverage options, this market is expected to see continued expansion, offering a variety of beverages to cater to different tastes and preferences.
Drivers of the Market
The Saudi Arabia non-alcoholic beverages market is anticipated to experience growth due to the demand for refreshing and healthful drink options.Non-alcoholic beverages encompass a wide range of products from juices to functional drinks.The nation`s focus on well-being, the demand for hydration and flavor variety, and the incorporation of non-alcoholic beverages in social gatherings and dining experiences will drive the demand for these products.Additionally, the availability of innovative beverage formulations and the growth of health-conscious consumer preferences will further support market expansion.
Challenges of the Market
The Saudi Arabia non-alcoholic beverages market faces challenges related to health consciousness, sugar content, and market competition.Market players must address consumer concerns about sugar content and offer healthier beverage options, such as low-sugar and sugar-free alternatives.Additionally, educating consumers about the nutritional benefits of non-alcoholic beverages and their role in a balanced diet is crucial.Moreover, competition from alcoholic beverages, water, and imported non-alcoholic brands adds complexity to the market dynamics.The need for product reformulation, health-oriented marketing, and consumer education on beverage choices poses challenges for the industry.
COVID-19 Impact on the Market
The non-alcoholic beverages market in Saudi Arabia remained resilient during the COVID-19 pandemic, with consumers turning to a variety of non-alcoholic options for hydration and enjoyment.Soft drinks, juices, and health-focused beverages maintained their popularity.As consumer demand for diverse and health-conscious beverage choices continued post-pandemic, the market for non-alcoholic beverages sustained its growth.The pandemic emphasized the importance of hydration and wellness.
Key Players in the Market
In the Saudi Arabia non-alcoholic beverages market, companies like Almarai, PepsiCo, and The Coca-Cola Company are dominant.They produce a diverse range of non-alcoholic beverages, including soft drinks, juices, and bottled water.
Key Highlights of the Report:
- Saudi Arabia Non Alcoholic Beverages Market Outlook
- Market Size of Saudi Arabia Non Alcoholic Beverages Market, 2025
- Forecast of Saudi Arabia Non Alcoholic Beverages Market, 2032
- Historical Data and Forecast of Saudi Arabia Non Alcoholic Beverages Revenues & Volume for the Period 2022-2032F
- Saudi Arabia Non Alcoholic Beverages Market Trend Evolution
- Saudi Arabia Non Alcoholic Beverages Market Drivers and Challenges
- Saudi Arabia Non Alcoholic Beverages Price Trends
- Saudi Arabia Non Alcoholic Beverages Porter's Five Forces
- Saudi Arabia Non Alcoholic Beverages Industry Life Cycle
- Historical Data and Forecast of Saudi Arabia Non Alcoholic Beverages Market Revenues & Volume By Type for the Period 2022-2032F
- Historical Data and Forecast of Saudi Arabia Non Alcoholic Beverages Market Revenues & Volume By Alcoholic Beverages for the Period 2022-2032F
- Historical Data and Forecast of Saudi Arabia Non Alcoholic Beverages Market Revenues & Volume By Non-Alcoholic Beverages for the Period 2022-2032F
- Historical Data and Forecast of Saudi Arabia Non Alcoholic Beverages Market Revenues & Volume By Bottled Water for the Period 2022-2032F
- Historical Data and Forecast of Saudi Arabia Non Alcoholic Beverages Market Revenues & Volume By Carbonated Soft Drinks for the Period 2022-2032F
- Historical Data and Forecast of Saudi Arabia Non Alcoholic Beverages Market Revenues & Volume By Fruit Juice for the Period 2022-2032F
- Historical Data and Forecast of Saudi Arabia Non Alcoholic Beverages Market Revenues & Volume By Milk for the Period 2022-2032F
- Historical Data and Forecast of Saudi Arabia Non Alcoholic Beverages Market Revenues & Volume By Packaging Type for the Period 2022-2032F
- Historical Data and Forecast of Saudi Arabia Non Alcoholic Beverages Market Revenues & Volume By Cartons for the Period 2022-2032F
- Historical Data and Forecast of Saudi Arabia Non Alcoholic Beverages Market Revenues & Volume By Cans for the Period 2022-2032F
- Historical Data and Forecast of Saudi Arabia Non Alcoholic Beverages Market Revenues & Volume By Bottles for the Period 2022-2032F
- Historical Data and Forecast of Saudi Arabia Non Alcoholic Beverages Market Revenues & Volume By Others for the Period 2022-2032F
- Historical Data and Forecast of Saudi Arabia Non Alcoholic Beverages Market Revenues & Volume By Distribution Channel for the Period 2022-2032F
- Historical Data and Forecast of Saudi Arabia Non Alcoholic Beverages Market Revenues & Volume By Online for the Period 2022-2032F
- Historical Data and Forecast of Saudi Arabia Non Alcoholic Beverages Market Revenues & Volume By Offline for the Period 2022-2032F
- Historical Data and Forecast of Saudi Arabia Non Alcoholic Beverages Market Revenues & Volume By Supermarkets for the Period 2022-2032F
- Historical Data and Forecast of Saudi Arabia Non Alcoholic Beverages Market Revenues & Volume By Departmental Stores for the Period 2022-2032F
- Historical Data and Forecast of Saudi Arabia Non Alcoholic Beverages Market Revenues & Volume By Specialty Stores for the Period 2022-2032F
- Saudi Arabia Non Alcoholic Beverages Import Export Trade Statistics
- Market Opportunity Assessment By Type
- Market Opportunity Assessment By Packaging Type
- Market Opportunity Assessment By Distribution Channel
- Saudi Arabia Non Alcoholic Beverages Top Companies Market Share
- Saudi Arabia Non Alcoholic Beverages Competitive Benchmarking By Technical and Operational Parameters
- Saudi Arabia Non Alcoholic Beverages Company Profiles
- Saudi Arabia Non Alcoholic Beverages Key Strategic Recommendations
Saudi Arabia Non Alcoholic Beverages Market (2026-2032): FAQs
6Wresearch actively monitors the Saudi Arabia Non Alcoholic Beverages Market and publishes its comprehensive annual report, highlighting emerging trends, growth drivers, revenue analysis, and forecast outlook. Our insights help businesses to make data-backed strategic decisions with ongoing market dynamics. Our analysts track relevent industries related to the Saudi Arabia Non Alcoholic Beverages Market, allowing our clients with actionable intelligence and reliable forecasts tailored to emerging regional needs.
Yes, we provide customisation as per your requirements. To learn more, feel free to contact us on sales@6wresearch.com
1 Executive Summary |
2 Introduction |
2.1 Key Highlights of the Report |
2.2 Report Description |
2.3 Market Scope & Segmentation |
2.4 Research Methodology |
2.5 Assumptions |
3 Saudi Arabia Non Alcoholic Beverages Market Overview |
3.1 Saudi Arabia Country Macro Economic Indicators |
3.2 Saudi Arabia Non Alcoholic Beverages Market Revenues & Volume, 2022 & 2032F |
3.3 Saudi Arabia Non Alcoholic Beverages Market - Industry Life Cycle |
3.4 Saudi Arabia Non Alcoholic Beverages Market - Porter's Five Forces |
3.5 Saudi Arabia Non Alcoholic Beverages Market Revenues & Volume Share, By Type, 2022 & 2032F |
3.6 Saudi Arabia Non Alcoholic Beverages Market Revenues & Volume Share, By Packaging Type, 2022 & 2032F |
3.7 Saudi Arabia Non Alcoholic Beverages Market Revenues & Volume Share, By Distribution Channel, 2022 & 2032F |
4 Saudi Arabia Non Alcoholic Beverages Market Dynamics |
4.1 Impact Analysis |
4.2 Market Drivers |
4.2.1 Increasing health consciousness and awareness among consumers. |
4.2.2 Growth in disposable income leading to higher spending on premium non-alcoholic beverages. |
4.2.3 Growing preference for functional and wellness beverages. |
4.2.4 Expansion of distribution channels and retail infrastructure. |
4.2.5 Rising tourism industry boosting demand for non-alcoholic beverages. |
4.3 Market Restraints |
4.3.1 Stringent regulations and taxes on sugar content in beverages. |
4.3.2 Seasonal fluctuations affecting demand for certain types of non-alcoholic beverages. |
4.3.3 Intense competition among beverage manufacturers. |
4.3.4 Fluctuating raw material prices impacting production costs. |
4.3.5 Consumer shift towards healthier alternatives like natural juices and flavored water. |
5 Saudi Arabia Non Alcoholic Beverages Market Trends |
6 Saudi Arabia Non Alcoholic Beverages Market, By Types |
6.1 Saudi Arabia Non Alcoholic Beverages Market, By Type |
6.1.1 Overview and Analysis |
6.1.2 Saudi Arabia Non Alcoholic Beverages Market Revenues & Volume, By Type, 2022-2032F |
6.1.3 Saudi Arabia Non Alcoholic Beverages Market Revenues & Volume, By Alcoholic Beverages, 2022-2032F |
6.1.4 Saudi Arabia Non Alcoholic Beverages Market Revenues & Volume, By Non-Alcoholic Beverages, 2022-2032F |
6.1.5 Saudi Arabia Non Alcoholic Beverages Market Revenues & Volume, By Bottled Water, 2022-2032F |
6.1.6 Saudi Arabia Non Alcoholic Beverages Market Revenues & Volume, By Carbonated Soft Drinks, 2022-2032F |
6.1.7 Saudi Arabia Non Alcoholic Beverages Market Revenues & Volume, By Fruit Juice, 2022-2032F |
6.1.8 Saudi Arabia Non Alcoholic Beverages Market Revenues & Volume, By Milk, 2022-2032F |
6.2 Saudi Arabia Non Alcoholic Beverages Market, By Packaging Type |
6.2.1 Overview and Analysis |
6.2.2 Saudi Arabia Non Alcoholic Beverages Market Revenues & Volume, By Cartons, 2022-2032F |
6.2.3 Saudi Arabia Non Alcoholic Beverages Market Revenues & Volume, By Cans, 2022-2032F |
6.2.4 Saudi Arabia Non Alcoholic Beverages Market Revenues & Volume, By Bottles, 2022-2032F |
6.2.5 Saudi Arabia Non Alcoholic Beverages Market Revenues & Volume, By Others, 2022-2032F |
6.3 Saudi Arabia Non Alcoholic Beverages Market, By Distribution Channel |
6.3.1 Overview and Analysis |
6.3.2 Saudi Arabia Non Alcoholic Beverages Market Revenues & Volume, By Online, 2022-2032F |
6.3.3 Saudi Arabia Non Alcoholic Beverages Market Revenues & Volume, By Offline, 2022-2032F |
6.3.4 Saudi Arabia Non Alcoholic Beverages Market Revenues & Volume, By Supermarkets, 2022-2032F |
6.3.5 Saudi Arabia Non Alcoholic Beverages Market Revenues & Volume, By Departmental Stores, 2022-2032F |
6.3.6 Saudi Arabia Non Alcoholic Beverages Market Revenues & Volume, By Specialty Stores, 2022-2032F |
7 Saudi Arabia Non Alcoholic Beverages Market Import-Export Trade Statistics |
7.1 Saudi Arabia Non Alcoholic Beverages Market Export to Major Countries |
7.2 Saudi Arabia Non Alcoholic Beverages Market Imports from Major Countries |
8 Saudi Arabia Non Alcoholic Beverages Market Key Performance Indicators |
8.1 Consumer engagement metrics such as social media followers, website traffic, and engagement rates. |
8.2 Market penetration rate in different regions of Saudi Arabia. |
8.3 Number of new product launches and innovations in the non-alcoholic beverages segment. |
8.4 Customer satisfaction levels and feedback ratings. |
8.5 Sustainability practices and environmental impact metrics. |
9 Saudi Arabia Non Alcoholic Beverages Market - Opportunity Assessment |
9.1 Saudi Arabia Non Alcoholic Beverages Market Opportunity Assessment, By Type, 2022 & 2032F |
9.2 Saudi Arabia Non Alcoholic Beverages Market Opportunity Assessment, By Packaging Type, 2022 & 2032F |
9.3 Saudi Arabia Non Alcoholic Beverages Market Opportunity Assessment, By Distribution Channel, 2022 & 2032F |
10 Saudi Arabia Non Alcoholic Beverages Market - Competitive Landscape |
10.1 Saudi Arabia Non Alcoholic Beverages Market Revenue Share, By Companies, 2025 |
10.2 Saudi Arabia Non Alcoholic Beverages Market Competitive Benchmarking, By Operating and Technical Parameters |
11 Company Profiles |
12 Recommendations |
13 Disclaimer |
Global Go To Market Strategy - 2030
Export potential enables firms to identify high-growth global markets with greater confidence by combining advanced trade intelligence with a structured quantitative methodology. The framework analyzes emerging demand trends and country-level import patterns while integrating macroeconomic and trade datasets such as GDP and population forecasts, bilateral import–export flows, tariff structures, elasticity differentials between developed and developing economies, geographic distance, and import demand projections. Using weighted trade values from 2020–2024 as the base period to project country-to-country export potential for 2030, these inputs are operationalized through calculated drivers such as gravity model parameters, tariff impact factors, and projected GDP per-capita growth. Through an analysis of hidden potentials, demand hotspots, and market conditions that are most favorable to success, this method enables firms to focus on target countries, maximize returns, and global expansion with data, backed by accuracy.
By factoring in the projected importer demand gap that is currently unmet and could be potential opportunity, it identifies the potential for the Exporter (Country) among 190 countries, against the general trade analysis, which identifies the biggest importer or exporter.
To discover high-growth global markets and optimize your business strategy:
Click Here
Pricing
- Single User License$ 1,995
- Department License$ 2,400
- Site License$ 3,120
- Global License$ 3,795

Leadership Perspectives from Industry Events
Search
Thought Leadership and Analyst Meet


Our Clients
6WResearch In News
- India Air Conditioner Market Set for Strong Rebound in 2026 After Weather-Led Correction and GST-Driven Recovery: 6Wresearch
- ADAS in India: How Automatic Emergency Braking, Blind Spot Detection & Driver Monitoring are Transforming Road Safety
- Doha a strategic location for EV manufacturing hub: IPA Qatar
- Demand for luxury TVs surging in the GCC, says Samsung
- Empowering Growth: The Thriving Journey of Bangladesh’s Cable Industry
- Demand for luxury TVs surging in the GCC, says Samsung
Latest Reports
- Nicaragua RPG Gaming Market (2026-2032)
- New Zealand RPG Gaming Market (2026-2032)
- Netherlands RPG Gaming Market (2026-2032)
- Nauru RPG Gaming Market (2026-2032)
- Namibia RPG Gaming Market (2026-2032)
- Mozambique RPG Gaming Market (2026-2032)
- Montenegro RPG Gaming Market (2026-2032)
- Mongolia RPG Gaming Market (2026-2032)
- Monaco RPG Gaming Market (2026-2032)
- Micronesia RPG Gaming Market (2026-2032)
Industry Events and Analyst Meet

EV India Expo 2026

HIMTEX 2026

India Refining Summit 2026

India EV Show 2026

EV tech India Expo 2026
Whitepaper
- Middle East & Africa Commercial Security Market Click here to view more.
- Middle East & Africa Fire Safety Systems & Equipment Market Click here to view more.
- GCC Drone Market Click here to view more.
- Middle East Lighting Fixture Market Click here to view more.
- GCC Physical & Perimeter Security Market Click here to view more.