Sierra Leone Data Center Market (2026-2032) | Value, Companies, Trends, Share, Growth, Forecast, Size, Analysis, Revenue, Outlook, Segmentation & Industry
Market Forecast By Component (Electrical, Mechanical, Networking, Racks, Security Systems, Fire Systems), By Vertical (Banking Financial Services & Insurance (BFSI), Government, IT & Telecom, Media, Retail, Manufacturing, Others) And Competitive Landscape
| Product Code: ETC5508808 | Publication Date: Nov 2023 | Updated Date: May 2026 | Product Type: Market Research Report | |
| Publisher: 6Wresearch | Author: Ravi Bhandari | No. of Pages: 60 | No. of Figures: 30 | No. of Tables: 5 |
Sierra Leone Data Center Market Growth Rate
According to 6Wresearch internal database and industry insights, the Sierra Leone Data Center Market is projected to grow at a compound annual growth rate (CAGR) of 7.5% during the forecast period (2026-2032).
Sierra Leone Data Center Market Year-wise Growth Rate and Key Drivers
This graph highlights how the Sierra Leone Data Center Market has steadily grown over the past five years, supported by major growth factors.
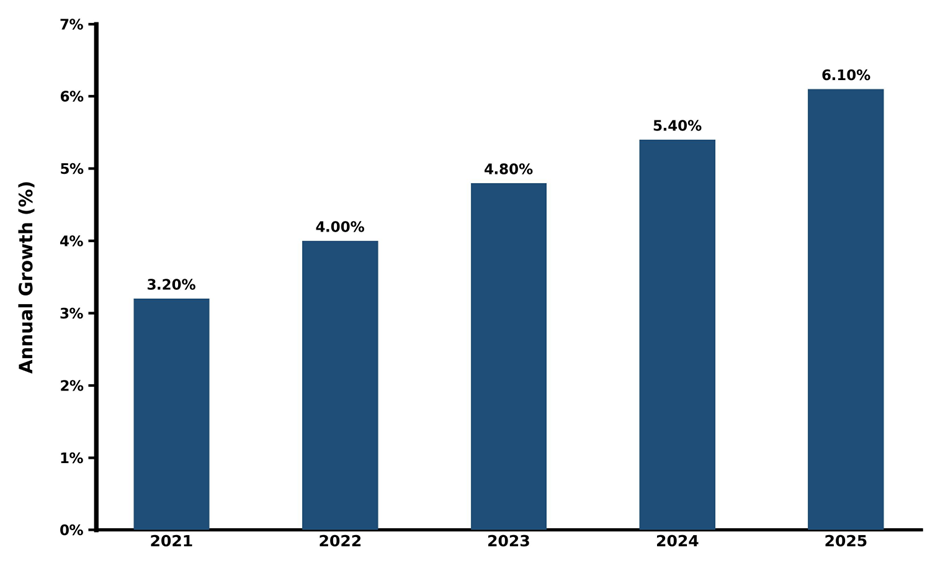
The table below presents the year‑wise growth rates along with the key drivers influencing the market
| Year | Est. Annual Growth (%) | Growth Drivers |
| 2021 | 3.2% | Increasing demand for cloud services and digitalization |
| 2022 | 4% | Expansion of IT and telecom infrastructure |
| 2023 | 4.8% | Rising demand for data storage and hosting services |
| 2024 | 5.4% | Government initiatives supporting digital transformation |
| 2025 | 6.1% | Growth in e-commerce and fintech sectors |
Topics Covered in the Sierra Leone Data Center Market Report
The Sierra Leone Data Center Market report thoroughly covers the market by Component and Vertical. The market report provides an unbiased and detailed analysis of ongoing market trends, opportunities/high growth areas, and market drivers, which help stakeholders devise and align their market strategies according to the current and future market dynamics.
Sierra Leone Data Center Market Highlights
| Report Name |
Sierra Leone Data Center Market |
| Forecast period | 2026-2032 |
| CAGR | 7.5% |
| Market Size |
IT & Telecom |
Sierra Leone Data Center Market Synopsis
The Sierra Leone Data Center Market will see considerable growth owing to increasing demands for cloud computing services and data storage, as well as advancements in telecommunications infrastructure. The primary factors driving this growth will be increasing digitization efforts, support from governments for technology infrastructure, and use of data-based applications by companies. Moreover, the continued investments made by foreign and local players in data hosting and storage capabilities will be instrumental in propelling growth in this market.
Evaluation of Growth Drivers in the Sierra Leone Data Center Market (2026-2032)
Below mentioned are some prominent drivers and their influence on the market dynamics:
| Drivers | Primary Segments Affected | Why it Matters (Evidence) |
| Digital Transformation Initiatives | Data Hosting, Telecom, IT & Cloud | Government and private sector investments are enhancing digital infrastructure. |
| Increased Cloud Adoption | Cloud Services, Hosting | A surge in cloud computing drives the demand for scalable data centers. |
| Growing Internet Penetration | Telecom, Data Hosting | Higher internet usage drives demand for data processing and storage. |
| Data Sovereignty Regulations | All Types, Government, Telecom | Laws mandating data storage within the country push the demand for local data centers. |
| Expansion of Fintech and E-Commerce | IT, Telecom, Retail, Hosting | Rapid growth in fintech and e-commerce increases data requirements for these sectors |
The Sierra Leone Data Center Market is expected to grow at the CAGR of 7.5% during the forecast period of 2026-2032. Growth in the Sierra Leone Data Center Market is primarily driven by the increasing demand for cloud services, alongside rising internet penetration across the country. Government support in order to develop the digital infrastructure is an essential element here. Furthermore, the expansion of different industries like fintech, ecommerce, and telecommunication increases the demand for better capabilities for storing and processing data. All these elements, together, form a good market prospect for future growth in the industry.
Evaluation of Restraints in the Sierra Leone Data Center Market
Below mentioned are some major restraints and their influence on the market dynamics:
| Restraints | Primary Segments Affected | What This Means (Evidence) |
| High Infrastructure Costs | Data Hosting, Telecom | The capital-intensive nature of setting up data centers limits accessibility. |
| Power Supply Limitations | Mechanical, Electrical, Hosting | Lack of stable electricity hampers data center operations. |
| Skilled Workforce Shortage | All Types, IT | Limited availability of trained professionals hinders the growth of operations. |
| Regulatory Barriers | All Types, Government, Telecom | Complex licensing and compliance processes may delay market entry. |
| Limited Local Data Center Providers | Hosting, Cloud Services, Telecom | The small number of local providers restricts competition and limits service options |
Sierra Leone Data Center Market Challenges
The Sierra Leone Data Center Market Growth is being shaped by significant demand for digital services, yet it faces a series of challenges. Infrastructure expenses continue to pose significant challenges with the requirement for reliable electricity and professionals. In addition, stringent regulations and a lack of data centers locally make it difficult for competitors to compete. Regardless of the existing challenges, developments geared towards enhancing the information infrastructure alongside government support for technological advancement will ensure that growth continues in the industry.
Sierra Leone Data Center Market Trends
Trends that assess the current scenario in the Sierra Leone Data Center Market include:
- Use of Green Data Centers: An increasing trend towards green data centers which use sustainable energy resources to lower carbon emissions.
- Development of Edge Computing: The increasing trend towards developing edge computing solutions that enable better data processing by moving the processing nearer the source.
- Integration of Cloud-Based Solutions: An increasing need for hybrid cloud-based solutions that allow the advantages of both private cloud services as well as public cloud services to be combined.
- Digitization Initiatives by the Government: Initiatives taken by the government regarding the digitization of several sectors including health care, education, governance, etc., resulting in the emergence of modern data centers.
Investment Opportunities in the Sierra Leone Data Center Market
Some prominent investment opportunities in the Sierra Leone Data Center Market include:
- Establishing Cloud Computing Infrastructure: It would be essential to make investments in state-of-the-art high-performing data centers in order to cater to the rising need for cloud computing services. Such data centers would be instrumental in enabling firms to take advantage of cloud computing services.
- Development of Renewable Energy-Fueled Data Centers: One area that offers promise for data centers is renewable energy fueled ones. This would not only ensure low cost operation but also provide environmentally sustainable data centers.
- Telecommunications Expansion: Internet usage has become widespread in Sierra Leone and there is a need to invest in expanding the telecommunications network in the region. An expanded telecommunication network would help in improving the services of data centers.
- E-commerce and Fin-tech Industry Data Center Solutions: E-commerce and fin-tech have emerged as one of the leading industries in Sierra Leone, which has created a huge potential market for data centers that would be used by this industry.
Top 5 Leading Players in the Sierra Leone Data Center Market
Some leading players operating in the Sierra Leone Data Center Market include:
1. Equinix, Inc.
| Company Name | Equinix, Inc. |
|---|---|
| Established Year | 1998 |
| Headquarters | Redwood City, United States |
| Official Website | Click Here |
Equinix operates globally, providing data center services that enable businesses to interconnect and protect critical data assets.
2. Digital Realty
| Company Name | Digital Realty |
|---|---|
| Established Year | 2004 |
| Headquarters | San Francisco, United States |
| Official Website | Click Here |
Digital Realty develops, owns, and operates a global portfolio of data centers to provide scalable and secure digital infrastructure solutions.
3. Africa Data Centres
| Company Name | Africa Data Centres |
|---|---|
| Established Year | 2013 |
| Headquarters | Johannesburg, South Africa |
| Official Website | Click Here |
Africa Data Centres offers secure and scalable data hosting facilities across the African continent, enhancing data security and availability.
4. China Telecom Global
| Company Name | China Telecom Global |
|---|---|
| Established Year | 2000 |
| Headquarters | Beijing, China |
| Official Website | Click Here |
China Telecom Global offers integrated data center solutions and cloud services, contributing to the digital transformation of businesses.
5. Nokia Networks
| Company Name | Nokia Networks |
|---|---|
| Established Year | 1865 |
| Headquarters | Espoo, Finland |
| Official Website | Click Here |
Nokia provides networking infrastructure and data center solutions to support the expansion of digital services across various sectors.
Government Regulations Introduced in the Sierra Leone Data Center Market
According to Sierra Leone Government Data, the government has introduced several key policies to boost the growth of the digital infrastructure market. The National ICT Policy is an example of such strategies, the main objective of this policy includes increasing broadband penetration levels and stimulating investments in data centers. Moreover, working in collaboration with international technology firms will increase infrastructure development as well as data center development. The other strategy includes ensuring that digital literacy is improved, while data sovereignty makes sure that all data created in Sierra Leone is hosted in the country.
Future Insights of the Sierra Leone Data Center Market
Sierra Leone Data Center Industry is projected to have a bright future due to ongoing investments in cloud computing, government-driven digital transformation initiatives, and rising demand from various industries including e-commerce and fintech. Local data center expansion alongside global partnerships will lead to enhanced data hosting capabilities within the area, ultimately boosting the market.
Market Segmentation Analysis
The report offers a comprehensive study of the subsequent market segments and their leading categories:
Electrical to dominate the Market- By Component
According to Sahil, Senior Research Analyst, 6Wresearch, the electrical component is the dominant sector in the Sierra Leone Data Center Market Share, as it ensures a steady and reliable power supply for data centers, supporting critical systems and operations. Efficient power systems, including UPS and backup generators, are crucial for maintaining data center uptime and performance.
IT & Telecom to dominate the Market- By Vertical
The IT & Telecom sector dominates due to the massive growth in data traffic, cloud services, and internet connectivity. Data centers are vital for supporting the rapid expansion of telecom infrastructure, providing the necessary storage, processing, and network capabilities for telecom operators and IT companies.
Key Attractiveness of the Report
- 10 Years of Market Numbers.
- Historical Data Starting from 2022 to 2025.
- Base Year: 2025.
- Forecast Data until 2032.
- Key Performance Indicators Impacting the Market.
- Major Upcoming Developments and Projects.
Key Highlights of the Report:
- Sierra Leone Data Center Market Outlook
- Market Size of Sierra Leone Data Center Market, 2025
- Forecast of Sierra Leone Data Center Market, 2032
- Historical Data and Forecast of Sierra Leone Data Center Revenues & Volume for the Period 2022-2032
- Sierra Leone Data Center Market Trend Evolution
- Sierra Leone Data Center Market Drivers and Challenges
- Sierra Leone Data Center Price Trends
- Sierra Leone Data Center Porter`s Five Forces
- Sierra Leone Data Center Industry Life Cycle
- Historical Data and Forecast of Sierra Leone Data Center Market Revenues & Volume By Component for the Period 2022-2032
- Historical Data and Forecast of Sierra Leone Data Center Market Revenues & Volume By Electrical for the Period 2022-2032
- Historical Data and Forecast of Sierra Leone Data Center Market Revenues & Volume By Mechanical for the Period 2022-2032
- Historical Data and Forecast of Sierra Leone Data Center Market Revenues & Volume By Networking for the Period 2022-2032
- Historical Data and Forecast of Sierra Leone Data Center Market Revenues & Volume By Racks for the Period 2022-2032
- Historical Data and Forecast of Sierra Leone Data Center Market Revenues & Volume By Security Systems for the Period 2022-2032
- Historical Data and Forecast of Sierra Leone Data Center Market Revenues & Volume By Fire Systems for the Period 2022-2032
- Historical Data and Forecast of Sierra Leone Data Center Market Revenues & Volume By Vertical for the Period 2022-2032
- Historical Data and Forecast of Sierra Leone Data Center Market Revenues & Volume By Banking Financial Services & Insurance (BFSI) for the Period 2022-2032
- Historical Data and Forecast of Sierra Leone Data Center Market Revenues & Volume By Government for the Period 2022-2032
- Historical Data and Forecast of Sierra Leone Data Center Market Revenues & Volume By IT & Telecom for the Period 2022-2032
- Historical Data and Forecast of Sierra Leone Data Center Market Revenues & Volume By Media for the Period 2022-2032
- Historical Data and Forecast of Sierra Leone Data Center Market Revenues & Volume By Retail for the Period 2022-2032
- Historical Data and Forecast of Sierra Leone Data Center Market Revenues & Volume By Manufacturing for the Period 2022-2032
- Historical Data and Forecast of Sierra Leone Data Center Market Revenues & Volume By Others for the Period 2022-2032
- Sierra Leone Data Center Import Export Trade Statistics
- Market Opportunity Assessment By Component
- Market Opportunity Assessment By Vertical
- Sierra Leone Data Center Top Companies Market Share
- Sierra Leone Data Center Competitive Benchmarking By Technical and Operational Parameters
- Sierra Leone Data Center Company Profiles
- Sierra Leone Data Center Key Strategic Recommendations
Market Covered
The report offers a comprehensive study of the subsequent market segments:
By Component
- Electrical
- Mechanical
- Networking
- Racks
- Security Systems
- Fire Systems
By Vertical
- Banking Financial Services & Insurance (BFSI)
- Government
- IT & Telecom
- Media
- Retail
- Manufacturing
- Others
Sierra Leone Data Center Market (2026-2032): FAQs
The Sierra Leone Data Center Market is estimated to grow with a CAGR of 7.5% during the forecast period 2026-2032.
Some of the factors driving the growth in this industry are digitization plans and government policies related to technological infrastructure and growing demands from fintech and e-commerce.
Renewable energy has become very important for data centers as it lowers costs and helps sustain future growth.
Sierra Leone Data Center Market is likely to see substantial growth owing to increased digitization, international cooperation, and infrastructure development.
6Wresearch actively monitors the Sierra Leone Data Center Market and publishes its comprehensive annual report, highlighting emerging trends, growth drivers, revenue analysis, and forecast outlook. Our insights help businesses to make data-backed strategic decisions with ongoing market dynamics. Our analysts track relevent industries related to the Sierra Leone Data Center Market, allowing our clients with actionable intelligence and reliable forecasts tailored to emerging regional needs.
Yes, we provide customisation as per your requirements. To learn more, feel free to contact us on sales@6wresearch.com
| 1 Executive Summary |
| 2 Introduction |
| 2.1 Key Highlights of the Report |
| 2.2 Report Description |
| 2.3 Market Scope & Segmentation |
| 2.4 Research Methodology |
| 2.5 Assumptions |
| 3 Sierra Leone Data Center Market Overview |
| 3.1 Sierra Leone Country Macro Economic Indicators |
| 3.2 Sierra Leone Data Center Market Revenues & Volume, 2022 & 2032F |
| 3.3 Sierra Leone Data Center Market - Industry Life Cycle |
| 3.4 Sierra Leone Data Center Market - Porter's Five Forces |
| 3.5 Sierra Leone Data Center Market Revenues & Volume Share, By Component , 2022 & 2032F |
| 3.6 Sierra Leone Data Center Market Revenues & Volume Share, By Vertical , 2022 & 2032F |
| 4 Sierra Leone Data Center Market Dynamics |
| 4.1 Impact Analysis |
| 4.2 Market Drivers |
| 4.2.1 Increasing demand for cloud services and data storage solutions in Sierra Leone |
| 4.2.2 Growing adoption of Internet of Things (IoT) devices and applications in the country |
| 4.2.3 Government initiatives to improve digital infrastructure and connectivity |
| 4.3 Market Restraints |
| 4.3.1 Limited power supply and frequent power outages in Sierra Leone |
| 4.3.2 High initial investment and operational costs for establishing and maintaining data centers in the country |
| 5 Sierra Leone Data Center Market Trends |
| 6 Sierra Leone Data Center Market Segmentations |
| 6.1 Sierra Leone Data Center Market, By Component |
| 6.1.1 Overview and Analysis |
| 6.1.2 Sierra Leone Data Center Market Revenues & Volume, By Electrical, 2022-2032F |
| 6.1.3 Sierra Leone Data Center Market Revenues & Volume, By Mechanical, 2022-2032F |
| 6.1.4 Sierra Leone Data Center Market Revenues & Volume, By Networking, 2022-2032F |
| 6.1.5 Sierra Leone Data Center Market Revenues & Volume, By Racks, 2022-2032F |
| 6.1.6 Sierra Leone Data Center Market Revenues & Volume, By Security Systems, 2022-2032F |
| 6.1.7 Sierra Leone Data Center Market Revenues & Volume, By Fire Systems, 2022-2032F |
| 6.2 Sierra Leone Data Center Market, By Vertical |
| 6.2.1 Overview and Analysis |
| 6.2.2 Sierra Leone Data Center Market Revenues & Volume, By Banking Financial Services & Insurance (BFSI), 2022-2032F |
| 6.2.3 Sierra Leone Data Center Market Revenues & Volume, By Government, 2022-2032F |
| 6.2.4 Sierra Leone Data Center Market Revenues & Volume, By IT & Telecom, 2022-2032F |
| 6.2.5 Sierra Leone Data Center Market Revenues & Volume, By Media, 2022-2032F |
| 6.2.6 Sierra Leone Data Center Market Revenues & Volume, By Retail, 2022-2032F |
| 6.2.7 Sierra Leone Data Center Market Revenues & Volume, By Manufacturing, 2022-2032F |
| 7 Sierra Leone Data Center Market Import-Export Trade Statistics |
| 7.1 Sierra Leone Data Center Market Export to Major Countries |
| 7.2 Sierra Leone Data Center Market Imports from Major Countries |
| 8 Sierra Leone Data Center Market Key Performance Indicators |
| 8.1 Average latency and uptime of data center facilities in Sierra Leone |
| 8.2 Growth rate of data traffic and storage capacity utilization in the market |
| 8.3 Adoption rate of data center virtualization technologies in the country |
| 9 Sierra Leone Data Center Market - Opportunity Assessment |
| 9.1 Sierra Leone Data Center Market Opportunity Assessment, By Component , 2022 & 2032F |
| 9.2 Sierra Leone Data Center Market Opportunity Assessment, By Vertical , 2022 & 2032F |
| 10 Sierra Leone Data Center Market - Competitive Landscape |
| 10.1 Sierra Leone Data Center Market Revenue Share, By Companies, 2025 |
| 10.2 Sierra Leone Data Center Market Competitive Benchmarking, By Operating and Technical Parameters |
| 11 Company Profiles |
| 12 Recommendations |
| 13 Disclaimer |
Global Go To Market Strategy - 2030
Export potential enables firms to identify high-growth global markets with greater confidence by combining advanced trade intelligence with a structured quantitative methodology. The framework analyzes emerging demand trends and country-level import patterns while integrating macroeconomic and trade datasets such as GDP and population forecasts, bilateral import–export flows, tariff structures, elasticity differentials between developed and developing economies, geographic distance, and import demand projections. Using weighted trade values from 2020–2024 as the base period to project country-to-country export potential for 2030, these inputs are operationalized through calculated drivers such as gravity model parameters, tariff impact factors, and projected GDP per-capita growth. Through an analysis of hidden potentials, demand hotspots, and market conditions that are most favorable to success, this method enables firms to focus on target countries, maximize returns, and global expansion with data, backed by accuracy.
By factoring in the projected importer demand gap that is currently unmet and could be potential opportunity, it identifies the potential for the Exporter (Country) among 190 countries, against the general trade analysis, which identifies the biggest importer or exporter.
To discover high-growth global markets and optimize your business strategy:
Click Here
Pricing
- Single User License$ 1,995
- Department License$ 2,400
- Site License$ 3,120
- Global License$ 3,795

Leadership Perspectives from Industry Events
Search
Thought Leadership and Analyst Meet


Our Clients
6WResearch In News
- India Export Attractiveness Tracker 2026
- India Air Conditioner Market Set for Strong Rebound in 2026 After Weather-Led Correction and GST-Driven Recovery: 6Wresearch
- ADAS in India: How Automatic Emergency Braking, Blind Spot Detection & Driver Monitoring are Transforming Road Safety
- Doha a strategic location for EV manufacturing hub: IPA Qatar
- Demand for luxury TVs surging in the GCC, says Samsung
- Empowering Growth: The Thriving Journey of Bangladesh’s Cable Industry
Latest Reports
- Nicaragua RPG Gaming Market (2026-2032)
- New Zealand RPG Gaming Market (2026-2032)
- Netherlands RPG Gaming Market (2026-2032)
- Nauru RPG Gaming Market (2026-2032)
- Namibia RPG Gaming Market (2026-2032)
- Mozambique RPG Gaming Market (2026-2032)
- Montenegro RPG Gaming Market (2026-2032)
- Mongolia RPG Gaming Market (2026-2032)
- Monaco RPG Gaming Market (2026-2032)
- Micronesia RPG Gaming Market (2026-2032)
Industry Events and Analyst Meet

EV India Expo 2026

HIMTEX 2026

India Refining Summit 2026

India EV Show 2026

EV tech India Expo 2026
Whitepaper
- Middle East & Africa Commercial Security Market Click here to view more.
- Middle East & Africa Fire Safety Systems & Equipment Market Click here to view more.
- GCC Drone Market Click here to view more.
- Middle East Lighting Fixture Market Click here to view more.
- GCC Physical & Perimeter Security Market Click here to view more.