Singapore Commercial vehicles Market (2026-2032) | Companies, Industry, Revenue, Forecast, Trends, Analysis, Value, Growth, Size, Outlook & Share
Market Forecast By Product (Light Commercial Vehicles (LCVs), Heavy Trucks, Buses & Coaches), By End-Users (Industrial, Mining & Construction, Logistics, Passenger Transportation, Others) And Competitive Landscape
| Product Code: ETC028007 | Publication Date: Jul 2023 | Updated Date: Jun 2026 | Product Type: Report | |
| Publisher: 6Wresearch | Author: Ravi Bhandari | No. of Pages: 70 | No. of Figures: 35 | No. of Tables: 5 |
Singapore Commercial vehicles Market Summary
The singapore commercial vehicles market was estimated at USD 416 Million in 2025 and is projected to reach USD 552 Million by 2032, growing at a CAGR of 4.9% from 2026 to 2032.
Singapore Commercial vehicles Market Year-wise Growth Rate and Key Drivers
This graph highlights how the Singapore Commercial vehicles Market has steadily grown over the past five years, supported by major growth factors.
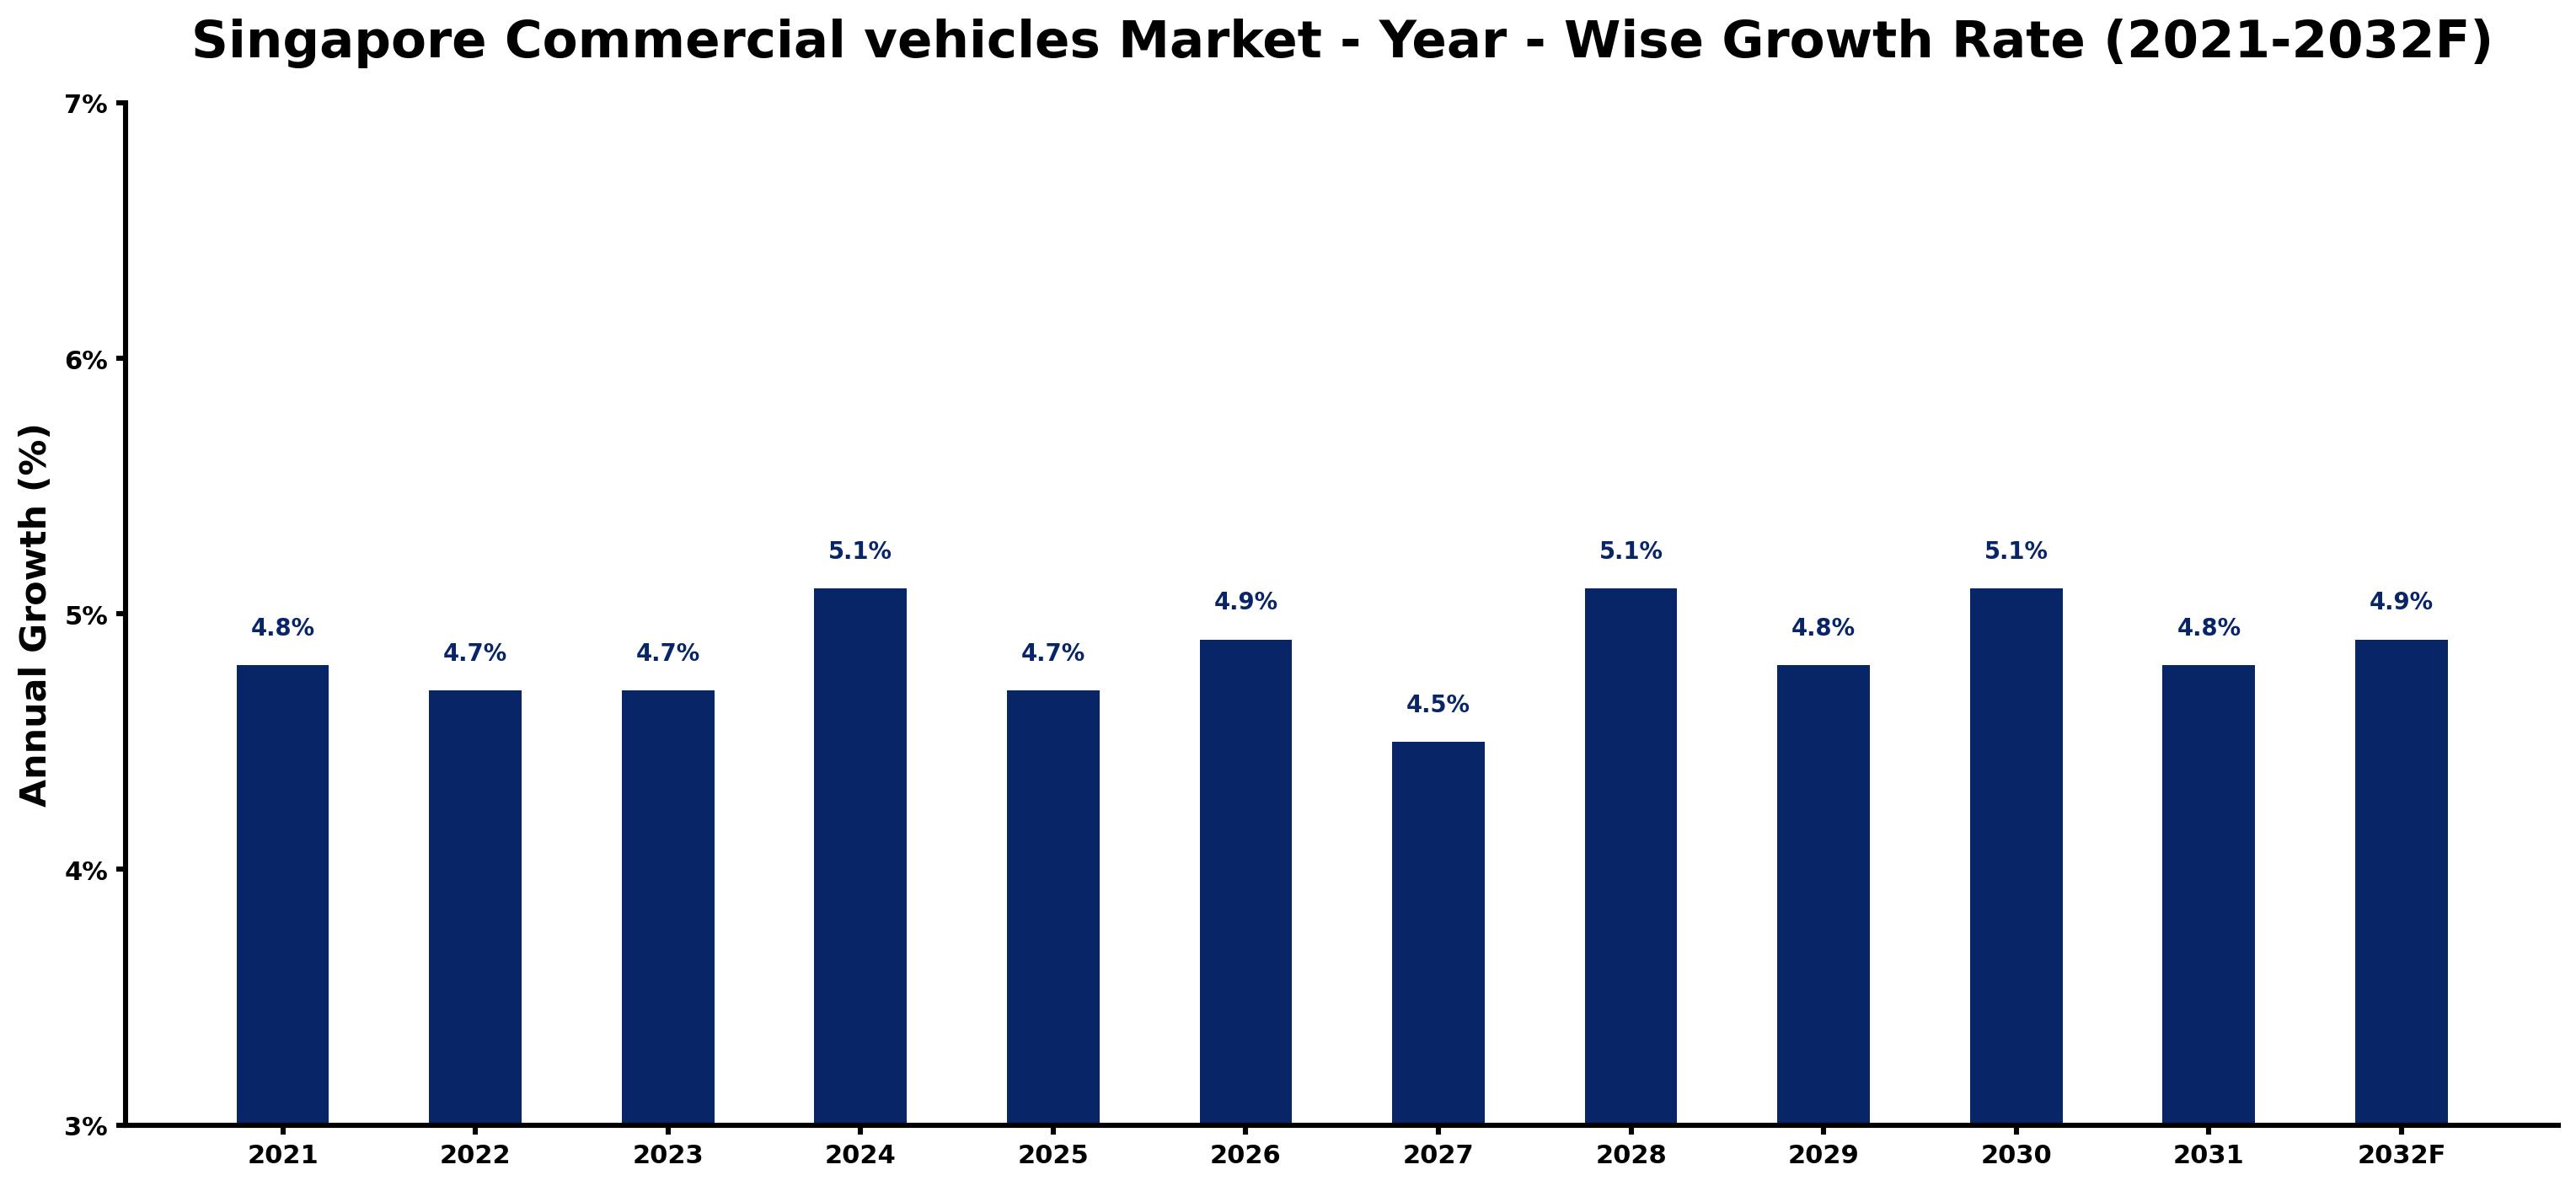
The table below presents the year wise growth rates along with the key drivers influencing the market
| Year | Growth Rate | Major Drivers |
| 2021 | 4.8% | Post-lockdown retail projects sparked increased logistics activities across urban regions. |
| 2022 | 4.7% | Emerging startups in e-commerce influenced demand for delivery and distribution vehicles. |
| 2023 | 4.7% | Fleet management innovations prompted businesses to upgrade their vehicle technologies. |
| 2024 | 5.1% | Infrastructure improvements encouraged higher investments in commercial transport solutions. |
| 2025 | 4.7% | Urbanization trends intensified, leading to a greater need for efficient transportation solutions. |
| 2026 | 4.9% | Sustainability goals prompted fleets to consider electric and hybrid vehicle options. |
| 2027 | 4.5% | Rising operational costs pushed companies to explore more fuel-efficient vehicle models. |
| 2028 | 5.1% | Technological integration in logistics optimized fleet usage and reduced downtime significantly. |
| 2029 | 4.8% | Corporate commitments to sustainability created a robust secondary market for electric vehicles. |
| 2030 | 5.1% | New supply chain models emerged, emphasizing local sourcing and efficient fleet management. |
| 2031 | 4.8% | Collaboration with tech firms drove innovations in smart vehicle applications within fleets. |
| 2032 | 4.9% | Market consolidation trends led to fewer but larger players dominating the commercial vehicle landscape. |
Note - Market size estimations and growth projections presented in this report are based on 6Wresearch's advanced forecasting approach, validated with industry datasets as of June 2026.
Singapore Commercial vehicles Market Synopsis
The Singapore Commercial vehicles Market is projected to reach 4.9% and witness significant growth during the forecast period (2026-2032). This anticipated expansion reflects a confluence of factors driving demand, including heightened freight transport needs, ongoing construction activities, a flourishing tourism sector, and the government's commitment to digital innovation. Additionally, the market's evolution is influenced by investments in infrastructure development, shifting customer preferences favoring high-efficiency vehicles equipped with advanced features, and favorable economic conditions.
Singapore Commercial vehicles Market Growth Drivers
The primary catalysts propelling the Singapore commercial vehicles market include:
- The burgeoning demand for freight transportation, propelled by robust trade and economic activities, necessitates a more extensive commercial vehicle fleet.
- An increase in construction activities, spurred by national infrastructure development plans, requires versatile commercial vehicles to support various construction projects.
- Government initiatives, particularly the Smart Nation 2030 project, are aimed at fostering technological integration and upgrading the transportation landscape, thereby boosting the market.
- Continuous advancements in technology, especially concerning autonomous driving systems and connected vehicle technologies, are enhancing operational efficiencies and safety standards.
- The growing adoption of electric vehicles in commercial transport supports sustainability goals, presenting an opportunity for a cleaner and more efficient vehicle fleet.
Singapore Commercial vehicles Market Challenges and Restraints
Despite promising growth trajectories, the Singapore commercial vehicles market grapples with several challenges:
- The high costs associated with procuring new commercial vehicles often deter fleet operators and small businesses from expanding their operations.
- Stringent regulatory measures aimed at curbing environmental pollution present hurdles for vehicle manufacturers who need to comply with emission standards.
- A pronounced shortage of skilled labor complicates the hiring process for companies seeking to operate modern commercial vehicles, leading to operational inefficiencies.
- The availability of used or second-hand commercial vehicles creates competitive pressure but may compromise service reliability compared to newer models.
- Market volatility stemming from economic fluctuations can influence fleet investment decisions, prompting operators to adopt a cautious approach towards acquiring new vehicles.
Singapore Commercial vehicles Market Government Investment and Initiatives
The Singapore government plays a pivotal role in shaping the landscape of the commercial vehicles market through various initiatives and investments:
- The Smart Nation initiative aims to harness technology to enhance transport infrastructure, resulting in improved efficiency and reduced congestion.
- Investment in public transport infrastructure not only bolsters the commercial vehicle market but also aligns with the government's vision for a sustainable urban environment.
- Incentives for electric vehicle adoption, such as grants and rebates, encourage operators to transition towards greener alternatives, thus promoting environmental sustainability.
- Policies aimed at upgrading vehicle emission standards ensure that the commercial vehicle fleet adheres to stringent environmental guidelines, fostering technological advancements in the sector.
- Public spending on infrastructure projects, including roads and logistics hubs, creates a conducive environment for the commercial vehicle market to thrive.
Singapore Commercial vehicles Market Latest Developments (May 2025 - June 2026)
Recent developments in the Singapore commercial vehicles market illustrate a dynamic industry responding to evolving demands:
- Innovations in electric and hybrid vehicle technologies are gaining traction as manufacturers explore sustainable solutions in response to environmental regulations.
- Legislative measures promoting the use of connected vehicle technologies are being implemented, enhancing vehicle safety and performance monitoring.
- Key stakeholders in the market are increasingly focusing on digital solutions for fleet management, which improve operational efficiency and reduce costs.
- Collaborations between public and private sectors are emerging, aimed at fostering infrastructure advancements that facilitate better freight transport logistics.
- The market has seen a resurgence in demand as economic recovery trends from the Covid-19 pandemic begin to take shape, with operators showing renewed interest in upgrading their fleets.
Singapore Commercial vehicles Market - Key Attractiveness of the Report
- 10 Years of Market Numbers
- Historical Data Starting from 2022 to 2025
- Base Year: 2025
- Forecast Data until 2032
- Key Performance Indicators Impacting the Market
- Major Upcoming Developments and Projects
Key Highlights of the Report:
- Singapore Commercial vehicles Market Outlook
- Market Size of Singapore Commercial vehicles Market, 2025
- Forecast of Singapore Commercial vehicles Market, 2032F
- Historical Data and Forecast of Singapore Commercial vehicles Revenues & Volume for the Period 2022-2032F
- Singapore Commercial vehicles Market Trend Evolution
- Singapore Commercial vehicles Market Drivers and Challenges
- Singapore Commercial vehicles Price Trends
- Singapore Commercial vehicles Porter's Five Forces
- Singapore Commercial vehicles Industry Life Cycle
- Historical Data and Forecast of Singapore Commercial vehicles Market Revenues & Volume By Product for the Period 2022-2032F
- Historical Data and Forecast of Singapore Commercial vehicles Market Revenues & Volume By Light Commercial Vehicles (LCVs) for the Period 2022-2032F
- Historical Data and Forecast of Singapore Commercial vehicles Market Revenues & Volume By Heavy Trucks for the Period 2022-2032F
- Historical Data and Forecast of Singapore Commercial vehicles Market Revenues & Volume By Buses & Coaches for the Period 2022-2032F
- Historical Data and Forecast of Singapore Commercial vehicles Market Revenues & Volume By End-Users for the Period 2022-2032F
- Historical Data and Forecast of Singapore Commercial vehicles Market Revenues & Volume By Industrial for the Period 2022-2032F
- Historical Data and Forecast of Singapore Commercial vehicles Market Revenues & Volume By Mining & Construction for the Period 2022-2032F
- Historical Data and Forecast of Singapore Commercial vehicles Market Revenues & Volume By Logistics for the Period 2022-2032F
- Historical Data and Forecast of Singapore Commercial vehicles Market Revenues & Volume By Passenger Transportation for the Period 2022-2032F
- Historical Data and Forecast of Singapore Commercial vehicles Market Revenues & Volume By Others for the Period 2022-2032F
- Singapore Commercial vehicles Import Export Trade Statistics
- Market Opportunity Assessment By Product
- Market Opportunity Assessment By End-Users
- Singapore Commercial vehicles Top Companies Market Share
- Singapore Commercial vehicles Competitive Benchmarking By Technical and Operational Parameters
- Singapore Commercial vehicles Company Profiles
- Singapore Commercial vehicles Key Strategic Recommendations
Frequently Asked Questions About the Market Study (FAQs):
Key growth drivers include increasing demand for freight transport, rising construction activities, government initiatives, and technological advancements in vehicle efficiency.
Challenges include high vehicle procurement costs, stringent regulations, a shortage of skilled labor, and competition from the used vehicle segment.
The government supports the market through initiatives like Smart Nation 2030, infrastructure investments, and incentives for emissions reduction and electric vehicle adoption.
The pandemic disrupted supply chains globally, affecting vehicle sales and operational capacities; however, recovery trends are beginning to stimulate renewed investment in the market.
6Wresearch actively monitors the Singapore Commercial vehicles Market and publishes its comprehensive annual report, highlighting emerging trends, growth drivers, revenue analysis, and forecast outlook. Our insights help businesses to make data-backed strategic decisions with ongoing market dynamics. Our analysts track relevent industries related to the Singapore Commercial vehicles Market, allowing our clients with actionable intelligence and reliable forecasts tailored to emerging regional needs.
Yes, we provide customisation as per your requirements. To learn more, feel free to contact us on sales@6wresearch.com
1 Executive Summary |
2 Introduction |
2.1 Key Highlights of the Report |
2.2 Report Description |
2.3 Market Scope & Segmentation |
2.4 Research Methodology |
2.5 Assumptions |
3 Singapore Commercial vehicles Market Overview |
3.1 Singapore Country Macro Economic Indicators |
3.2 Singapore Commercial vehicles Market Revenues & Volume, 2022 & 2032F |
3.3 Singapore Commercial vehicles Market - Industry Life Cycle |
3.4 Singapore Commercial vehicles Market - Porter's Five Forces |
3.5 Singapore Commercial vehicles Market Revenues & Volume Share, By Product, 2022 & 2032F |
3.6 Singapore Commercial vehicles Market Revenues & Volume Share, By End-Users, 2022 & 2032F |
4 Singapore Commercial vehicles Market Dynamics |
4.1 Impact Analysis |
4.2 Market Drivers |
4.3 Market Restraints |
5 Singapore Commercial vehicles Market Trends |
6 Singapore Commercial vehicles Market, By Types |
6.1 Singapore Commercial vehicles Market, By Product |
6.1.1 Overview and Analysis |
6.1.2 Singapore Commercial vehicles Market Revenues & Volume, By Product, 2022-2032F |
6.1.3 Singapore Commercial vehicles Market Revenues & Volume, By Light Commercial Vehicles (LCVs), 2022-2032F |
6.1.4 Singapore Commercial vehicles Market Revenues & Volume, By Heavy Trucks, 2022-2032F |
6.1.5 Singapore Commercial vehicles Market Revenues & Volume, By Buses & Coaches, 2022-2032F |
6.2 Singapore Commercial vehicles Market, By End-Users |
6.2.1 Overview and Analysis |
6.2.2 Singapore Commercial vehicles Market Revenues & Volume, By Industrial, 2022-2032F |
6.2.3 Singapore Commercial vehicles Market Revenues & Volume, By Mining & Construction, 2022-2032F |
6.2.4 Singapore Commercial vehicles Market Revenues & Volume, By Logistics, 2022-2032F |
6.2.5 Singapore Commercial vehicles Market Revenues & Volume, By Passenger Transportation, 2022-2032F |
6.2.6 Singapore Commercial vehicles Market Revenues & Volume, By Others, 2022-2032F |
7 Singapore Commercial vehicles Market Import-Export Trade Statistics |
7.1 Singapore Commercial vehicles Market Export to Major Countries |
7.2 Singapore Commercial vehicles Market Imports from Major Countries |
8 Singapore Commercial vehicles Market Key Performance Indicators |
9 Singapore Commercial vehicles Market - Opportunity Assessment |
9.1 Singapore Commercial vehicles Market Opportunity Assessment, By Product, 2022 & 2032F |
9.2 Singapore Commercial vehicles Market Opportunity Assessment, By End-Users, 2022 & 2032F |
10 Singapore Commercial vehicles Market - Competitive Landscape |
10.1 Singapore Commercial vehicles Market Revenue Share, By Companies, 2025 |
10.2 Singapore Commercial vehicles Market Competitive Benchmarking, By Operating and Technical Parameters |
11 Company Profiles |
12 Recommendations |
13 Disclaimer |
Global Go To Market Strategy - 2030
Export potential enables firms to identify high-growth global markets with greater confidence by combining advanced trade intelligence with a structured quantitative methodology. The framework analyzes emerging demand trends and country-level import patterns while integrating macroeconomic and trade datasets such as GDP and population forecasts, bilateral import–export flows, tariff structures, elasticity differentials between developed and developing economies, geographic distance, and import demand projections. Using weighted trade values from 2020–2024 as the base period to project country-to-country export potential for 2030, these inputs are operationalized through calculated drivers such as gravity model parameters, tariff impact factors, and projected GDP per-capita growth. Through an analysis of hidden potentials, demand hotspots, and market conditions that are most favorable to success, this method enables firms to focus on target countries, maximize returns, and global expansion with data, backed by accuracy.
By factoring in the projected importer demand gap that is currently unmet and could be potential opportunity, it identifies the potential for the Exporter (Country) among 190 countries, against the general trade analysis, which identifies the biggest importer or exporter.
To discover high-growth global markets and optimize your business strategy:
Click Here
Pricing
- Single User License$ 1,995
- Department License$ 2,400
- Site License$ 3,120
- Global License$ 3,795

Leadership Perspectives from Industry Events
Search
Thought Leadership and Analyst Meet


Our Clients
6WResearch In News
- India Air Conditioner Market Set for Strong Rebound in 2026 After Weather-Led Correction and GST-Driven Recovery: 6Wresearch
- ADAS in India: How Automatic Emergency Braking, Blind Spot Detection & Driver Monitoring are Transforming Road Safety
- Doha a strategic location for EV manufacturing hub: IPA Qatar
- Demand for luxury TVs surging in the GCC, says Samsung
- Empowering Growth: The Thriving Journey of Bangladesh’s Cable Industry
- Demand for luxury TVs surging in the GCC, says Samsung
Latest Reports
- Nicaragua RPG Gaming Market (2026-2032)
- New Zealand RPG Gaming Market (2026-2032)
- Netherlands RPG Gaming Market (2026-2032)
- Nauru RPG Gaming Market (2026-2032)
- Namibia RPG Gaming Market (2026-2032)
- Mozambique RPG Gaming Market (2026-2032)
- Montenegro RPG Gaming Market (2026-2032)
- Mongolia RPG Gaming Market (2026-2032)
- Monaco RPG Gaming Market (2026-2032)
- Micronesia RPG Gaming Market (2026-2032)
Industry Events and Analyst Meet

EV India Expo 2026

HIMTEX 2026

India Refining Summit 2026

India EV Show 2026

EV tech India Expo 2026
Whitepaper
- Middle East & Africa Commercial Security Market Click here to view more.
- Middle East & Africa Fire Safety Systems & Equipment Market Click here to view more.
- GCC Drone Market Click here to view more.
- Middle East Lighting Fixture Market Click here to view more.
- GCC Physical & Perimeter Security Market Click here to view more.