Singapore Diet Products Market (2026-2032) | Share, Outlook, Size, Analysis, Trends, Growth, Value, Industry, Revenue, Companies, Forecast
Market Forecast By Ingredients (Vitamins, Botanicals, Minerals, Proteins & Amino Acids, Fibers & Specialty Carbohydrates, Omega Fatty Acids, Others), By Forms (Tablets, Capsules, Soft gels, Powders, Gummies, Liquids, Others), By Applications (Energy & Weight Management, General Health, Bone & Joint Health, Gastrointestinal Health, Immunity, Cardiac Health, Diabetes, Others), By End-users (Adults, Geriatric, Pregnant Women, Children, Infants), By Distribution Channel (OTC, Prescribed) And Competitive Landscape
| Product Code: ETC021107 | Publication Date: Jul 2023 | Updated Date: Jun 2026 | Product Type: Report | |
| Publisher: 6Wresearch | Author: Ravi Bhandari | No. of Pages: 70 | No. of Figures: 35 | No. of Tables: 5 |
Singapore Diet Products Market Summary
The singapore diet products market was estimated at USD 224 Million in 2025 and is projected to reach USD 298 Million by 2032, growing at a CAGR of 4.8% from 2026 to 2032.
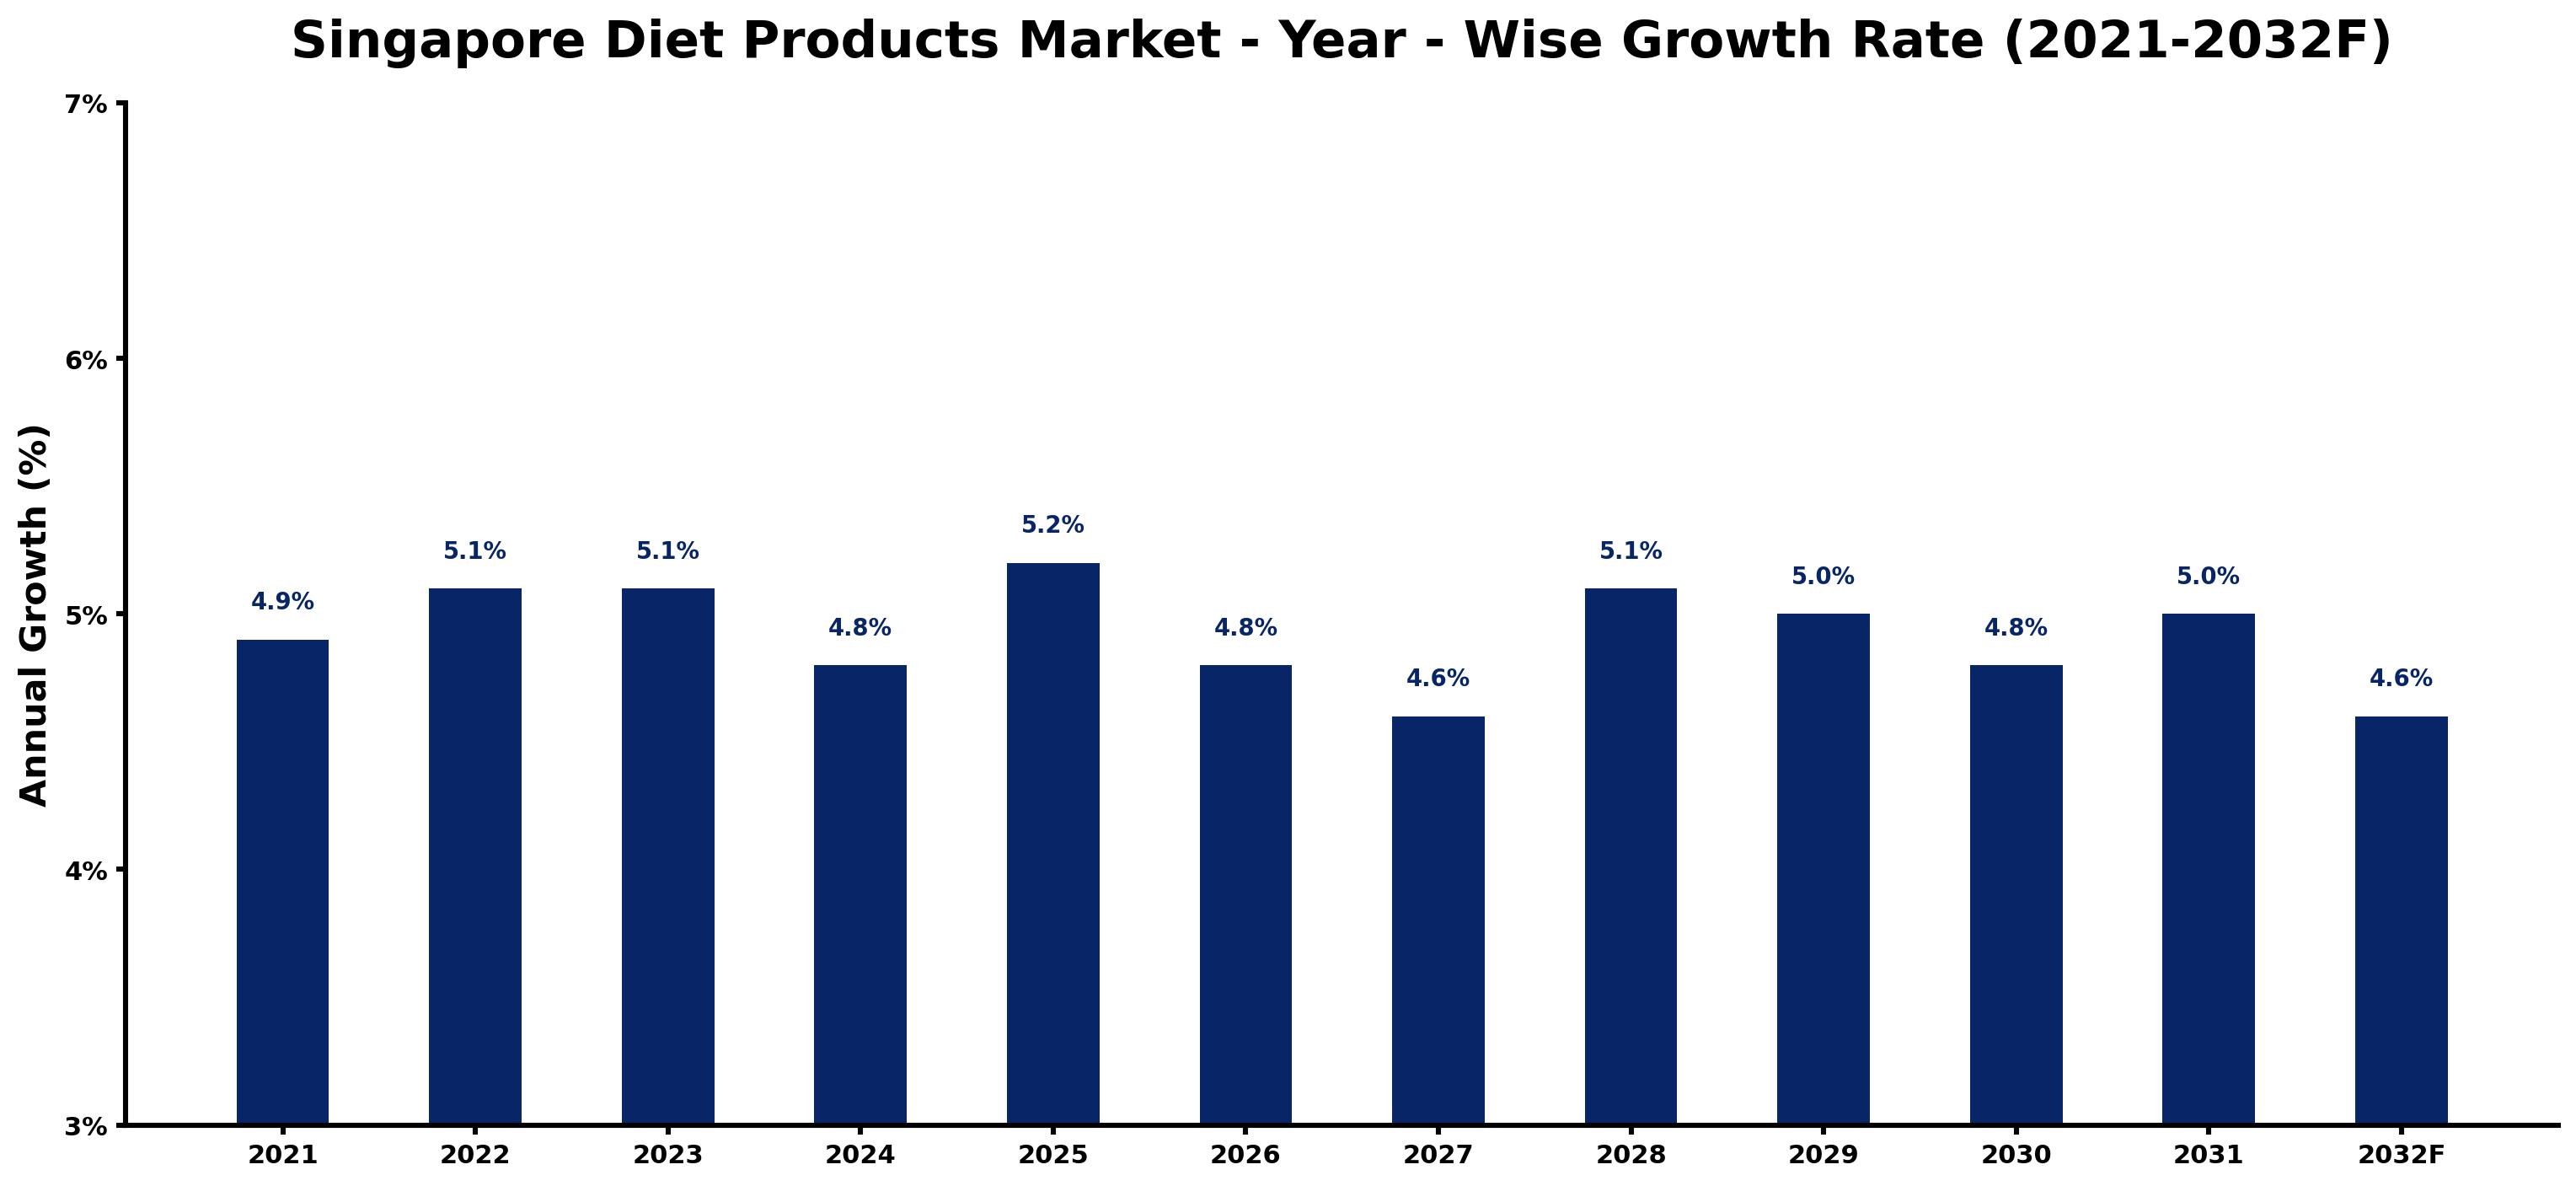
Singapore Diet Products Market Growth Rate Analysis (2021-2032)
The Singapore diet products market has exhibited sustained growth over recent years, with an increase of 4.9% in 2021 followed by a steady rise to 5.1% in both 2022 and 2023. This growth can be attributed to the rising health consciousness among consumers, particularly as urban lifestyles drive demand for convenient dietary solutions. Although projections indicate a slight dip to 4.8% in 2024 and 2026, the market rebounds with a 5.2% growth in 2025, driven by innovations in product formulations and an increasing focus on nutritional labeling. As consumer preferences evolve, investments in digital platforms for health tracking and personalized diets are set to fuel further expansion, allowing for a stable yet dynamic market landscape through 2032.
Singapore Diet Products Market Year-wise Growth Rate and Key Drivers
This graph highlights how the Singapore Diet Products Market has steadily grown over the past five years, supported by major growth factors.
The table below presents the year wise growth rates along with the key drivers influencing the market
| Year | Growth Rate | Major Drivers |
| 2021 | 4.9% | Health-conscious consumers increasingly seek out weight management solutions in Singapore. |
| 2022 | 5.1% | Emerging local brands focus on clean-label products, enhancing market competition significantly. |
| 2023 | 5.1% | Plant-based alternatives gain traction, appealing to the rising vegetarian population. |
| 2024 | 4.8% | Online retail channels expand, improving accessibility to diet products for consumers. |
| 2025 | 5.2% | Innovations in food technology enable better-tasting and healthier product offerings. |
| 2026 | 4.8% | Wellness trends drive demand for supplements targeting specific dietary needs. |
| 2027 | 4.6% | Corporate wellness programs increasingly incorporate diet products into employee health initiatives. |
| 2028 | 5.1% | Sustainability concerns prompt brands to adopt eco-friendly packaging solutions. |
| 2029 | 5.0% | Cultural shifts towards preventive healthcare influence consumer purchasing behaviors significantly. |
| 2030 | 4.8% | Personalized nutrition services emerge, leveraging technology for tailored diet plans. |
| 2031 | 5.0% | Cross-border e-commerce flourishes, allowing regional brands to penetrate Singapore's market. |
| 2032 | 4.6% | An aging population seeks specialized diet products to maintain health and vitality. |
Note - Market size estimations and growth projections presented in this report are based on 6Wresearch's advanced forecasting approach, validated with industry datasets as of June 2026.
Singapore Diet Products Market Synopsis
The Singapore Diet Products Market is projected to reach 4.8% and witness significant growth during the forecast period (2026-2032). This market is driven by several compelling factors including a growing awareness of unhealthy eating habits and an increasing number of health-conscious individuals in Singapore. The trend towards organic foods, the aging population, and the rising demand for functional foods also contribute significantly to the market's expansion.
Singapore Diet Products Market Growth Drivers
Several key drivers are shaping the Singapore diet products market landscape:
- The rise in obesity rates due to sedentary lifestyles and poor dietary choices has led consumers to seek healthier alternatives, significantly boosting demand for diet products.
- Increased awareness regarding the nutritional benefits of organic foods encourages consumers to transition from conventional diets to healthier options, supporting overall market growth.
- The surging elderly population is demanding specialized dietary products aimed at maintaining health and wellness, thus creating new opportunities for market players.
- The growing interest in functional foods, which provide health benefits beyond basic nutrition, is driving innovation in diet products, catering to a diverse range of consumer needs.
- Fitness enthusiasts are increasingly looking for convenient dietary solutions, leading to elevated demand for meal plans and ready-to-consume diet products that align with their nutritional requirements.
Singapore Diet Products Market Challenges and Restraints
Despite the positive growth trajectory, the Singapore diet products market is not without its challenges:
- Intense pricing competition from numerous local vendors who offer similar products at reduced rates may hinder revenue growth for premium segments of the market.
- Limited shelf space in retail environments often restricts the visibility and accessibility of higher-end imported diet products, complicating market entry for many brands.
- Consumer perceptions regarding the effectiveness of diet products can vary, which may influence purchasing decisions and overall sales performance.
- Regulatory challenges related to food safety and health claims can pose obstacles for companies wishing to introduce new diet products into the market.
- The fluctuation of raw material prices can impact production costs, thereby affecting product pricing and profitability margins in the diet products sector.
Singapore Diet Products Market Investment Opportunities
The Singapore diet products market presents a variety of investment opportunities:
- Investing in product innovation, particularly in organic and functional food segments, can cater to the rising health consciousness among consumers.
- Enhancing distribution channels through partnerships with e-commerce platforms can significantly widen reach and accessibility to consumers.
- Developing targeted marketing campaigns focused on educating consumers about the benefits of various diet products can improve market penetration.
- Exploring collaborations with fitness centers and wellness programs can generate synergies and encourage the adoption of diet products among health-conscious demographics.
- Expanding into niche markets, such as vegan or gluten-free diet products, can attract diverse consumer segments seeking specialized dietary solutions.
Singapore Diet Products Market Government Investment and Initiatives
The Singapore government is actively promoting healthier eating through various initiatives aimed at enhancing the diet products market:
- The government's health promotion initiatives focus on increasing public awareness regarding healthy eating habits and nutrition, driving demand for diet products.
- Public health campaigns aimed at reducing the prevalence of obesity and chronic diseases encourage the consumption of healthier dietary options.
- Subsidies and funding programs for research into innovative food technologies are fostering the development of new diet products that meet health standards.
- Partnerships with private sector stakeholders are being encouraged to promote the availability of nutritious food items in retail and food service sectors.
- The government is also investing in infrastructure to improve food safety regulations, which enhances consumer trust in dietary products available in the market.
Singapore Diet Products Market Latest Developments (May 2025 - June 2026)
In the period from May 2025 to June 2026, the Singapore diet products market experienced several important developments:
- The market saw a noticeable increase in the introduction of plant-based diet products, catering to the growing vegan population.
- Innovations in packaging technology focused on sustainability have emerged, appealing to environmentally conscious consumers.
- Health-focused brands have begun expanding their offerings to include convenient meal replacement options, seeking to attract busy professionals.
- An uptick in online sales platforms has enabled brands to reach a broader audience, particularly in the wake of the e-commerce boom.
- Collaborative efforts with nutritionists and dieticians have resulted in the development of scientifically-backed diet products that offer enhanced health benefits.
Singapore Diet Products Market - Key Attractiveness of the Report
- 10 Years of Market Numbers
- Historical Data Starting from 2022 to 2025
- Base Year: 2025
- Forecast Data until 2032
- Key Performance Indicators Impacting the Market
- Major Upcoming Developments and Projects
Key Highlights of the Report:
- Singapore Diet Products Market Outlook
- Market Size of Singapore Diet Products Market, 2025
- Forecast of Singapore Diet Products Market, 2032F
- Historical Data and Forecast of Singapore Diet Products Revenues & Volume for the Period 2022-2032F
- Singapore Diet Products Market Trend Evolution
- Singapore Diet Products Market Drivers and Challenges
- Singapore Diet Products Price Trends
- Singapore Diet Products Porter's Five Forces
- Singapore Diet Products Industry Life Cycle
- Historical Data and Forecast of Singapore Diet Products Market Revenues & Volume By Ingredients for the Period 2022-2032F
- Historical Data and Forecast of Singapore Diet Products Market Revenues & Volume By Vitamins for the Period 2022-2032F
- Historical Data and Forecast of Singapore Diet Products Market Revenues & Volume By Botanicals for the Period 2022-2032F
- Historical Data and Forecast of Singapore Diet Products Market Revenues & Volume By Minerals for the Period 2022-2032F
- Historical Data and Forecast of Singapore Diet Products Market Revenues & Volume By Proteins & Amino Acids for the Period 2022-2032F
- Historical Data and Forecast of Singapore Diet Products Market Revenues & Volume By Fibers & Specialty Carbohydrates for the Period 2022-2032F
- Historical Data and Forecast of Singapore Diet Products Market Revenues & Volume By Omega Fatty Acids for the Period 2022-2032F
- Historical Data and Forecast of Singapore Diet Products Market Revenues & Volume By Others for the Period 2022-2032F
- Historical Data and Forecast of Singapore Diet Products Market Revenues & Volume By Forms for the Period 2022-2032F
- Historical Data and Forecast of Singapore Diet Products Market Revenues & Volume By Tablets for the Period 2022-2032F
- Historical Data and Forecast of Singapore Diet Products Market Revenues & Volume By Capsules for the Period 2022-2032F
- Historical Data and Forecast of Singapore Diet Products Market Revenues & Volume By Soft gels for the Period 2022-2032F
- Historical Data and Forecast of Singapore Diet Products Market Revenues & Volume By Powders for the Period 2022-2032F
- Historical Data and Forecast of Singapore Diet Products Market Revenues & Volume By Gummies for the Period 2022-2032F
- Historical Data and Forecast of Singapore Diet Products Market Revenues & Volume By Liquids for the Period 2022-2032F
- Historical Data and Forecast of Singapore Diet Products Market Revenues & Volume By Others for the Period 2022-2032F
- Historical Data and Forecast of Singapore Diet Products Market Revenues & Volume By Applications for the Period 2022-2032F
- Historical Data and Forecast of Singapore Diet Products Market Revenues & Volume By Energy & Weight Management for the Period 2022-2032F
- Historical Data and Forecast of Singapore Diet Products Market Revenues & Volume By General Health for the Period 2022-2032F
- Historical Data and Forecast of Singapore Diet Products Market Revenues & Volume By Bone & Joint Health for the Period 2022-2032F
- Historical Data and Forecast of Singapore Diet Products Market Revenues & Volume By Gastrointestinal Health for the Period 2022-2032F
- Historical Data and Forecast of Singapore Diet Products Market Revenues & Volume By Immunity for the Period 2022-2032F
- Historical Data and Forecast of Singapore Diet Products Market Revenues & Volume By Cardiac Health for the Period 2022-2032F
- Historical Data and Forecast of Singapore Diet Products Market Revenues & Volume By Diabetes for the Period 2022-2032F
- Historical Data and Forecast of Singapore Diet Products Market Revenues & Volume By Others for the Period 2022-2032F
- Historical Data and Forecast of Singapore Diet Products Market Revenues & Volume By End-users for the Period 2022-2032F
- Historical Data and Forecast of Singapore Diet Products Market Revenues & Volume By Adults for the Period 2022-2032F
- Historical Data and Forecast of Singapore Diet Products Market Revenues & Volume By Geriatric for the Period 2022-2032F
- Historical Data and Forecast of Singapore Diet Products Market Revenues & Volume By Pregnant Women for the Period 2022-2032F
- Historical Data and Forecast of Singapore Diet Products Market Revenues & Volume By Children for the Period 2022-2032F
- Historical Data and Forecast of Singapore Diet Products Market Revenues & Volume By Infants for the Period 2022-2032F
- Historical Data and Forecast of Singapore Diet Products Market Revenues & Volume By Distribution Channel for the Period 2022-2032F
- Historical Data and Forecast of Singapore Diet Products Market Revenues & Volume By OTC for the Period 2022-2032F
- Historical Data and Forecast of Singapore Diet Products Market Revenues & Volume By Prescribed for the Period 2022-2032F
- Singapore Diet Products Import Export Trade Statistics
- Market Opportunity Assessment By Ingredients
- Market Opportunity Assessment By Forms
- Market Opportunity Assessment By Applications
- Market Opportunity Assessment By End-users
- Market Opportunity Assessment By Distribution Channel
- Singapore Diet Products Top Companies Market Share
- Singapore Diet Products Competitive Benchmarking By Technical and Operational Parameters
- Singapore Diet Products Company Profiles
- Singapore Diet Products Key Strategic Recommendations
Frequently Asked Questions About the Market Study (FAQs):
The growth is primarily driven by increased awareness of unhealthy eating habits, a focus on organic products, an aging population, and a trend towards functional foods.
Challenges include intense pricing competition, limited shelf space for premium products, and regulatory hurdles that may impact new product introductions.
Initially, the market experienced a decline during lockdowns, but subsequent stress-related consumption increased demand for diet products as people sought healthier options.
Investment opportunities include product innovation in organic segments, enhancements to e-commerce distribution channels, and targeted marketing strategies aimed at health-conscious consumers.
6Wresearch actively monitors the Singapore Diet Products Market and publishes its comprehensive annual report, highlighting emerging trends, growth drivers, revenue analysis, and forecast outlook. Our insights help businesses to make data-backed strategic decisions with ongoing market dynamics. Our analysts track relevent industries related to the Singapore Diet Products Market, allowing our clients with actionable intelligence and reliable forecasts tailored to emerging regional needs.
Yes, we provide customisation as per your requirements. To learn more, feel free to contact us on sales@6wresearch.com
1 Executive Summary |
2 Introduction |
2.1 Key Highlights of the Report |
2.2 Report Description |
2.3 Market Scope & Segmentation |
2.4 Research Methodology |
2.5 Assumptions |
3 Singapore Diet Products Market Overview |
3.1 Singapore Country Macro Economic Indicators |
3.2 Singapore Diet Products Market Revenues & Volume, 2022 & 2032F |
3.3 Singapore Diet Products Market - Industry Life Cycle |
3.4 Singapore Diet Products Market - Porter's Five Forces |
3.5 Singapore Diet Products Market Revenues & Volume Share, By Ingredients, 2022 & 2032F |
3.6 Singapore Diet Products Market Revenues & Volume Share, By Forms, 2022 & 2032F |
3.7 Singapore Diet Products Market Revenues & Volume Share, By Applications, 2022 & 2032F |
3.8 Singapore Diet Products Market Revenues & Volume Share, By End-users, 2022 & 2032F |
3.9 Singapore Diet Products Market Revenues & Volume Share, By Distribution Channel, 2022 & 2032F |
4 Singapore Diet Products Market Dynamics |
4.1 Impact Analysis |
4.2 Market Drivers |
4.3 Market Restraints |
5 Singapore Diet Products Market Trends |
6 Singapore Diet Products Market, By Types |
6.1 Singapore Diet Products Market, By Ingredients |
6.1.1 Overview and Analysis |
6.1.2 Singapore Diet Products Market Revenues & Volume, By Ingredients, 2022-2032F |
6.1.3 Singapore Diet Products Market Revenues & Volume, By Vitamins, 2022-2032F |
6.1.4 Singapore Diet Products Market Revenues & Volume, By Botanicals, 2022-2032F |
6.1.5 Singapore Diet Products Market Revenues & Volume, By Minerals, 2022-2032F |
6.1.6 Singapore Diet Products Market Revenues & Volume, By Proteins & Amino Acids, 2022-2032F |
6.1.7 Singapore Diet Products Market Revenues & Volume, By Fibers & Specialty Carbohydrates, 2022-2032F |
6.1.8 Singapore Diet Products Market Revenues & Volume, By Omega Fatty Acids, 2022-2032F |
6.2 Singapore Diet Products Market, By Forms |
6.2.1 Overview and Analysis |
6.2.2 Singapore Diet Products Market Revenues & Volume, By Tablets, 2022-2032F |
6.2.3 Singapore Diet Products Market Revenues & Volume, By Capsules, 2022-2032F |
6.2.4 Singapore Diet Products Market Revenues & Volume, By Soft gels, 2022-2032F |
6.2.5 Singapore Diet Products Market Revenues & Volume, By Powders, 2022-2032F |
6.2.6 Singapore Diet Products Market Revenues & Volume, By Gummies, 2022-2032F |
6.2.7 Singapore Diet Products Market Revenues & Volume, By Liquids, 2022-2032F |
6.3 Singapore Diet Products Market, By Applications |
6.3.1 Overview and Analysis |
6.3.2 Singapore Diet Products Market Revenues & Volume, By Energy & Weight Management, 2022-2032F |
6.3.3 Singapore Diet Products Market Revenues & Volume, By General Health, 2022-2032F |
6.3.4 Singapore Diet Products Market Revenues & Volume, By Bone & Joint Health, 2022-2032F |
6.3.5 Singapore Diet Products Market Revenues & Volume, By Gastrointestinal Health, 2022-2032F |
6.3.6 Singapore Diet Products Market Revenues & Volume, By Immunity, 2022-2032F |
6.3.7 Singapore Diet Products Market Revenues & Volume, By Cardiac Health, 2022-2032F |
6.3.8 Singapore Diet Products Market Revenues & Volume, By Others, 2022-2032F |
6.3.9 Singapore Diet Products Market Revenues & Volume, By Others, 2022-2032F |
6.4 Singapore Diet Products Market, By End-users |
6.4.1 Overview and Analysis |
6.4.2 Singapore Diet Products Market Revenues & Volume, By Adults, 2022-2032F |
6.4.3 Singapore Diet Products Market Revenues & Volume, By Geriatric, 2022-2032F |
6.4.4 Singapore Diet Products Market Revenues & Volume, By Pregnant Women, 2022-2032F |
6.4.5 Singapore Diet Products Market Revenues & Volume, By Children, 2022-2032F |
6.4.6 Singapore Diet Products Market Revenues & Volume, By Infants, 2022-2032F |
6.5 Singapore Diet Products Market, By Distribution Channel |
6.5.1 Overview and Analysis |
6.5.2 Singapore Diet Products Market Revenues & Volume, By OTC, 2022-2032F |
6.5.3 Singapore Diet Products Market Revenues & Volume, By Prescribed, 2022-2032F |
7 Singapore Diet Products Market Import-Export Trade Statistics |
7.1 Singapore Diet Products Market Export to Major Countries |
7.2 Singapore Diet Products Market Imports from Major Countries |
8 Singapore Diet Products Market Key Performance Indicators |
9 Singapore Diet Products Market - Opportunity Assessment |
9.1 Singapore Diet Products Market Opportunity Assessment, By Ingredients, 2022 & 2032F |
9.2 Singapore Diet Products Market Opportunity Assessment, By Forms, 2022 & 2032F |
9.3 Singapore Diet Products Market Opportunity Assessment, By Applications, 2022 & 2032F |
9.4 Singapore Diet Products Market Opportunity Assessment, By End-users, 2022 & 2032F |
9.5 Singapore Diet Products Market Opportunity Assessment, By Distribution Channel, 2022 & 2032F |
10 Singapore Diet Products Market - Competitive Landscape |
10.1 Singapore Diet Products Market Revenue Share, By Companies, 2025 |
10.2 Singapore Diet Products Market Competitive Benchmarking, By Operating and Technical Parameters |
11 Company Profiles |
12 Recommendations |
13 Disclaimer |
Global Go To Market Strategy - 2030
Export potential enables firms to identify high-growth global markets with greater confidence by combining advanced trade intelligence with a structured quantitative methodology. The framework analyzes emerging demand trends and country-level import patterns while integrating macroeconomic and trade datasets such as GDP and population forecasts, bilateral import–export flows, tariff structures, elasticity differentials between developed and developing economies, geographic distance, and import demand projections. Using weighted trade values from 2020–2024 as the base period to project country-to-country export potential for 2030, these inputs are operationalized through calculated drivers such as gravity model parameters, tariff impact factors, and projected GDP per-capita growth. Through an analysis of hidden potentials, demand hotspots, and market conditions that are most favorable to success, this method enables firms to focus on target countries, maximize returns, and global expansion with data, backed by accuracy.
By factoring in the projected importer demand gap that is currently unmet and could be potential opportunity, it identifies the potential for the Exporter (Country) among 190 countries, against the general trade analysis, which identifies the biggest importer or exporter.
To discover high-growth global markets and optimize your business strategy:
Click Here
Pricing
- Single User License$ 1,995
- Department License$ 2,400
- Site License$ 3,120
- Global License$ 3,795

Leadership Perspectives from Industry Events
Search
Thought Leadership and Analyst Meet


Our Clients
6WResearch In News
- India Air Conditioner Market Set for Strong Rebound in 2026 After Weather-Led Correction and GST-Driven Recovery: 6Wresearch
- ADAS in India: How Automatic Emergency Braking, Blind Spot Detection & Driver Monitoring are Transforming Road Safety
- Doha a strategic location for EV manufacturing hub: IPA Qatar
- Demand for luxury TVs surging in the GCC, says Samsung
- Empowering Growth: The Thriving Journey of Bangladesh’s Cable Industry
- Demand for luxury TVs surging in the GCC, says Samsung
Latest Reports
- Nicaragua RPG Gaming Market (2026-2032)
- New Zealand RPG Gaming Market (2026-2032)
- Netherlands RPG Gaming Market (2026-2032)
- Nauru RPG Gaming Market (2026-2032)
- Namibia RPG Gaming Market (2026-2032)
- Mozambique RPG Gaming Market (2026-2032)
- Montenegro RPG Gaming Market (2026-2032)
- Mongolia RPG Gaming Market (2026-2032)
- Monaco RPG Gaming Market (2026-2032)
- Micronesia RPG Gaming Market (2026-2032)
Industry Events and Analyst Meet

HIMTEX 2026

India Refining Summit 2026

India EV Show 2026

EV tech India Expo 2026

Auto Tech Asia 2026
Whitepaper
- Middle East & Africa Commercial Security Market Click here to view more.
- Middle East & Africa Fire Safety Systems & Equipment Market Click here to view more.
- GCC Drone Market Click here to view more.
- Middle East Lighting Fixture Market Click here to view more.
- GCC Physical & Perimeter Security Market Click here to view more.