Qatar Diet Products Market (2026-2032) | Forecast, Growth, Value, Industry, Trends, Size, Outlook, Analysis, Revenue, Companies & Share
Market Forecast By Ingredients (Vitamins, Botanicals, Minerals, Proteins & Amino Acids, Fibers & Specialty Carbohydrates, Omega Fatty Acids, Others), By Forms (Tablets, Capsules, Soft gels, Powders, Gummies, Liquids, Others), By Applications (Energy & Weight Management, General Health, Bone & Joint Health, Gastrointestinal Health, Immunity, Cardiac Health, Diabetes, Others), By End-users (Adults, Geriatric, Pregnant Women, Children, Infants), By Distribution Channel (OTC, Prescribed) And Competitive Landscape
| Product Code: ETC021121 | Publication Date: Jul 2023 | Updated Date: Jun 2026 | Product Type: Report | |
| Publisher: 6Wresearch | Author: Ravi Bhandari | No. of Pages: 70 | No. of Figures: 35 | No. of Tables: 5 |
Qatar Diet Products Market Summary
The qatar diet products market was estimated at USD 391 Million in 2025 and is projected to reach USD 523 Million by 2032, growing at a CAGR of 5.0% from 2026 to 2032.
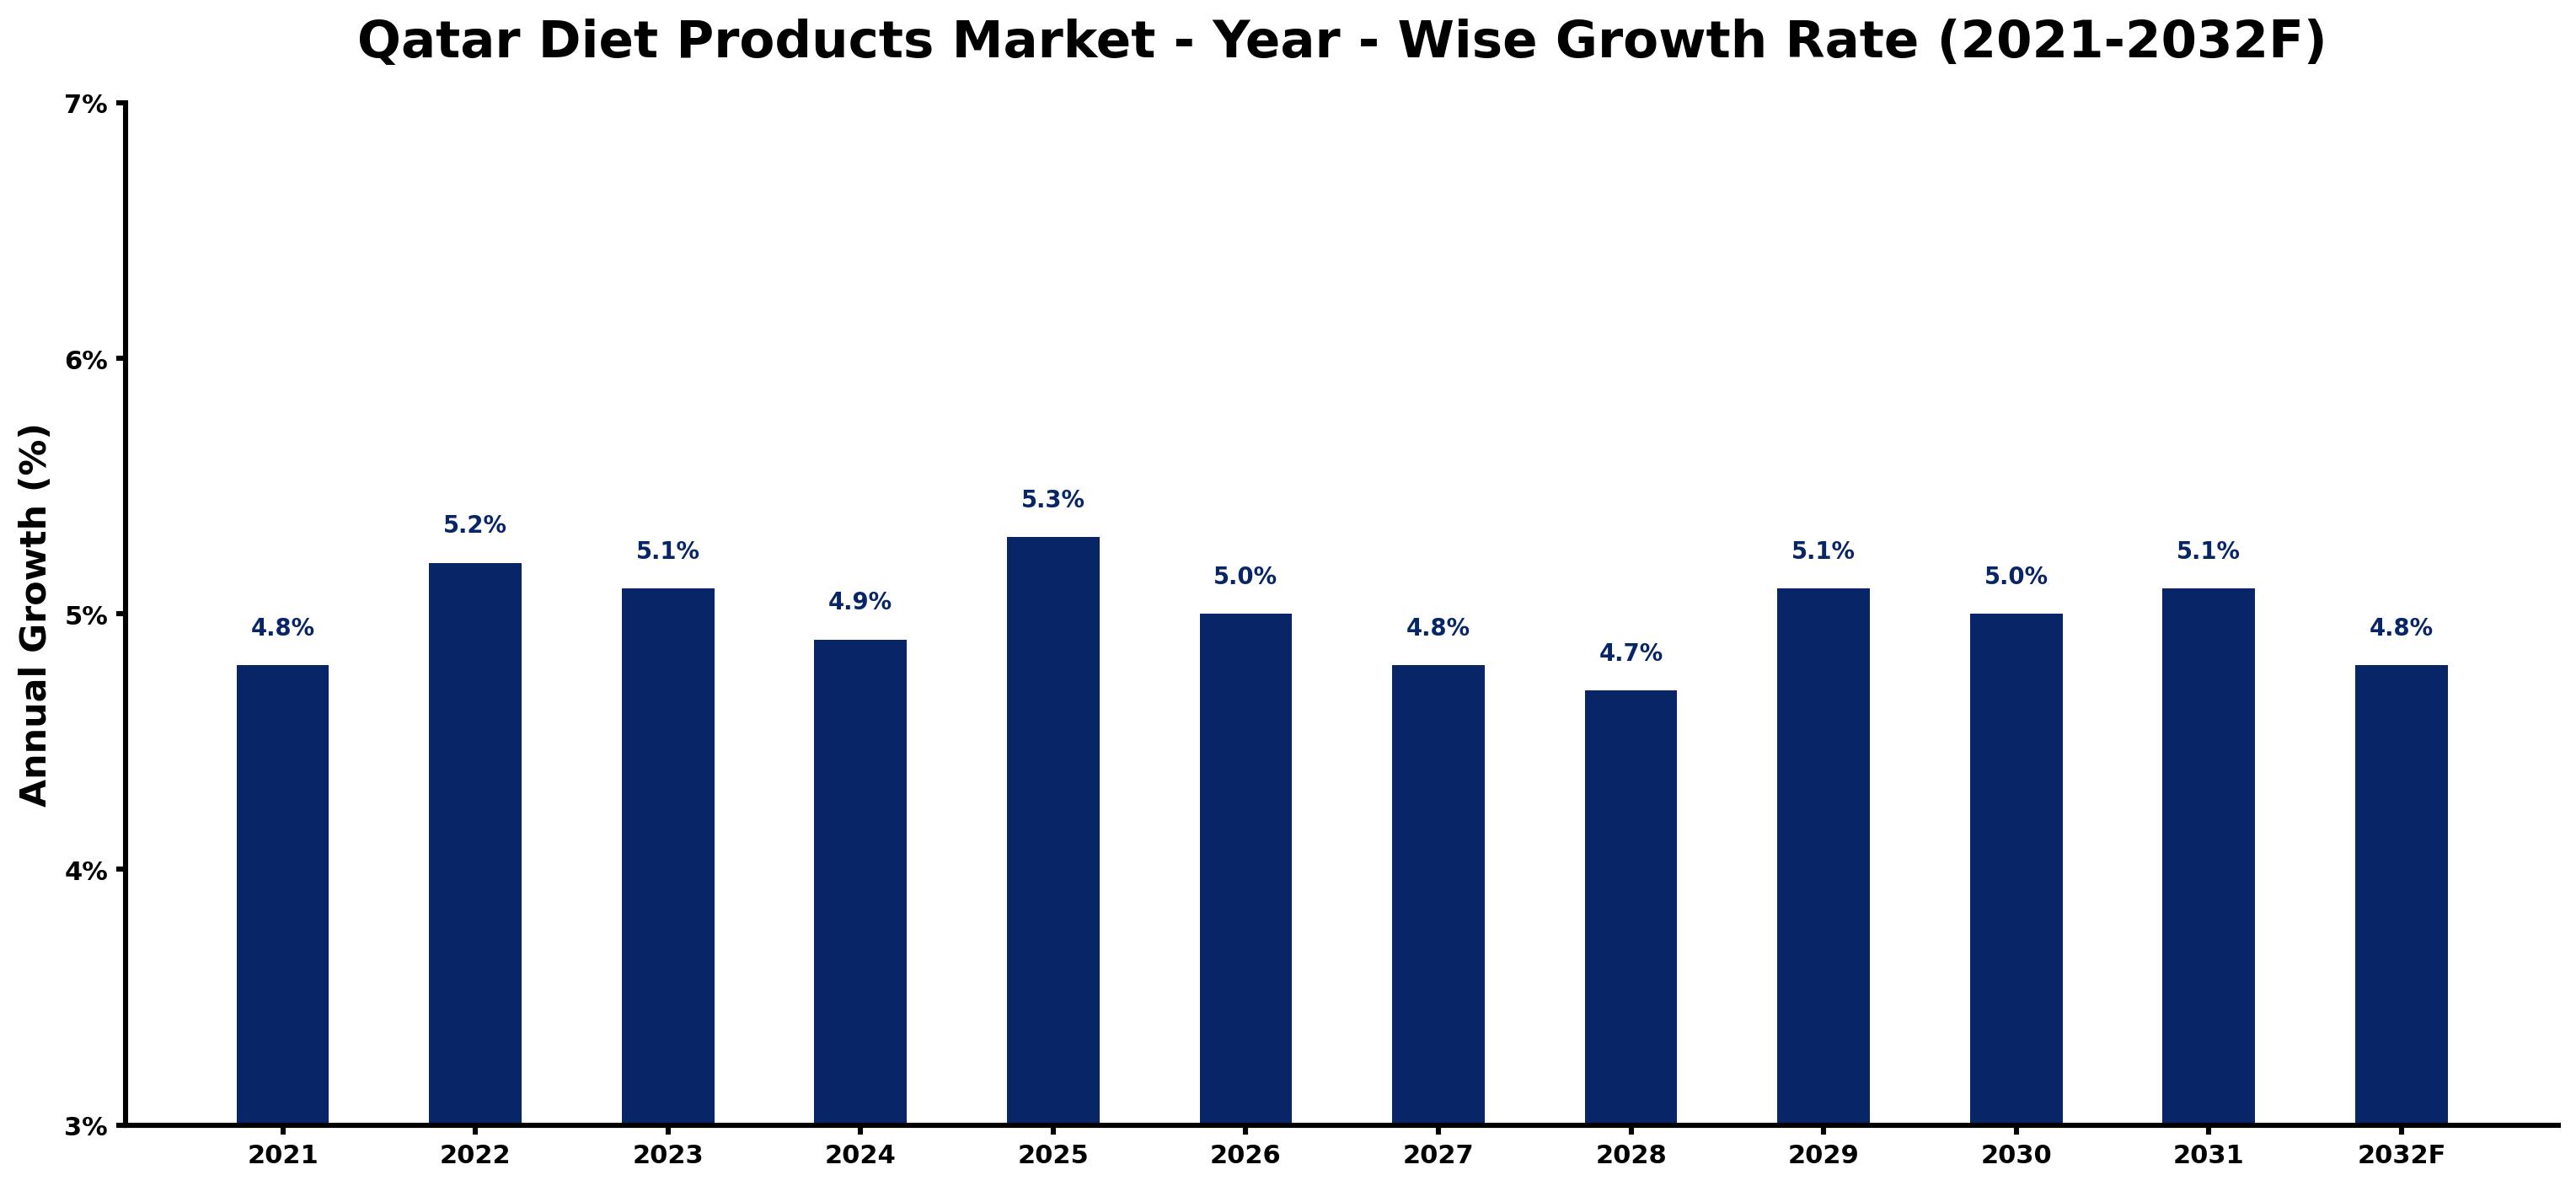
Qatar Diet Products Market Growth Rate Analysis (2021-2032)
The Qatar diet products market has exhibited stable growth, with annual increases ranging from 4.7% to 5.3% over the past years. In 2021, the market grew by 4.8% as rising consumer health awareness sparked demand for healthier food options. This trend continued into 2022, where growth reached 5.2%, driven by increased investments in product innovation and marketing strategies tailored to local preferences. Slight fluctuations were observed in subsequent years, such as the slight dip to 4.9% in 2024, attributed to global supply chain challenges. However, the market rebounded with a 5.3% growth in 2025, fueled by digitalization in distribution channels and heightened consumer interest in wellness. Overall, the outlook remains optimistic as the sector is poised for steady expansion through 2032.
Qatar Diet Products Market Year-wise Growth Rate and Key Drivers
This graph highlights how the Qatar Diet Products Market has steadily grown over the past five years, supported by major growth factors.
The table below presents the year wise growth rates along with the key drivers influencing the market
| Year | Growth Rate | Major Drivers |
| 2021 | 4.8% | Increased health awareness among consumers has shifted preferences towards diet products. |
| 2022 | 5.2% | Local production of healthy snacks aligns with Qatar's push for food security. |
| 2023 | 5.1% | Middle Eastern cuisine adaptations inspire innovation in low-calorie alternatives. |
| 2024 | 4.9% | Social media influencers are impacting consumer choices towards healthier diets. |
| 2025 | 5.3% | Fitness trends encourage higher sales of protein supplements and meal replacements. |
| 2026 | 5.0% | Health-focused activities during major events stimulate demand for diet-related products. |
| 2027 | 4.8% | Corporate wellness programs promote healthier lifestyle choices, boosting market growth. |
| 2028 | 4.7% | Sustainability in packaging resonates with environmentally conscious consumers in Qatar. |
| 2029 | 5.1% | E-commerce platforms enhance accessibility to a variety of diet products. |
| 2030 | 5.0% | Collaborations between local chefs and diet brands enrich product offerings innovatively. |
| 2031 | 5.1% | Advanced research in nutrition impacts the development of personalized diet solutions. |
| 2032 | 4.8% | Cultural adaptations of global diet trends create unique market opportunities in Qatar. |
Note - Market size estimations and growth projections presented in this report are based on 6Wresearch's advanced forecasting approach, validated with industry datasets as of June 2026.
Qatar Diet Products Market Synopsis
The Qatar Diet Products Market is projected to reach 5.0% and witness significant growth during the forecast period (2026-2032). This expansion is largely driven by the increasing health consciousness among the population and a robust economic environment. As consumers become more proactive in managing their health and wellness, the demand for diet products is expected to rise, encouraging manufacturers to innovate and cater to the evolving preferences of the market.
Qatar Diet Products Market Growth Drivers
A multitude of factors are propelling the growth of the Qatar Diet Products Market. Key growth drivers include:
- The rising awareness of health and fitness needs among consumers in Qatar is significantly influencing dietary choices. An increasing number of individuals are actively seeking diet products that align with their personal health goals.
- Technological advancements in food processing and nutrition science have led to the development of innovative diet products. These advancements enable manufacturers to create healthier, more appealing options that meet consumer demands.
- The foodservice industry in Qatar is adapting to changing consumer preferences by incorporating functional ingredients such as proteins and fibers into dishes. This shift towards health-oriented culinary offerings enhances the market's growth potential.
- There is a notable increase in the offerings of low-fat and sugar-free products in the market, catering to consumers' growing preferences for healthier alternatives in their diets.
- Government initiatives promoting healthier lifestyles and nutritional education contribute to heightened consumer interest in diet products, fostering a supportive environment for market growth.
Qatar Diet Products Market Challenges and Restraints
Despite the positive growth trajectory, the Qatar Diet Products Market faces several challenges that could hinder its expansion. These challenges include:
- The high cost of diet products remains a significant barrier to widespread adoption among consumers, largely due to the lack of local production facilities. This results in increased prices as products must be imported, making them less accessible to a broader audience.
- Many consumers, particularly in remote areas, lack sufficient knowledge about the nutritional value and benefits of dietary supplements. This gap in understanding can lead to lower adoption rates among critical segments of the population.
- The ongoing impact of economic fluctuations can affect consumer spending power, limiting the potential market for premium diet products, which are often priced higher than their conventional counterparts.
- Market fragmentation poses a challenge for companies as they compete for consumer attention in a landscape filled with diverse offerings, necessitating innovative marketing strategies to stand out.
- The regulatory environment surrounding health and nutrition products can create uncertainty for manufacturers, complicating product development and market entry strategies.
Qatar Diet Products Market Government Investment and Initiatives
The Qatari government has placed a strong emphasis on promoting health and wellness among its citizens through various initiatives and investments. These include:
- Public spending on health education campaigns aimed at increasing awareness of nutritional needs and healthy eating habits, thereby encouraging the consumption of diet products.
- Support for local industries involved in food production, which could lead to the establishment of local manufacturing facilities for diet products, helping to stabilize prices and enhance product accessibility.
- Collaboration with private sector stakeholders to foster innovation in the diet product space, encouraging partnerships that leverage technological advancements.
- Investment in research and development programs focused on nutrition and dietetics, designed to create evidence-based guidelines that will inform product development.
- Policies facilitating improved access to nutritional information, empowering consumers to make informed dietary choices, which can indirectly stimulate demand for diet products.
Qatar Diet Products Market Latest Developments (May 2025 - June 2026)
Recent developments in the Qatar Diet Products Market have indicated a trend toward increased variety and availability of health-focused products. The industry saw a notable rise in collaborations among manufacturers and health professionals to enhance product formulations and educate consumers on health benefits. Companies are also focusing on sustainability and ethical sourcing, reflecting consumer demand for responsible consumption. Additionally, the market is responding to changing consumer behaviors influenced by COVID-19, with a heightened focus on immunity-boosting and functional foods. The overall outlook remains cautiously optimistic as businesses adapt to the evolving landscape, paving the way for innovative offerings.
Qatar Diet Products Market - Key Attractiveness of the Report
- 10 Years of Market Numbers
- Historical Data Starting from 2022 to 2025
- Base Year: 2025
- Forecast Data until 2032
- Key Performance Indicators Impacting the Market
- Major Upcoming Developments and Projects
Key Highlights of the Report:
- Qatar Diet Products Market Outlook
- Market Size of Qatar Diet Products Market, 2025
- Forecast of Qatar Diet Products Market, 2032
- Historical Data and Forecast of Qatar Diet Products Revenues & Volume for the Period 2022-2032F
- Qatar Diet Products Market Trend Evolution
- Qatar Diet Products Market Drivers and Challenges
- Qatar Diet Products Price Trends
- Qatar Diet Products Porter's Five Forces
- Qatar Diet Products Industry Life Cycle
- Historical Data and Forecast of Qatar Diet Products Market Revenues & Volume By Ingredients for the Period 2022-2032F
- Historical Data and Forecast of Qatar Diet Products Market Revenues & Volume By Vitamins for the Period 2022-2032F
- Historical Data and Forecast of Qatar Diet Products Market Revenues & Volume By Botanicals for the Period 2022-2032F
- Historical Data and Forecast of Qatar Diet Products Market Revenues & Volume By Minerals for the Period 2022-2032F
- Historical Data and Forecast of Qatar Diet Products Market Revenues & Volume By Proteins & Amino Acids for the Period 2022-2032F
- Historical Data and Forecast of Qatar Diet Products Market Revenues & Volume By Fibers & Specialty Carbohydrates for the Period 2022-2032F
- Historical Data and Forecast of Qatar Diet Products Market Revenues & Volume By Omega Fatty Acids for the Period 2022-2032F
- Historical Data and Forecast of Qatar Diet Products Market Revenues & Volume By Others for the Period 2022-2032F
- Historical Data and Forecast of Qatar Diet Products Market Revenues & Volume By Forms for the Period 2022-2032F
- Historical Data and Forecast of Qatar Diet Products Market Revenues & Volume By Tablets for the Period 2022-2032F
- Historical Data and Forecast of Qatar Diet Products Market Revenues & Volume By Capsules for the Period 2022-2032F
- Historical Data and Forecast of Qatar Diet Products Market Revenues & Volume By Soft gels for the Period 2022-2032F
- Historical Data and Forecast of Qatar Diet Products Market Revenues & Volume By Powders for the Period 2022-2032F
- Historical Data and Forecast of Qatar Diet Products Market Revenues & Volume By Gummies for the Period 2022-2032F
- Historical Data and Forecast of Qatar Diet Products Market Revenues & Volume By Liquids for the Period 2022-2032F
- Historical Data and Forecast of Qatar Diet Products Market Revenues & Volume By Others for the Period 2022-2032F
- Historical Data and Forecast of Qatar Diet Products Market Revenues & Volume By Applications for the Period 2022-2032F
- Historical Data and Forecast of Qatar Diet Products Market Revenues & Volume By Energy & Weight Management for the Period 2022-2032F
- Historical Data and Forecast of Qatar Diet Products Market Revenues & Volume By General Health for the Period 2022-2032F
- Historical Data and Forecast of Qatar Diet Products Market Revenues & Volume By Bone & Joint Health for the Period 2022-2032F
- Historical Data and Forecast of Qatar Diet Products Market Revenues & Volume By Gastrointestinal Health for the Period 2022-2032F
- Historical Data and Forecast of Qatar Diet Products Market Revenues & Volume By Immunity for the Period 2022-2032F
- Historical Data and Forecast of Qatar Diet Products Market Revenues & Volume By Cardiac Health for the Period 2022-2032F
- Historical Data and Forecast of Qatar Diet Products Market Revenues & Volume By Diabetes for the Period 2022-2032F
- Historical Data and Forecast of Qatar Diet Products Market Revenues & Volume By Others for the Period 2022-2032F
- Historical Data and Forecast of Qatar Diet Products Market Revenues & Volume By End-users for the Period 2022-2032F
- Historical Data and Forecast of Qatar Diet Products Market Revenues & Volume By Adults for the Period 2022-2032F
- Historical Data and Forecast of Qatar Diet Products Market Revenues & Volume By Geriatric for the Period 2022-2032F
- Historical Data and Forecast of Qatar Diet Products Market Revenues & Volume By Pregnant Women for the Period 2022-2032F
- Historical Data and Forecast of Qatar Diet Products Market Revenues & Volume By Children for the Period 2022-2032F
- Historical Data and Forecast of Qatar Diet Products Market Revenues & Volume By Infants for the Period 2022-2032F
- Historical Data and Forecast of Qatar Diet Products Market Revenues & Volume By Distribution Channel for the Period 2022-2032F
- Historical Data and Forecast of Qatar Diet Products Market Revenues & Volume By OTC for the Period 2022-2032F
- Historical Data and Forecast of Qatar Diet Products Market Revenues & Volume By Prescribed for the Period 2022-2032F
- Qatar Diet Products Import Export Trade Statistics
- Market Opportunity Assessment By Ingredients
- Market Opportunity Assessment By Forms
- Market Opportunity Assessment By Applications
- Market Opportunity Assessment By End-users
- Market Opportunity Assessment By Distribution Channel
- Qatar Diet Products Top Companies Market Share
- Qatar Diet Products Competitive Benchmarking By Technical and Operational Parameters
- Qatar Diet Products Company Profiles
- Qatar Diet Products Key Strategic Recommendations
Frequently Asked Questions About the Market Study (FAQs):
The primary drivers include rising health consciousness, technological advancements in product development, and increasing demand from the foodservice sector for healthier options.
Challenges involve high product costs due to imports, a lack of consumer awareness in certain regions, and regulatory complexities affecting product offerings.
The government is promoting health initiatives, supporting local food production, and investing in nutritional education to enhance public awareness of diet products.
Emerging trends include a focus on sustainability, increasing collaboration between manufacturers and health professionals, and a shift towards immunity-boosting products in response to consumer needs post-pandemic.
6Wresearch actively monitors the Qatar Diet Products Market and publishes its comprehensive annual report, highlighting emerging trends, growth drivers, revenue analysis, and forecast outlook. Our insights help businesses to make data-backed strategic decisions with ongoing market dynamics. Our analysts track relevent industries related to the Qatar Diet Products Market, allowing our clients with actionable intelligence and reliable forecasts tailored to emerging regional needs.
Yes, we provide customisation as per your requirements. To learn more, feel free to contact us on sales@6wresearch.com
1 Executive Summary |
2 Introduction |
2.1 Key Highlights of the Report |
2.2 Report Description |
2.3 Market Scope & Segmentation |
2.4 Research Methodology |
2.5 Assumptions |
3 Qatar Diet Products Market Overview |
3.1 Qatar Country Macro Economic Indicators |
3.2 Qatar Diet Products Market Revenues & Volume, 2022 & 2032F |
3.3 Qatar Diet Products Market - Industry Life Cycle |
3.4 Qatar Diet Products Market - Porter's Five Forces |
3.5 Qatar Diet Products Market Revenues & Volume Share, By Ingredients, 2022 & 2032F |
3.6 Qatar Diet Products Market Revenues & Volume Share, By Forms, 2022 & 2032F |
3.7 Qatar Diet Products Market Revenues & Volume Share, By Applications, 2022 & 2032F |
3.8 Qatar Diet Products Market Revenues & Volume Share, By End-users, 2022 & 2032F |
3.9 Qatar Diet Products Market Revenues & Volume Share, By Distribution Channel, 2022 & 2032F |
4 Qatar Diet Products Market Dynamics |
4.1 Impact Analysis |
4.2 Market Drivers |
4.3 Market Restraints |
5 Qatar Diet Products Market Trends |
6 Qatar Diet Products Market, By Types |
6.1 Qatar Diet Products Market, By Ingredients |
6.1.1 Overview and Analysis |
6.1.2 Qatar Diet Products Market Revenues & Volume, By Ingredients, 2022-2032F |
6.1.3 Qatar Diet Products Market Revenues & Volume, By Vitamins, 2022-2032F |
6.1.4 Qatar Diet Products Market Revenues & Volume, By Botanicals, 2022-2032F |
6.1.5 Qatar Diet Products Market Revenues & Volume, By Minerals, 2022-2032F |
6.1.6 Qatar Diet Products Market Revenues & Volume, By Proteins & Amino Acids, 2022-2032F |
6.1.7 Qatar Diet Products Market Revenues & Volume, By Fibers & Specialty Carbohydrates, 2022-2032F |
6.1.8 Qatar Diet Products Market Revenues & Volume, By Omega Fatty Acids, 2022-2032F |
6.2 Qatar Diet Products Market, By Forms |
6.2.1 Overview and Analysis |
6.2.2 Qatar Diet Products Market Revenues & Volume, By Tablets, 2022-2032F |
6.2.3 Qatar Diet Products Market Revenues & Volume, By Capsules, 2022-2032F |
6.2.4 Qatar Diet Products Market Revenues & Volume, By Soft gels, 2022-2032F |
6.2.5 Qatar Diet Products Market Revenues & Volume, By Powders, 2022-2032F |
6.2.6 Qatar Diet Products Market Revenues & Volume, By Gummies, 2022-2032F |
6.2.7 Qatar Diet Products Market Revenues & Volume, By Liquids, 2022-2032F |
6.3 Qatar Diet Products Market, By Applications |
6.3.1 Overview and Analysis |
6.3.2 Qatar Diet Products Market Revenues & Volume, By Energy & Weight Management, 2022-2032F |
6.3.3 Qatar Diet Products Market Revenues & Volume, By General Health, 2022-2032F |
6.3.4 Qatar Diet Products Market Revenues & Volume, By Bone & Joint Health, 2022-2032F |
6.3.5 Qatar Diet Products Market Revenues & Volume, By Gastrointestinal Health, 2022-2032F |
6.3.6 Qatar Diet Products Market Revenues & Volume, By Immunity, 2022-2032F |
6.3.7 Qatar Diet Products Market Revenues & Volume, By Cardiac Health, 2022-2032F |
6.3.8 Qatar Diet Products Market Revenues & Volume, By Others, 2022-2032F |
6.3.9 Qatar Diet Products Market Revenues & Volume, By Others, 2022-2032F |
6.4 Qatar Diet Products Market, By End-users |
6.4.1 Overview and Analysis |
6.4.2 Qatar Diet Products Market Revenues & Volume, By Adults, 2022-2032F |
6.4.3 Qatar Diet Products Market Revenues & Volume, By Geriatric, 2022-2032F |
6.4.4 Qatar Diet Products Market Revenues & Volume, By Pregnant Women, 2022-2032F |
6.4.5 Qatar Diet Products Market Revenues & Volume, By Children, 2022-2032F |
6.4.6 Qatar Diet Products Market Revenues & Volume, By Infants, 2022-2032F |
6.5 Qatar Diet Products Market, By Distribution Channel |
6.5.1 Overview and Analysis |
6.5.2 Qatar Diet Products Market Revenues & Volume, By OTC, 2022-2032F |
6.5.3 Qatar Diet Products Market Revenues & Volume, By Prescribed, 2022-2032F |
7 Qatar Diet Products Market Import-Export Trade Statistics |
7.1 Qatar Diet Products Market Export to Major Countries |
7.2 Qatar Diet Products Market Imports from Major Countries |
8 Qatar Diet Products Market Key Performance Indicators |
9 Qatar Diet Products Market - Opportunity Assessment |
9.1 Qatar Diet Products Market Opportunity Assessment, By Ingredients, 2022 & 2032F |
9.2 Qatar Diet Products Market Opportunity Assessment, By Forms, 2022 & 2032F |
9.3 Qatar Diet Products Market Opportunity Assessment, By Applications, 2022 & 2032F |
9.4 Qatar Diet Products Market Opportunity Assessment, By End-users, 2022 & 2032F |
9.5 Qatar Diet Products Market Opportunity Assessment, By Distribution Channel, 2022 & 2032F |
10 Qatar Diet Products Market - Competitive Landscape |
10.1 Qatar Diet Products Market Revenue Share, By Companies, 2025 |
10.2 Qatar Diet Products Market Competitive Benchmarking, By Operating and Technical Parameters |
11 Company Profiles |
12 Recommendations |
13 Disclaimer |
Global Go To Market Strategy - 2030
Export potential enables firms to identify high-growth global markets with greater confidence by combining advanced trade intelligence with a structured quantitative methodology. The framework analyzes emerging demand trends and country-level import patterns while integrating macroeconomic and trade datasets such as GDP and population forecasts, bilateral import–export flows, tariff structures, elasticity differentials between developed and developing economies, geographic distance, and import demand projections. Using weighted trade values from 2020–2024 as the base period to project country-to-country export potential for 2030, these inputs are operationalized through calculated drivers such as gravity model parameters, tariff impact factors, and projected GDP per-capita growth. Through an analysis of hidden potentials, demand hotspots, and market conditions that are most favorable to success, this method enables firms to focus on target countries, maximize returns, and global expansion with data, backed by accuracy.
By factoring in the projected importer demand gap that is currently unmet and could be potential opportunity, it identifies the potential for the Exporter (Country) among 190 countries, against the general trade analysis, which identifies the biggest importer or exporter.
To discover high-growth global markets and optimize your business strategy:
Click Here
Pricing
- Single User License$ 1,995
- Department License$ 2,400
- Site License$ 3,120
- Global License$ 3,795

Leadership Perspectives from Industry Events
Search
Thought Leadership and Analyst Meet


Our Clients
6WResearch In News
- India Air Conditioner Market Set for Strong Rebound in 2026 After Weather-Led Correction and GST-Driven Recovery: 6Wresearch
- ADAS in India: How Automatic Emergency Braking, Blind Spot Detection & Driver Monitoring are Transforming Road Safety
- Doha a strategic location for EV manufacturing hub: IPA Qatar
- Demand for luxury TVs surging in the GCC, says Samsung
- Empowering Growth: The Thriving Journey of Bangladesh’s Cable Industry
- Demand for luxury TVs surging in the GCC, says Samsung
Latest Reports
- Poland Fire Protection Systems Market (2026-2032)
- Cape Verde Portable Hand-Thrown Extinguisher Market (2026-2032)
- Canada Portable Hand-Thrown Extinguisher Market (2026-2032)
- Cameroon Portable Hand-Thrown Extinguisher Market (2026-2032)
- Burundi Portable Hand-Thrown Extinguisher Market (2026-2032)
- Burkina Faso Portable Hand-Thrown Extinguisher Market (2026-2032)
- Bulgaria Portable Hand-Thrown Extinguisher Market (2026-2032)
- Brunei Portable Hand-Thrown Extinguisher Market (2026-2032)
- Botswana Portable Hand-Thrown Extinguisher Market (2026-2032)
- Bosnia and Herzegovina Portable Hand-Thrown Extinguisher Market (2026-2032)
Industry Events and Analyst Meet

HIMTEX 2026

India Refining Summit 2026

India EV Show 2026

EV tech India Expo 2026

Auto Tech Asia 2026
Whitepaper
- Middle East & Africa Commercial Security Market Click here to view more.
- Middle East & Africa Fire Safety Systems & Equipment Market Click here to view more.
- GCC Drone Market Click here to view more.
- Middle East Lighting Fixture Market Click here to view more.
- GCC Physical & Perimeter Security Market Click here to view more.