Singapore Electronic Components Market (2026-2032) | Industry, Forecast, Growth, Trends, Share, Value, Revenue, Analysis, Outlook, Size & Companies
Market Forecast By Types (Passive , Active, Electro Mechanic), By Applications (Automotive, Communications, Industrial, Computing Applications, Others) And Competitive Landscape
| Product Code: ETC036527 | Publication Date: Jul 2023 | Updated Date: Jun 2026 | Product Type: Report | |
| Publisher: 6Wresearch | Author: Ravi Bhandari | No. of Pages: 70 | No. of Figures: 35 | No. of Tables: 5 |
Singapore Electronic Components Market Summary
The singapore electronic components market was estimated at USD 263 Million in 2025 and is projected to reach USD 354 Million by 2032, growing at a CAGR of 4.9% from 2026 to 2032.
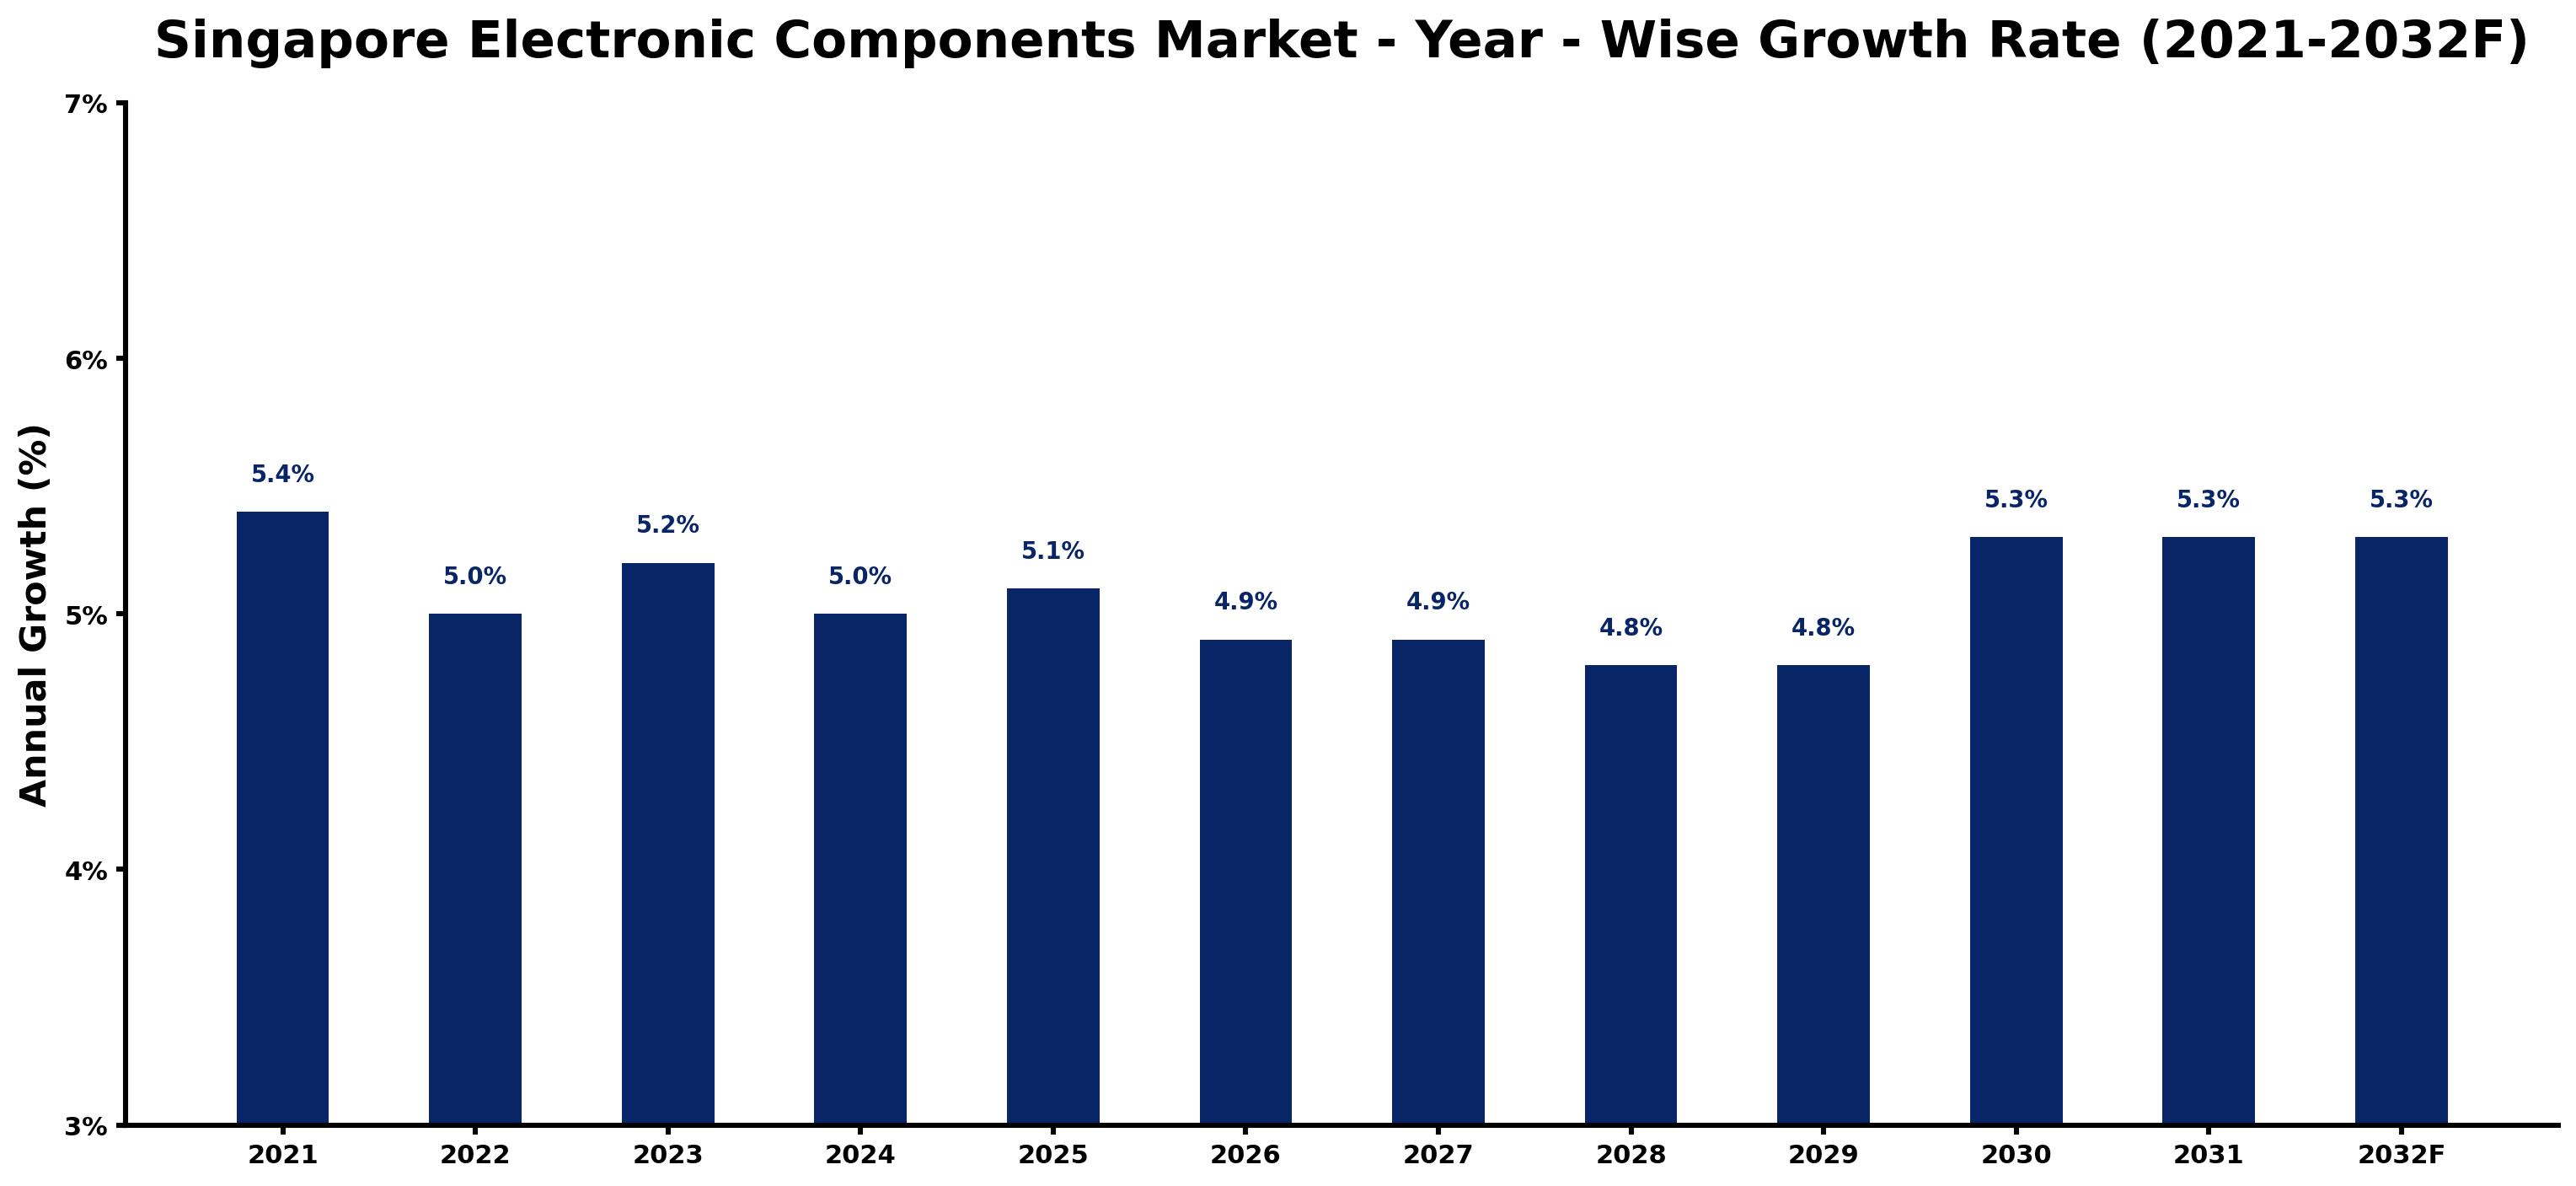
Singapore Electronic Components Market Growth Rate Analysis (2021-2032)
The Singapore electronic components market is poised for stable growth, evidenced by annual increases ranging from 4.8% to 5.4% over the past few years. Following a peak of 5.4% in 2021, growth tapered slightly to 5.0% in 2022, largely due to global supply chain disruptions. However, renewed strength in 2023, with a growth rate of 5.2%, can be attributed to rising consumer demand and substantial investments in digitalization and technology. Looking ahead, the market is projected to maintain a steady pace, with 5.3% growth forecasted for 2030 to 2032, driven by ongoing advancements in infrastructure and a robust focus on energy transitions. Such dynamics position Singapore as a critical hub in the regional electronic components landscape.
Singapore Electronic Components Market Year-wise Growth Rate and Key Drivers
This graph highlights how the Singapore Electronic Components Market has steadily grown over the past five years, supported by major growth factors.
The table below presents the year wise growth rates along with the key drivers influencing the market
| Year | Growth Rate | Major Drivers |
| 2021 | 5.4% | Post-lockdown investments return focus to electronic components for advanced automation. |
| 2022 | 5.0% | Corporate budgets increasingly emphasize sustainability, prompting greener electronic component sourcing. |
| 2023 | 5.2% | Emerging technologies like IoT create demand for specialized electronic components and sensors. |
| 2024 | 5.0% | Local manufacturers enhance production capabilities, reducing dependency on foreign components significantly. |
| 2025 | 5.1% | Smart city initiatives motivate upgrades in infrastructure, boosting electronic component requirements. |
| 2026 | 4.9% | Consumer electronics market expansion drives innovation and heightened demand for components. |
| 2027 | 4.9% | The automotive sector embraces electric vehicles, necessitating advanced electronic component integration. |
| 2028 | 4.8% | Regional trade agreements streamline import processes, enhancing market competitiveness and pricing. |
| 2029 | 4.8% | Healthcare technology advancements create opportunities for electronic components in medical devices. |
| 2030 | 5.3% | Cybersecurity concerns lead to increased investment in secure electronic components and systems. |
| 2031 | 5.3% | Collaboration between tech firms enhances research, fueling novel electronic component developments. |
| 2032 | 5.3% | A focus on circular economy principles reshapes component design and recycling strategies profoundly. |
Note - Market size estimations and growth projections presented in this report are based on 6Wresearch's advanced forecasting approach, validated with industry datasets as of June 2026.
Singapore Electronic Components Market Synopsis
The Singapore Electronic Components Market is projected to reach 4.9% and witness significant growth during the forecast period (2026-2032). This anticipated growth can largely be attributed to the increasing demand for consumer electronics and office automation products. A rising number of households in Singapore has spurred the purchase of advanced electronic devices, which in turn drives the demand for various electronic components. In addition, robust investments by major firms in research development (R&D) and technological advancements are expected to further enhance market growth. Government initiatives and supportive policies are also playing a crucial role in creating a conducive environment for the expansion of this market.
Singapore Electronic Components Market Growth Drivers
Several key factors are driving growth in the Singapore electronic components market:
- Growing Demand for Consumer Electronics: The rising purchasing power of consumers has led to increased purchases of high-tech electronic devices such as smartphones, tablets, and smart home gadgets. These devices require a variety of electronic components, including resistors and capacitors, thereby fueling market demand.
- Technological Advancements: Significant investments in R&D by leading companies have allowed for the development of high-quality electronic components. These innovations are tailored to meet the evolving needs of consumers, positively impacting market size.
- Government Initiatives: The Singaporean government's Industry Transformation Map initiative is designed to encourage innovation in the electronics sector. This initiative supports startups and provides financial assistance for research projects, which are vital for industry expansion.
- Urbanization and Population Growth: An increase in urbanization and population in Singapore contributes to higher demand for electronic components as the need for smart infrastructure and modern amenities rises.
- Focus on Sustainability: The growing emphasis on sustainable and energy-efficient technologies in consumer electronics is creating demand for advanced electronic components that adhere to eco-friendly standards.
Singapore Electronic Components Market Challenges and Restraints
Despite the positives, the Singapore electronic components market faces several challenges:
- Lack of Skilled Labor Force: The shortage of skilled professionals in the electronics sector, exacerbated by limited access to formal training programs, poses a significant challenge for companies striving to maintain operational efficiency.
- Supply Chain Disruptions: Global supply chain issues, particularly those arising from geopolitical tensions and pandemics, can lead to delays in production and distribution, hampering market growth.
- Technological Obsolescence: Rapid advancements in technology can render existing electronic components outdated, forcing companies to continuously innovate and adapt to remain competitive.
- Increasing Competition: The influx of new entrants in the electronic components market intensifies competition, which can affect profit margins for established companies.
- Regulatory Compliance: Stringent regulations concerning product standards and environmental impact require companies to invest in compliance measures, potentially increasing operational costs.
Singapore Electronic Components Market Government Investment and Initiatives
The government of Singapore is playing a pivotal role in shaping the electronic components market through its various investments and initiatives:
- The Industry Transformation Map aims to elevate the manufacturing sector, encouraging the adoption of new technologies and innovation in electronic components.
- Investment in infrastructure to support the electronics sector includes developing research hubs and encouraging collaboration between academia and industry.
- Financial assistance programs for startups and SMEs in the electronics industry promote entrepreneurship and innovation.
- Support for R&D initiatives that focus on sustainable and energy-efficient technologies is a significant aspect of government policy, fostering a greener electronic components market.
- Continuous improvement in policies related to foreign investment creates a welcoming environment for international firms looking to establish or expand operations in Singapore.
Singapore Electronic Components Market Latest Developments (May 2025 - June 2026)
Recent developments in the Singapore electronic components market have showcased growing dynamism and adaptation in response to various trends:
- Companies are increasingly focusing on smart technologies and IoT integration, leading to innovations in electronic components tailored for smart devices.
- Collaborations and partnerships between domestic firms and international companies have strengthened R&D capabilities, allowing for enhanced product offerings.
- The government has announced new funding initiatives aimed at encouraging research into next-generation technologies, including AI and machine learning applications in electronics.
- Post-pandemic recovery strategies have been implemented, focusing on enhancing supply chain resilience and efficiency in manufacturing processes.
- A shift towards miniaturization and customization of electronic components to meet specific consumer demands has been noted as a growing trend within market players.
Singapore Electronic Components Market - Key Attractiveness of the Report
- 10 Years of Market Numbers
- Historical Data Starting from 2022 to 2025
- Base Year: 2025
- Forecast Data until 2032
- Key Performance Indicators Impacting the Market
- Major Upcoming Developments and Projects
Key Highlights of the Report:
- Singapore Electronic Components Market Outlook
- Market Size of Singapore Electronic Components Market, 2025
- Forecast of Singapore Electronic Components Market, 2032F
- Historical Data and Forecast of Singapore Electronic Components Revenues & Volume for the Period 2022-2032F
- Singapore Electronic Components Market Trend Evolution
- Singapore Electronic Components Market Drivers and Challenges
- Singapore Electronic Components Price Trends
- Singapore Electronic Components Porter's Five Forces
- Singapore Electronic Components Industry Life Cycle
- Historical Data and Forecast of Singapore Electronic Components Market Revenues & Volume By Types for the Period 2022-2032F
- Historical Data and Forecast of Singapore Electronic Components Market Revenues & Volume By Passive for the Period 2022-2032F
- Historical Data and Forecast of Singapore Electronic Components Market Revenues & Volume By Active for the Period 2022-2032F
- Historical Data and Forecast of Singapore Electronic Components Market Revenues & Volume By Electro Mechanic for the Period 2022-2032F
- Historical Data and Forecast of Singapore Electronic Components Market Revenues & Volume By Applications for the Period 2022-2032F
- Historical Data and Forecast of Singapore Electronic Components Market Revenues & Volume By Automotive for the Period 2022-2032F
- Historical Data and Forecast of Singapore Electronic Components Market Revenues & Volume By Communications for the Period 2022-2032F
- Historical Data and Forecast of Singapore Electronic Components Market Revenues & Volume By Industrial for the Period 2022-2032F
- Historical Data and Forecast of Singapore Electronic Components Market Revenues & Volume By Computing Applications for the Period 2022-2032F
- Historical Data and Forecast of Singapore Electronic Components Market Revenues & Volume By Others for the Period 2022-2032F
- Singapore Electronic Components Import Export Trade Statistics
- Market Opportunity Assessment By Types
- Market Opportunity Assessment By Applications
- Singapore Electronic Components Top Companies Market Share
- Singapore Electronic Components Competitive Benchmarking By Technical and Operational Parameters
- Singapore Electronic Components Company Profiles
- Singapore Electronic Components Key Strategic Recommendations
Frequently Asked Questions About the Market Study (FAQs):
The growth is driven by increasing demand for consumer electronics, technological advancements, government initiatives promoting innovation, urbanization, and a focus on sustainability.
Challenges include a lack of skilled labor, supply chain disruptions, technological obsolescence, increasing competition, and regulatory compliance costs.
The government supports the industry through initiatives such as the Industry Transformation Map, funding for R&D, and policies that foster a conducive environment for investment and innovation.
Recent trends include a focus on smart technologies, partnerships for enhanced R&D, a shift towards miniaturization of components, and adaptations in supply chain strategies post-pandemic.
6Wresearch actively monitors the Singapore Electronic Components Market and publishes its comprehensive annual report, highlighting emerging trends, growth drivers, revenue analysis, and forecast outlook. Our insights help businesses to make data-backed strategic decisions with ongoing market dynamics. Our analysts track relevent industries related to the Singapore Electronic Components Market, allowing our clients with actionable intelligence and reliable forecasts tailored to emerging regional needs.
Yes, we provide customisation as per your requirements. To learn more, feel free to contact us on sales@6wresearch.com
1 Executive Summary |
2 Introduction |
2.1 Key Highlights of the Report |
2.2 Report Description |
2.3 Market Scope & Segmentation |
2.4 Research Methodology |
2.5 Assumptions |
3 Singapore Electronic Components Market Overview |
3.1 Singapore Country Macro Economic Indicators |
3.2 Singapore Electronic Components Market Revenues & Volume, 2022 & 2032F |
3.3 Singapore Electronic Components Market - Industry Life Cycle |
3.4 Singapore Electronic Components Market - Porter's Five Forces |
3.5 Singapore Electronic Components Market Revenues & Volume Share, By Types, 2022 & 2032F |
3.6 Singapore Electronic Components Market Revenues & Volume Share, By Applications, 2022 & 2032F |
4 Singapore Electronic Components Market Dynamics |
4.1 Impact Analysis |
4.2 Market Drivers |
4.3 Market Restraints |
5 Singapore Electronic Components Market Trends |
6 Singapore Electronic Components Market, By Types |
6.1 Singapore Electronic Components Market, By Types |
6.1.1 Overview and Analysis |
6.1.2 Singapore Electronic Components Market Revenues & Volume, By Types, 2022-2032F |
6.1.3 Singapore Electronic Components Market Revenues & Volume, By Passive , 2022-2032F |
6.1.4 Singapore Electronic Components Market Revenues & Volume, By Active, 2022-2032F |
6.1.5 Singapore Electronic Components Market Revenues & Volume, By Electro Mechanic, 2022-2032F |
6.2 Singapore Electronic Components Market, By Applications |
6.2.1 Overview and Analysis |
6.2.2 Singapore Electronic Components Market Revenues & Volume, By Automotive, 2022-2032F |
6.2.3 Singapore Electronic Components Market Revenues & Volume, By Communications, 2022-2032F |
6.2.4 Singapore Electronic Components Market Revenues & Volume, By Industrial, 2022-2032F |
6.2.5 Singapore Electronic Components Market Revenues & Volume, By Computing Applications, 2022-2032F |
6.2.6 Singapore Electronic Components Market Revenues & Volume, By Others, 2022-2032F |
7 Singapore Electronic Components Market Import-Export Trade Statistics |
7.1 Singapore Electronic Components Market Export to Major Countries |
7.2 Singapore Electronic Components Market Imports from Major Countries |
8 Singapore Electronic Components Market Key Performance Indicators |
9 Singapore Electronic Components Market - Opportunity Assessment |
9.1 Singapore Electronic Components Market Opportunity Assessment, By Types, 2022 & 2032F |
9.2 Singapore Electronic Components Market Opportunity Assessment, By Applications, 2022 & 2032F |
10 Singapore Electronic Components Market - Competitive Landscape |
10.1 Singapore Electronic Components Market Revenue Share, By Companies, 2025 |
10.2 Singapore Electronic Components Market Competitive Benchmarking, By Operating and Technical Parameters |
11 Company Profiles |
12 Recommendations |
13 Disclaimer |
Global Go To Market Strategy - 2030
Export potential enables firms to identify high-growth global markets with greater confidence by combining advanced trade intelligence with a structured quantitative methodology. The framework analyzes emerging demand trends and country-level import patterns while integrating macroeconomic and trade datasets such as GDP and population forecasts, bilateral import–export flows, tariff structures, elasticity differentials between developed and developing economies, geographic distance, and import demand projections. Using weighted trade values from 2020–2024 as the base period to project country-to-country export potential for 2030, these inputs are operationalized through calculated drivers such as gravity model parameters, tariff impact factors, and projected GDP per-capita growth. Through an analysis of hidden potentials, demand hotspots, and market conditions that are most favorable to success, this method enables firms to focus on target countries, maximize returns, and global expansion with data, backed by accuracy.
By factoring in the projected importer demand gap that is currently unmet and could be potential opportunity, it identifies the potential for the Exporter (Country) among 190 countries, against the general trade analysis, which identifies the biggest importer or exporter.
To discover high-growth global markets and optimize your business strategy:
Click Here
Pricing
- Single User License$ 1,995
- Department License$ 2,400
- Site License$ 3,120
- Global License$ 3,795

Leadership Perspectives from Industry Events
Search
Thought Leadership and Analyst Meet


Our Clients
6WResearch In News
- India Air Conditioner Market Set for Strong Rebound in 2026 After Weather-Led Correction and GST-Driven Recovery: 6Wresearch
- ADAS in India: How Automatic Emergency Braking, Blind Spot Detection & Driver Monitoring are Transforming Road Safety
- Doha a strategic location for EV manufacturing hub: IPA Qatar
- Demand for luxury TVs surging in the GCC, says Samsung
- Empowering Growth: The Thriving Journey of Bangladesh’s Cable Industry
- Demand for luxury TVs surging in the GCC, says Samsung
Latest Reports
- Nicaragua RPG Gaming Market (2026-2032)
- New Zealand RPG Gaming Market (2026-2032)
- Netherlands RPG Gaming Market (2026-2032)
- Nauru RPG Gaming Market (2026-2032)
- Namibia RPG Gaming Market (2026-2032)
- Mozambique RPG Gaming Market (2026-2032)
- Montenegro RPG Gaming Market (2026-2032)
- Mongolia RPG Gaming Market (2026-2032)
- Monaco RPG Gaming Market (2026-2032)
- Micronesia RPG Gaming Market (2026-2032)
Industry Events and Analyst Meet

HIMTEX 2026

India Refining Summit 2026

India EV Show 2026

EV tech India Expo 2026

Auto Tech Asia 2026
Whitepaper
- Middle East & Africa Commercial Security Market Click here to view more.
- Middle East & Africa Fire Safety Systems & Equipment Market Click here to view more.
- GCC Drone Market Click here to view more.
- Middle East Lighting Fixture Market Click here to view more.
- GCC Physical & Perimeter Security Market Click here to view more.