Slovakia Chlorothalonil Market (2026-2032) | Industry, Value, Size & Revenue, Share, Outlook, Companies, Trends, Competitive Landscape, Analysis, Forecast, Growth, Segmentation
Market Forecast By Type (98% Chlorothalonil, 96% Chlorothalonil, 90% Chlorothalonil), By Product (Wettable Powder, Suspended Agents, Others (Granular & Dilute)), By Crop Type (Vegetables & Fruits, Oilseeds & Pulses, Turfs & Ornamentals, Cereals & Grains) And Competitive Landscape
| Product Code: ETC9291825 | Publication Date: Sep 2024 | Updated Date: Apr 2026 | Product Type: Market Research Report | |
| Publisher: 6Wresearch | Author: Summon Dutta | No. of Pages: 75 | No. of Figures: 35 | No. of Tables: 20 |
Slovakia Chlorothalonil Market Size (2020-2030)
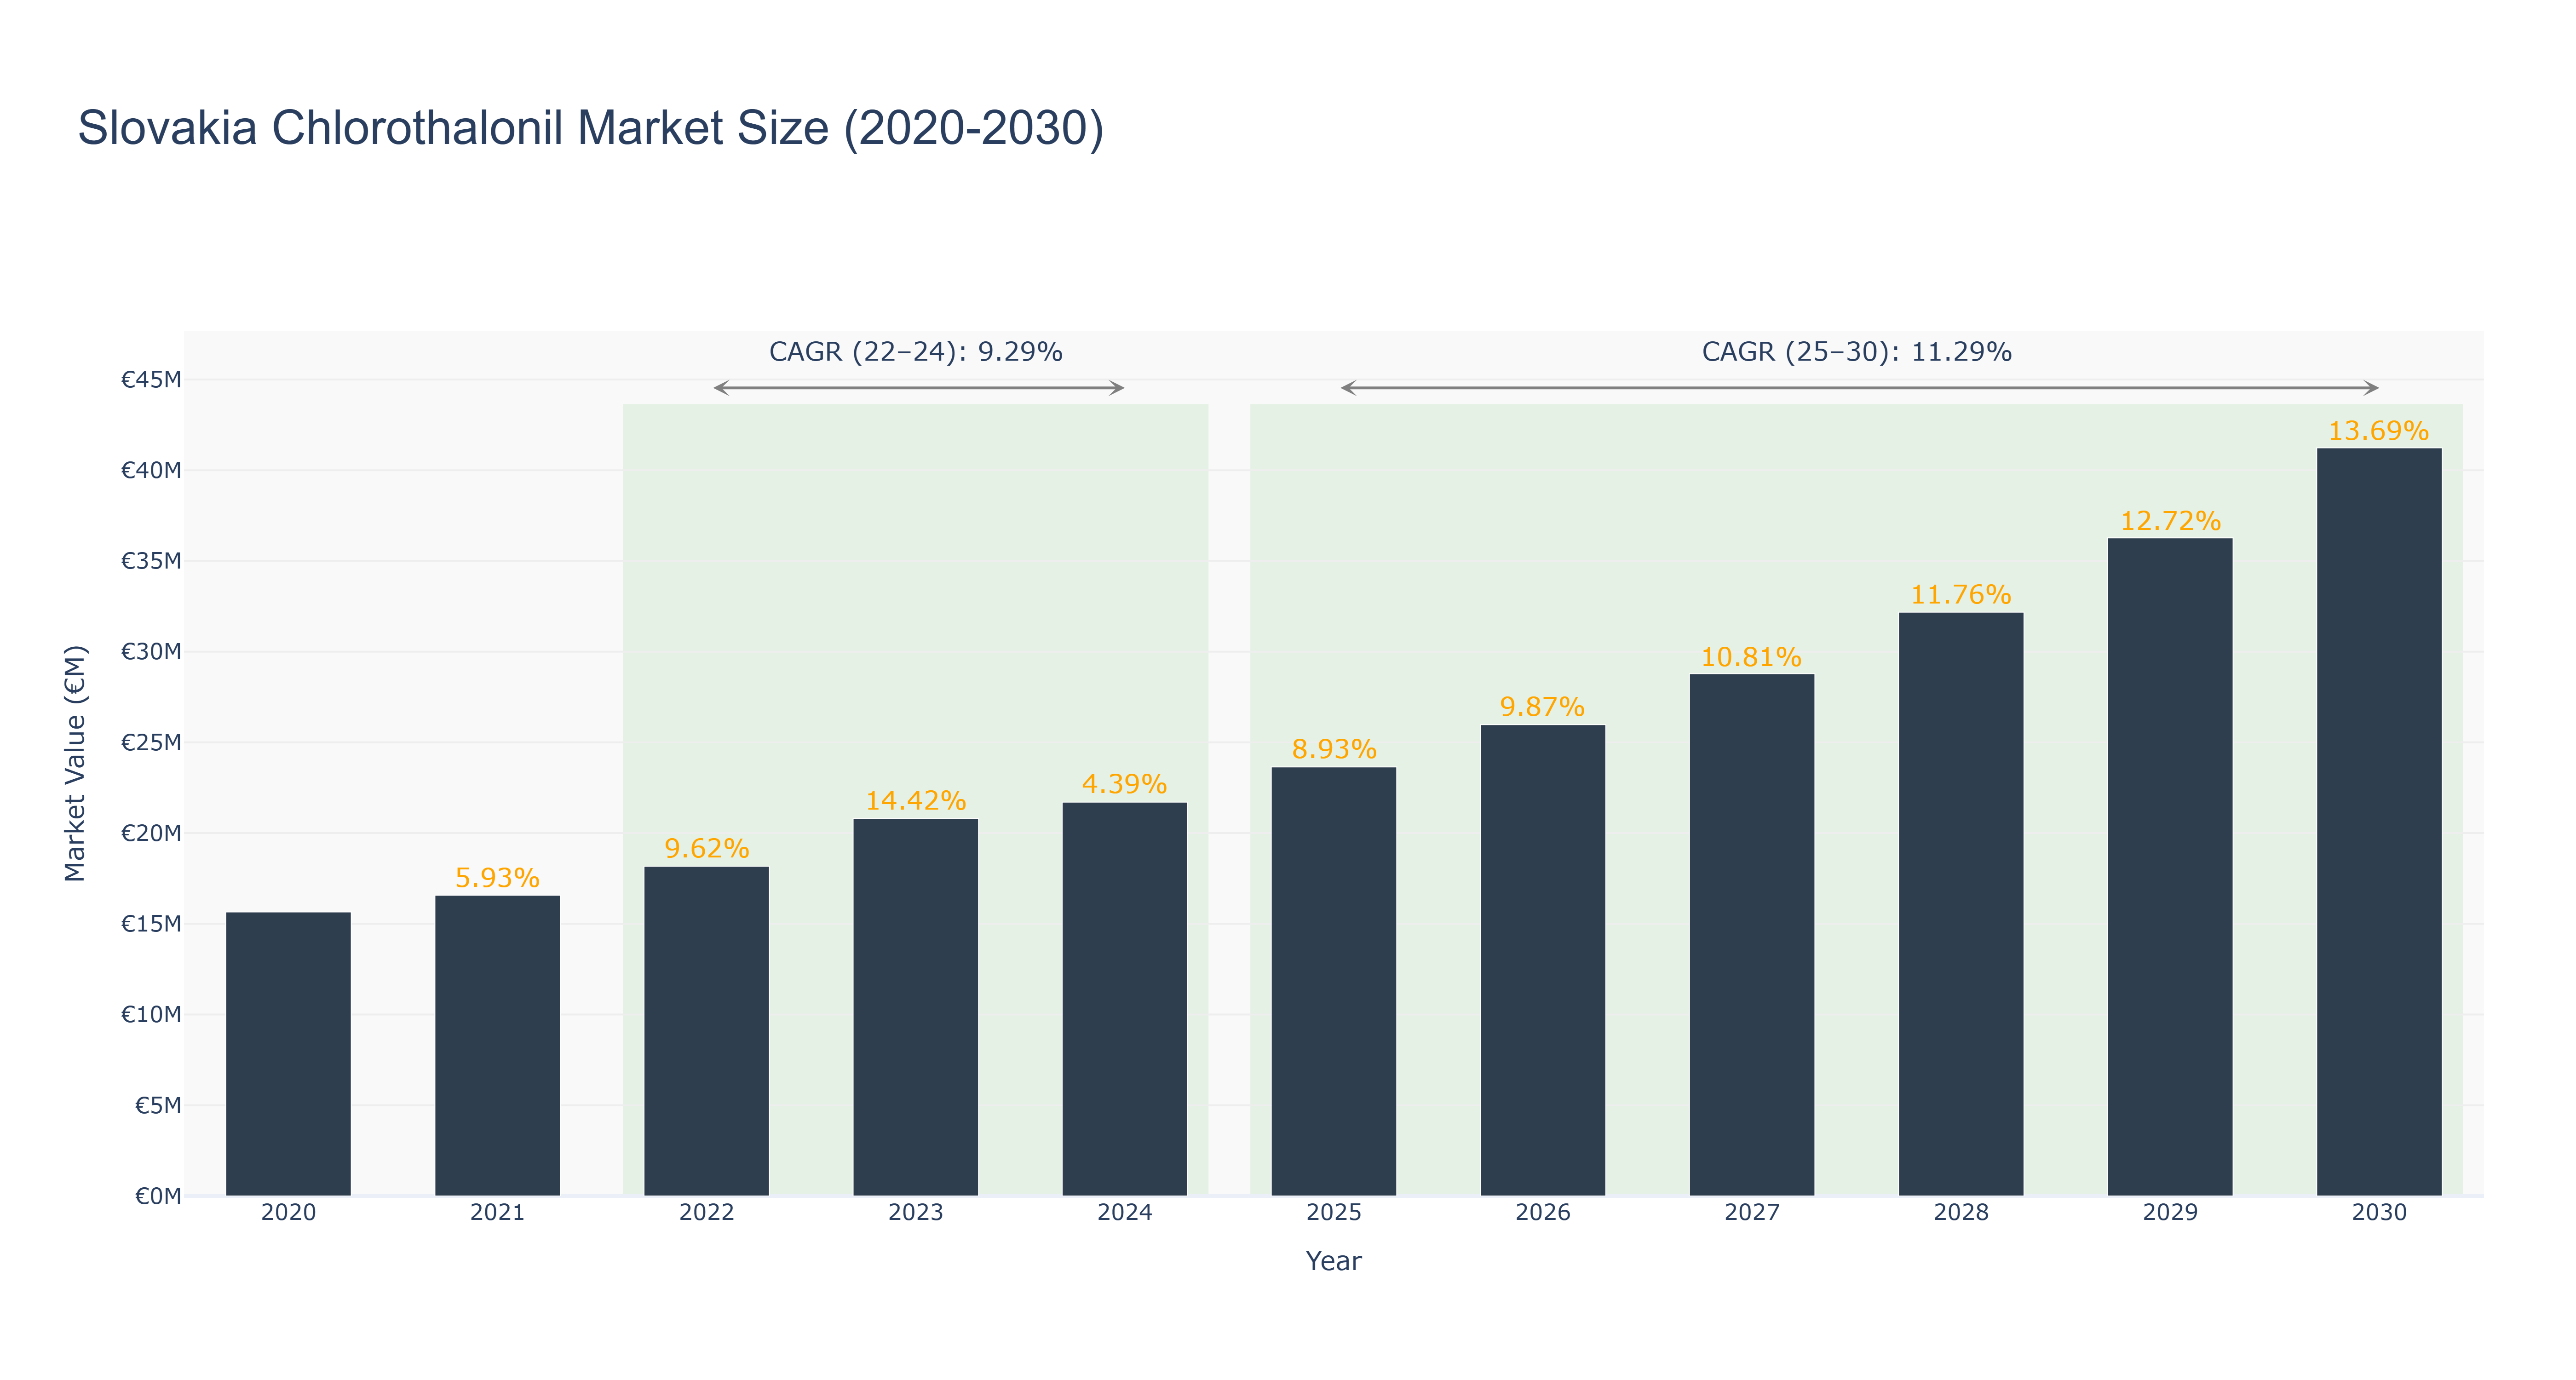
Slovakia Chlorothalonil Market has shown a steady growth trajectory from 2020 to 2030. The peak market size of €41.23 million is forecasted in 2030, with a notable increase in market size from €18.18 million in 2022 to €41.23 million in 2030. The CAGR values reflect this growth, with a CAGR of 9.29% from 2022 to 2024 and a higher CAGR of 11.29% from 2025 to 2030. The market's growth can be attributed to increasing demand for chlorothalonil-based products in agriculture due to their effectiveness in crop protection. Looking ahead, Slovakia is set to introduce new regulations promoting sustainable agriculture practices, which is expected to further drive market growth in the coming years. This market trend indicates a promising future for the Slovakia Chlorothalonil Market.
Slovakia Chlorothalonil Market: Production & Trade Performance (2019-2025)
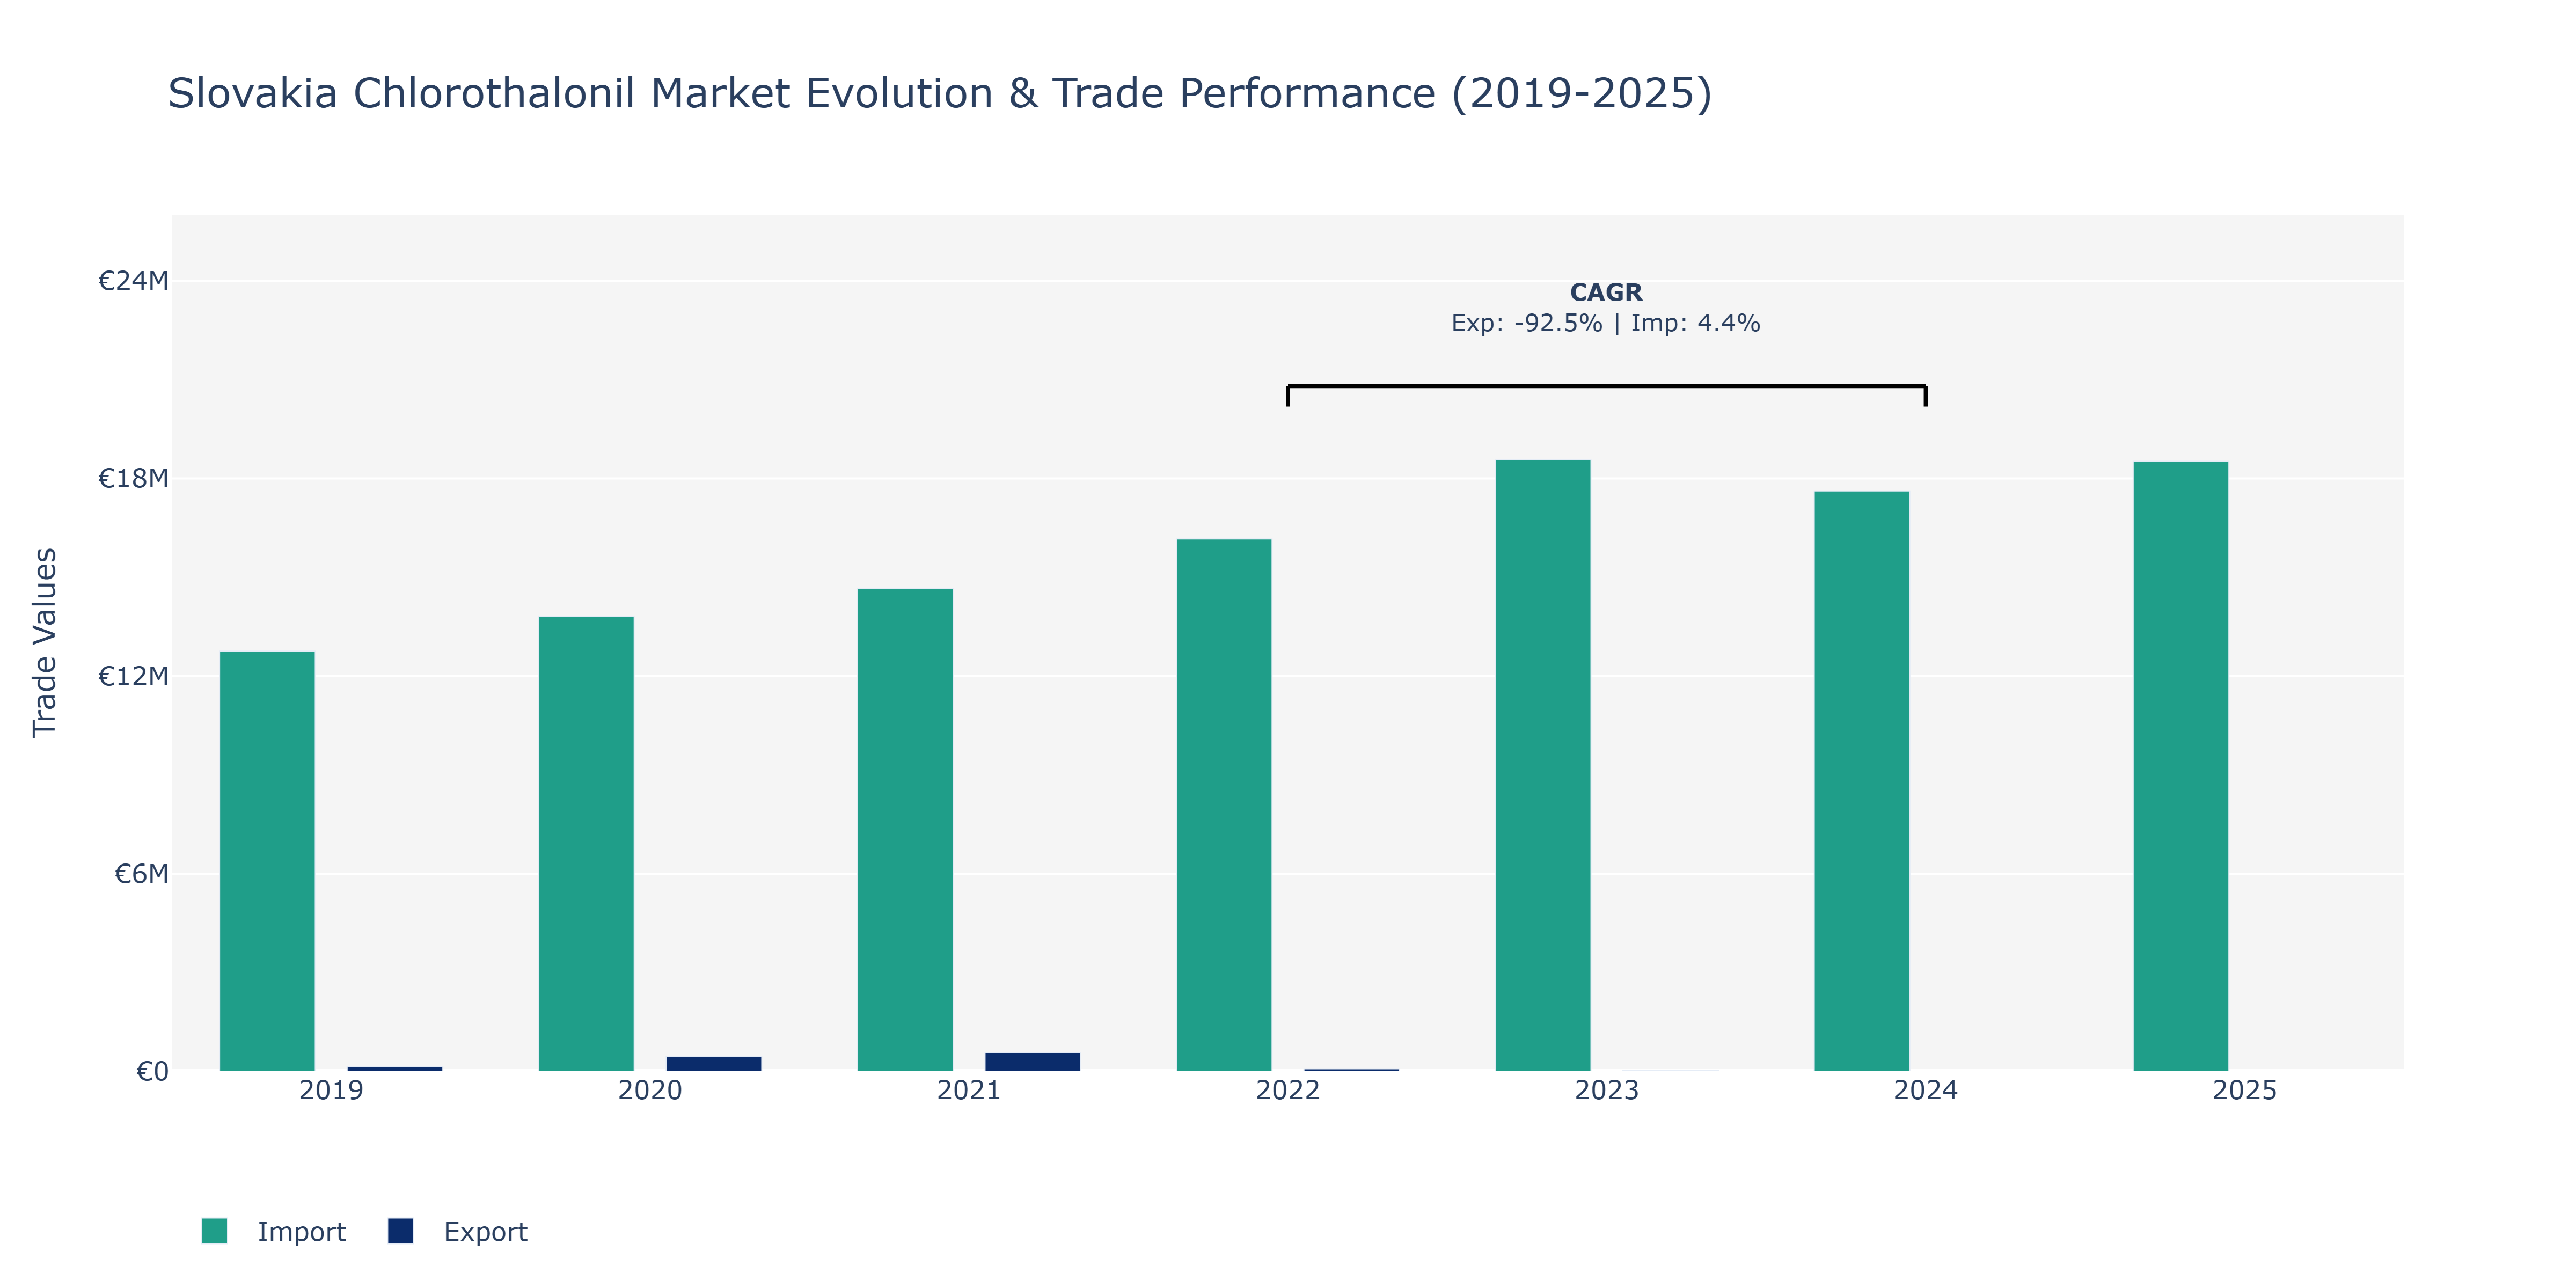
Between 2019 and 2025, Slovakia's Chlorothalonil market saw varying trends in exports and imports. Exports experienced a notable fluctuation, starting at €134.92 thousand in 2019, peaking at €553.68 thousand in 2021, and then decreasing significantly to €315 thousand in 2025. In contrast, imports consistently increased from €12.76 million in 2019 to €18.52 million in 2025. Notably, 2021 marked the peak year for exports, while imports steadily rose year over year. The decline in exports could be attributed to fluctuating global demand for Chlorothalonil products, influenced by factors like changing agricultural practices, regulatory shifts, and increasing environmental concerns driving the need for alternative solutions. Conversely, the steady rise in imports reflects a growing reliance on foreign sources to meet domestic demand, possibly due to insufficient local production capacity or cost-effectiveness issues. These trends highlight the market's sensitivity to external dynamics and the importance of strategic planning to navigate market volatilities effectively.
Key Highlights of the Report:
- Slovakia Chlorothalonil Market Outlook
- Market Size of Slovakia Chlorothalonil Market, 2025
- Forecast of Slovakia Chlorothalonil Market, 2032
- Historical Data and Forecast of Slovakia Chlorothalonil Revenues & Volume for the Period 2022 - 2032
- Slovakia Chlorothalonil Market Trend Evolution
- Slovakia Chlorothalonil Market Drivers and Challenges
- Slovakia Chlorothalonil Price Trends
- Slovakia Chlorothalonil Porter's Five Forces
- Slovakia Chlorothalonil Industry Life Cycle
- Historical Data and Forecast of Slovakia Chlorothalonil Market Revenues & Volume By Type for the Period 2022 - 2032
- Historical Data and Forecast of Slovakia Chlorothalonil Market Revenues & Volume By 98% Chlorothalonil for the Period 2022 - 2032
- Historical Data and Forecast of Slovakia Chlorothalonil Market Revenues & Volume By 96% Chlorothalonil for the Period 2022 - 2032
- Historical Data and Forecast of Slovakia Chlorothalonil Market Revenues & Volume By 90% Chlorothalonil for the Period 2022 - 2032
- Historical Data and Forecast of Slovakia Chlorothalonil Market Revenues & Volume By Product for the Period 2022 - 2032
- Historical Data and Forecast of Slovakia Chlorothalonil Market Revenues & Volume By Wettable Powder for the Period 2022 - 2032
- Historical Data and Forecast of Slovakia Chlorothalonil Market Revenues & Volume By Suspended Agents for the Period 2022 - 2032
- Historical Data and Forecast of Slovakia Chlorothalonil Market Revenues & Volume By Others (Granular & Dilute) for the Period 2022 - 2032
- Historical Data and Forecast of Slovakia Chlorothalonil Market Revenues & Volume By Crop Type for the Period 2022 - 2032
- Historical Data and Forecast of Slovakia Chlorothalonil Market Revenues & Volume By Vegetables & Fruits for the Period 2022 - 2032
- Historical Data and Forecast of Slovakia Chlorothalonil Market Revenues & Volume By Oilseeds & Pulses for the Period 2022 - 2032
- Historical Data and Forecast of Slovakia Chlorothalonil Market Revenues & Volume By Turfs & Ornamentals for the Period 2022 - 2032
- Historical Data and Forecast of Slovakia Chlorothalonil Market Revenues & Volume By Cereals & Grains for the Period 2022 - 2032
- Slovakia Chlorothalonil Import Export Trade Statistics
- Market Opportunity Assessment By Type
- Market Opportunity Assessment By Product
- Market Opportunity Assessment By Crop Type
- Slovakia Chlorothalonil Top Companies Market Share
- Slovakia Chlorothalonil Competitive Benchmarking By Technical and Operational Parameters
- Slovakia Chlorothalonil Company Profiles
- Slovakia Chlorothalonil Key Strategic Recommendations
Frequently Asked Questions About the Market Study (FAQs):
6Wresearch actively monitors the Slovakia Chlorothalonil Market and publishes its comprehensive annual report, highlighting emerging trends, growth drivers, revenue analysis, and forecast outlook. Our insights help businesses to make data-backed strategic decisions with ongoing market dynamics. Our analysts track relevent industries related to the Slovakia Chlorothalonil Market, allowing our clients with actionable intelligence and reliable forecasts tailored to emerging regional needs.
Yes, we provide customisation as per your requirements. To learn more, feel free to contact us on sales@6wresearch.com
1 Executive Summary |
2 Introduction |
2.1 Key Highlights of the Report |
2.2 Report Description |
2.3 Market Scope & Segmentation |
2.4 Research Methodology |
2.5 Assumptions |
3 Slovakia Chlorothalonil Market Overview |
3.1 Slovakia Country Macro Economic Indicators |
3.2 Slovakia Chlorothalonil Market Revenues & Volume, 2022 & 2032F |
3.3 Slovakia Chlorothalonil Market - Industry Life Cycle |
3.4 Slovakia Chlorothalonil Market - Porter's Five Forces |
3.5 Slovakia Chlorothalonil Market Revenues & Volume Share, By Type, 2022 & 2032F |
3.6 Slovakia Chlorothalonil Market Revenues & Volume Share, By Product, 2022 & 2032F |
3.7 Slovakia Chlorothalonil Market Revenues & Volume Share, By Crop Type, 2022 & 2032F |
4 Slovakia Chlorothalonil Market Dynamics |
4.1 Impact Analysis |
4.2 Market Drivers |
4.3 Market Restraints |
5 Slovakia Chlorothalonil Market Trends |
6 Slovakia Chlorothalonil Market, By Types |
6.1 Slovakia Chlorothalonil Market, By Type |
6.1.1 Overview and Analysis |
6.1.2 Slovakia Chlorothalonil Market Revenues & Volume, By Type, 2022 - 2032F |
6.1.3 Slovakia Chlorothalonil Market Revenues & Volume, By 98% Chlorothalonil, 2022 - 2032F |
6.1.4 Slovakia Chlorothalonil Market Revenues & Volume, By 96% Chlorothalonil, 2022 - 2032F |
6.1.5 Slovakia Chlorothalonil Market Revenues & Volume, By 90% Chlorothalonil, 2022 - 2032F |
6.2 Slovakia Chlorothalonil Market, By Product |
6.2.1 Overview and Analysis |
6.2.2 Slovakia Chlorothalonil Market Revenues & Volume, By Wettable Powder, 2022 - 2032F |
6.2.3 Slovakia Chlorothalonil Market Revenues & Volume, By Suspended Agents, 2022 - 2032F |
6.2.4 Slovakia Chlorothalonil Market Revenues & Volume, By Others (Granular & Dilute), 2022 - 2032F |
6.3 Slovakia Chlorothalonil Market, By Crop Type |
6.3.1 Overview and Analysis |
6.3.2 Slovakia Chlorothalonil Market Revenues & Volume, By Vegetables & Fruits, 2022 - 2032F |
6.3.3 Slovakia Chlorothalonil Market Revenues & Volume, By Oilseeds & Pulses, 2022 - 2032F |
6.3.4 Slovakia Chlorothalonil Market Revenues & Volume, By Turfs & Ornamentals, 2022 - 2032F |
6.3.5 Slovakia Chlorothalonil Market Revenues & Volume, By Cereals & Grains, 2022 - 2032F |
7 Slovakia Chlorothalonil Market Import-Export Trade Statistics |
7.1 Slovakia Chlorothalonil Market Export to Major Countries |
7.2 Slovakia Chlorothalonil Market Imports from Major Countries |
8 Slovakia Chlorothalonil Market Key Performance Indicators |
9 Slovakia Chlorothalonil Market - Opportunity Assessment |
9.1 Slovakia Chlorothalonil Market Opportunity Assessment, By Type, 2022 & 2032F |
9.2 Slovakia Chlorothalonil Market Opportunity Assessment, By Product, 2022 & 2032F |
9.3 Slovakia Chlorothalonil Market Opportunity Assessment, By Crop Type, 2022 & 2032F |
10 Slovakia Chlorothalonil Market - Competitive Landscape |
10.1 Slovakia Chlorothalonil Market Revenue Share, By Companies, 2025 |
10.2 Slovakia Chlorothalonil Market Competitive Benchmarking, By Operating and Technical Parameters |
11 Company Profiles |
12 Recommendations |
13 Disclaimer |
Global Go To Market Strategy - 2030
Export potential enables firms to identify high-growth global markets with greater confidence by combining advanced trade intelligence with a structured quantitative methodology. The framework analyzes emerging demand trends and country-level import patterns while integrating macroeconomic and trade datasets such as GDP and population forecasts, bilateral import–export flows, tariff structures, elasticity differentials between developed and developing economies, geographic distance, and import demand projections. Using weighted trade values from 2020–2024 as the base period to project country-to-country export potential for 2030, these inputs are operationalized through calculated drivers such as gravity model parameters, tariff impact factors, and projected GDP per-capita growth. Through an analysis of hidden potentials, demand hotspots, and market conditions that are most favorable to success, this method enables firms to focus on target countries, maximize returns, and global expansion with data, backed by accuracy.
By factoring in the projected importer demand gap that is currently unmet and could be potential opportunity, it identifies the potential for the Exporter (Country) among 190 countries, against the general trade analysis, which identifies the biggest importer or exporter.
To discover high-growth global markets and optimize your business strategy:
Click Here
Pricing
- Single User License$ 1,995
- Department License$ 2,400
- Site License$ 3,120
- Global License$ 3,795

Leadership Perspectives from Industry Events
Search
Thought Leadership and Analyst Meet


Our Clients
6WResearch In News
- India Export Attractiveness Tracker 2026
- India Air Conditioner Market Set for Strong Rebound in 2026 After Weather-Led Correction and GST-Driven Recovery: 6Wresearch
- ADAS in India: How Automatic Emergency Braking, Blind Spot Detection & Driver Monitoring are Transforming Road Safety
- Doha a strategic location for EV manufacturing hub: IPA Qatar
- Demand for luxury TVs surging in the GCC, says Samsung
- Empowering Growth: The Thriving Journey of Bangladesh’s Cable Industry
Latest Reports
- Nicaragua RPG Gaming Market (2026-2032)
- New Zealand RPG Gaming Market (2026-2032)
- Netherlands RPG Gaming Market (2026-2032)
- Nauru RPG Gaming Market (2026-2032)
- Namibia RPG Gaming Market (2026-2032)
- Mozambique RPG Gaming Market (2026-2032)
- Montenegro RPG Gaming Market (2026-2032)
- Mongolia RPG Gaming Market (2026-2032)
- Monaco RPG Gaming Market (2026-2032)
- Micronesia RPG Gaming Market (2026-2032)
Industry Events and Analyst Meet

EV India Expo 2026

HIMTEX 2026

India Refining Summit 2026

India EV Show 2026

EV tech India Expo 2026
Whitepaper
- Middle East & Africa Commercial Security Market Click here to view more.
- Middle East & Africa Fire Safety Systems & Equipment Market Click here to view more.
- GCC Drone Market Click here to view more.
- Middle East Lighting Fixture Market Click here to view more.
- GCC Physical & Perimeter Security Market Click here to view more.