Slovakia Inorganic Chemicals Market (2026-2032) Outlook | Growth, Companies, Industry, Share, Forecast, Trends, Size, Value, Analysis & Revenue
Market Forecast By Type (Ammonia, Chlor alkali, Ammonium nitrate, Ammonium sulfate, Inorganic acid, Sodium hydroxide, Hydrogen peroxide, Oxygen) And Competitive Landscape
| Product Code: ETC329420 | Publication Date: Aug 2022 | Updated Date: Apr 2026 | Product Type: Market Research Report | |
| Publisher: 6Wresearch | Author: Ravi Bhandari | No. of Pages: 75 | No. of Figures: 35 | No. of Tables: 20 |
Slovakia Inorganic Chemicals Market Size (2020-2030)
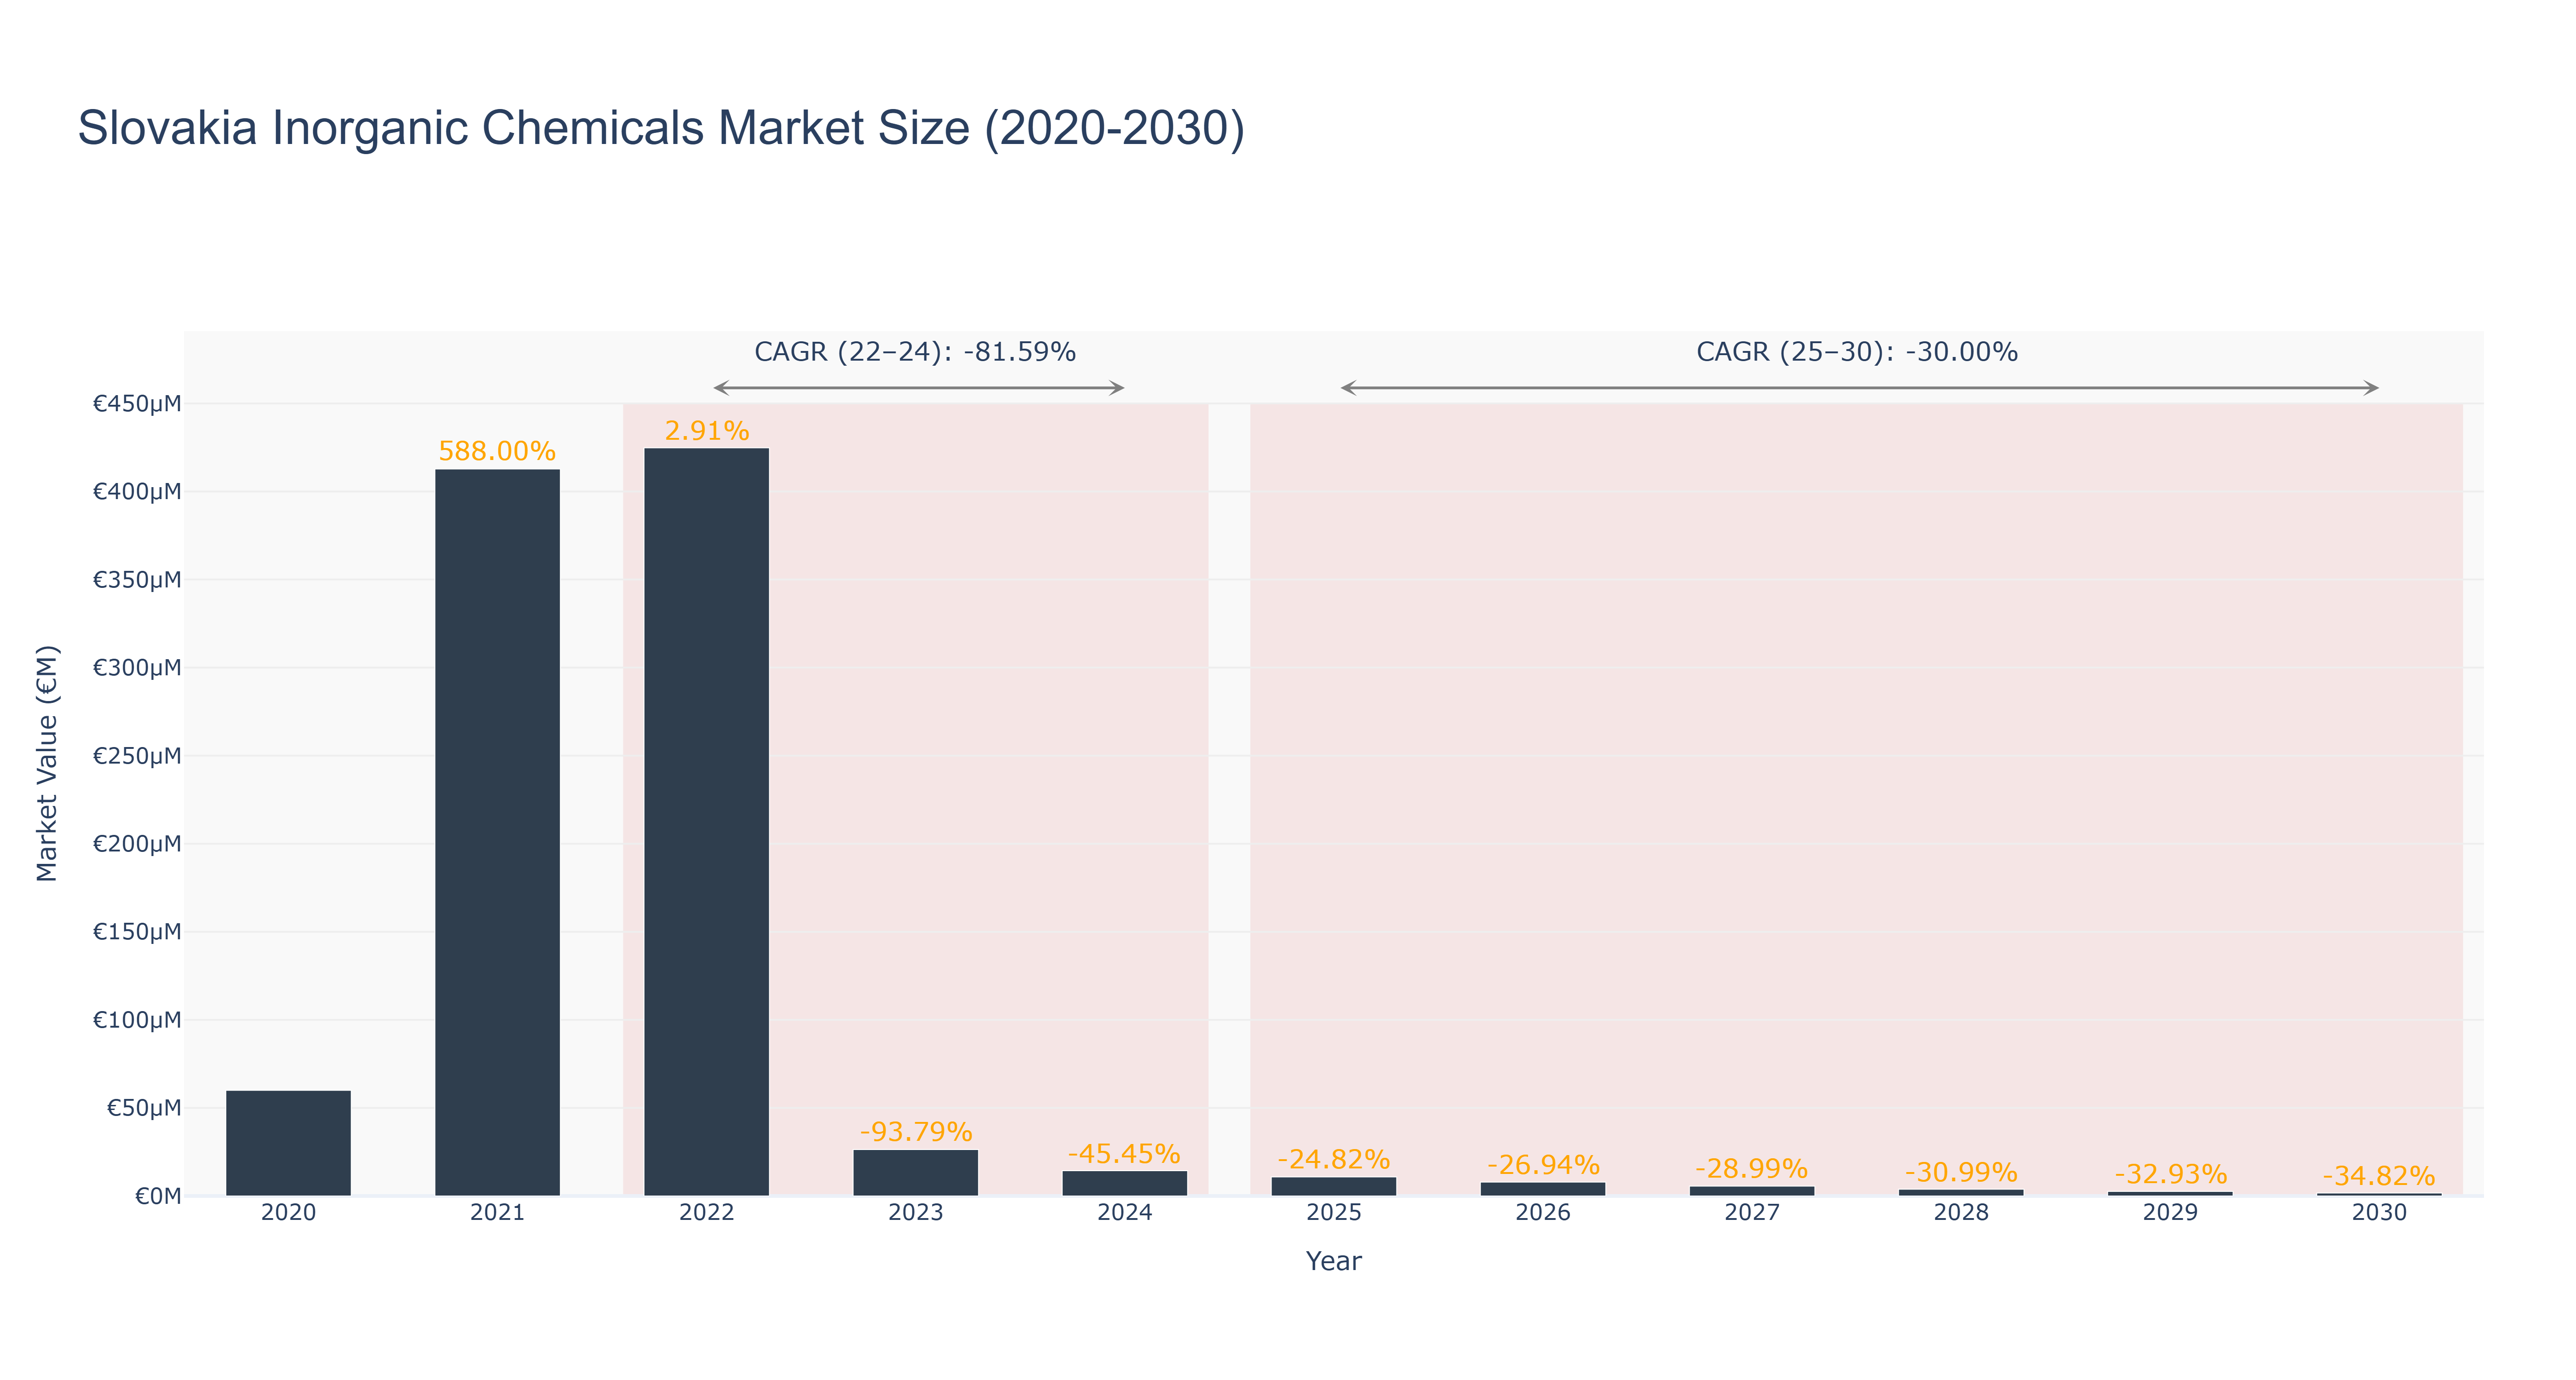
The Slovakia Inorganic Chemicals Market has experienced a dramatic decline following a peak in 2021, where the market size surged to €412.80 million, reflecting an extraordinary growth rate of 588.00%. However, actual market sizes plummeted to €26.40 million in 2023 and further decreased to €14.40 million in 2024, resulting in a compounded annual growth rate (CAGR) of -81.59% from 2022 to 2024. The forecasted period from 2025 to 2030 indicates continued contraction, with projected market sizes dwindling to €1.69 million by 2030, reflecting a CAGR of -30.00%. This decline can be attributed to factors such as reduced demand, increased competition, and potential regulatory challenges impacting production. Without significant investment or innovation in the sector, the outlook remains bleak, as macroeconomic pressures and shifts in consumer preferences continue to shape the market dynamics.
Slovakia Inorganic Chemicals Market: Production & Trade Performance (2019-2025)
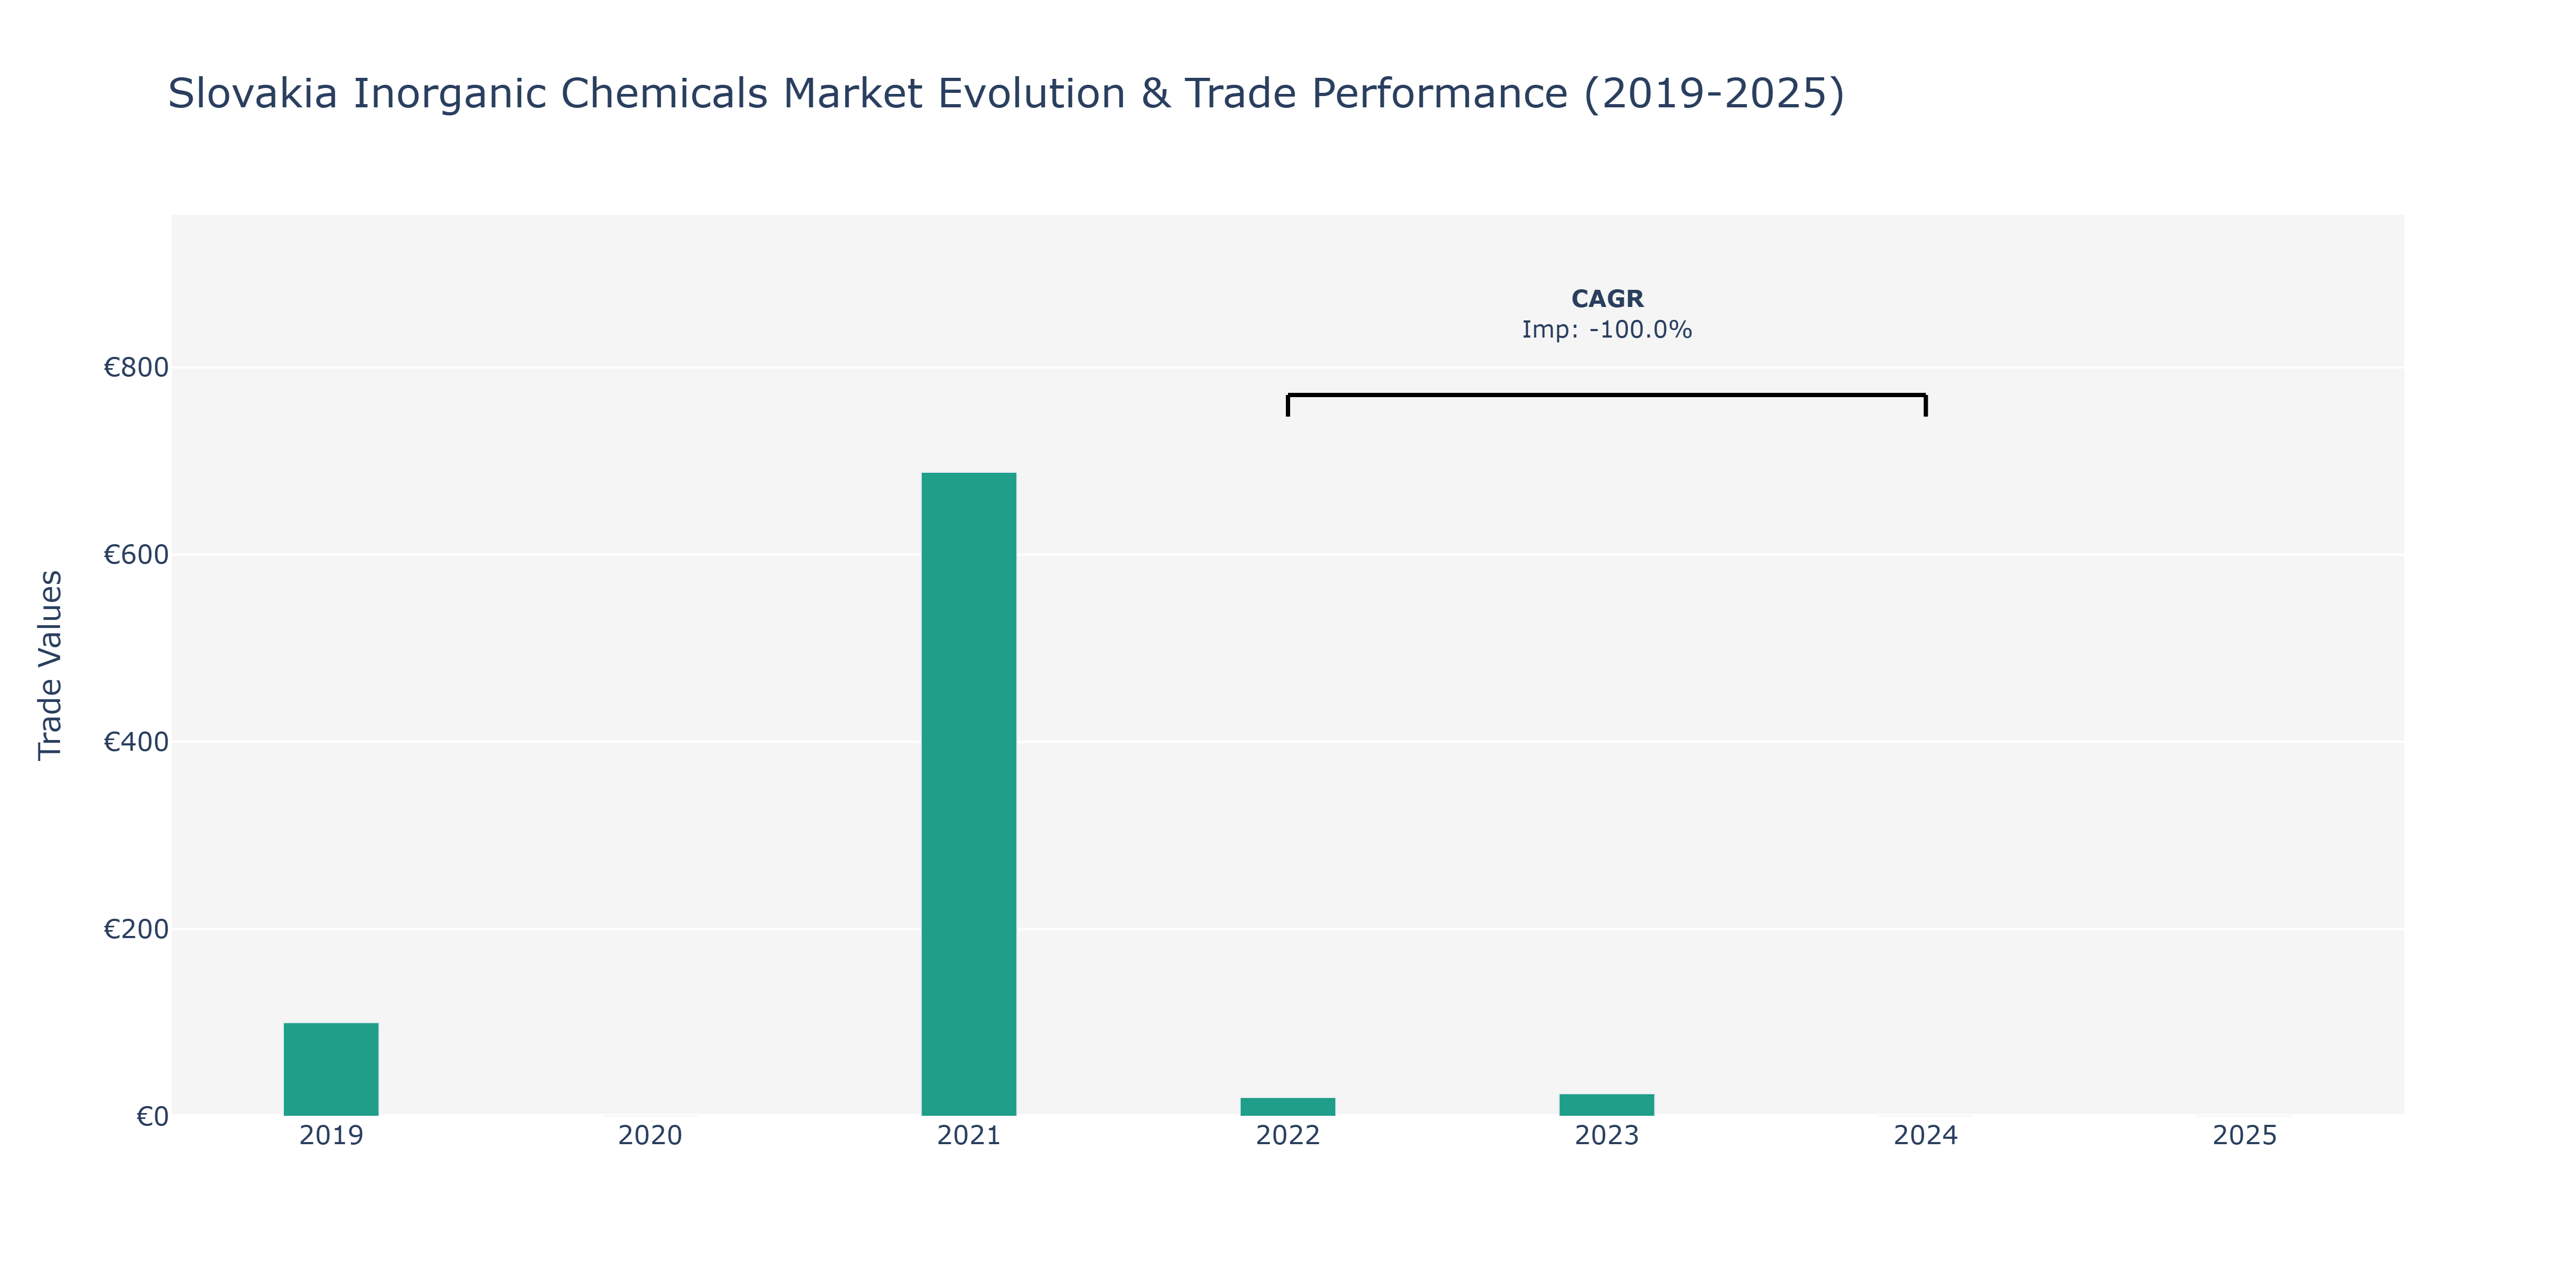
Between 2019 and 2021, imports of inorganic chemicals in Slovakia surged from €100 million to €688 million, marking a substantial increase. However, a sharp decline was observed in 2022, dropping to €20 million. This significant decrease could be attributed to various factors such as changes in regulatory policies, fluctuating demand from key industries, or disruptions in the global supply chain affecting import volumes. In 2023, imports slightly recovered to €24 million, indicating a possible stabilization in the market. The drastic fluctuations in import values highlight the market's sensitivity to external factors and the need for businesses to adapt quickly to changing conditions. With such volatility, stakeholders in the Slovakia Inorganic Chemicals Market must stay agile and closely monitor market dynamics to mitigate risks and capitalize on emerging opportunities.
Key Highlights of the Report:
- Slovakia Inorganic Chemicals Market Outlook
- Market Size of Slovakia Inorganic Chemicals Market, 2025
- Forecast of Slovakia Inorganic Chemicals Market, 2032
- Historical Data and Forecast of Slovakia Inorganic Chemicals Revenues & Volume for the Period 2022 - 2032F
- Slovakia Inorganic Chemicals Market Trend Evolution
- Slovakia Inorganic Chemicals Market Drivers and Challenges
- Slovakia Inorganic Chemicals Price Trends
- Slovakia Inorganic Chemicals Porter's Five Forces
- Slovakia Inorganic Chemicals Industry Life Cycle
- Historical Data and Forecast of Slovakia Inorganic Chemicals Market Revenues & Volume By Type for the Period 2022 - 2032F
- Historical Data and Forecast of Slovakia Inorganic Chemicals Market Revenues & Volume By Ammonia for the Period 2022 - 2032F
- Historical Data and Forecast of Slovakia Inorganic Chemicals Market Revenues & Volume By Chlor alkali for the Period 2022 - 2032F
- Historical Data and Forecast of Slovakia Inorganic Chemicals Market Revenues & Volume By Ammonium nitrate for the Period 2022 - 2032F
- Historical Data and Forecast of Slovakia Inorganic Chemicals Market Revenues & Volume By Ammonium sulfate for the Period 2022 - 2032F
- Historical Data and Forecast of Slovakia Inorganic Chemicals Market Revenues & Volume By Inorganic acid for the Period 2022 - 2032F
- Historical Data and Forecast of Slovakia Inorganic Chemicals Market Revenues & Volume By Sodium hydroxide for the Period 2022 - 2032F
- Historical Data and Forecast of Slovakia Inorganic Chemicals Market Revenues & Volume By Hydrogen peroxide for the Period 2022 - 2032F
- Historical Data and Forecast of Slovakia Ammonia Inorganic Chemicals Market Revenues & Volume By Oxygen for the Period 2022 - 2032F
- Slovakia Inorganic Chemicals Import Export Trade Statistics
- Market Opportunity Assessment By Type
- Slovakia Inorganic Chemicals Top Companies Market Share
- Slovakia Inorganic Chemicals Competitive Benchmarking By Technical and Operational Parameters
- Slovakia Inorganic Chemicals Company Profiles
- Slovakia Inorganic Chemicals Key Strategic Recommendations
Frequently Asked Questions About the Market Study (FAQs):
6Wresearch actively monitors the Slovakia Inorganic Chemicals Market and publishes its comprehensive annual report, highlighting emerging trends, growth drivers, revenue analysis, and forecast outlook. Our insights help businesses to make data-backed strategic decisions with ongoing market dynamics. Our analysts track relevent industries related to the Slovakia Inorganic Chemicals Market, allowing our clients with actionable intelligence and reliable forecasts tailored to emerging regional needs.
Yes, we provide customisation as per your requirements. To learn more, feel free to contact us on sales@6wresearch.com
1 Executive Summary |
2 Introduction |
2.1 Key Highlights of the Report |
2.2 Report Description |
2.3 Market Scope & Segmentation |
2.4 Research Methodology |
2.5 Assumptions |
3 Slovakia Inorganic Chemicals Market Overview |
3.1 Slovakia Country Macro Economic Indicators |
3.2 Slovakia Inorganic Chemicals Market Revenues & Volume, 2022 & 2032F |
3.3 Slovakia Inorganic Chemicals Market - Industry Life Cycle |
3.4 Slovakia Inorganic Chemicals Market - Porter's Five Forces |
3.5 Slovakia Inorganic Chemicals Market Revenues & Volume Share, By Type, 2022 & 2032F |
4 Slovakia Inorganic Chemicals Market Dynamics |
4.1 Impact Analysis |
4.2 Market Drivers |
4.2.1 Increasing demand for inorganic chemicals in various industries such as agriculture, construction, and automotive sectors. |
4.2.2 Growing investments in research and development to enhance the quality and efficiency of inorganic chemicals production. |
4.2.3 Favorable government regulations and policies supporting the growth of the inorganic chemicals market in Slovakia. |
4.3 Market Restraints |
4.3.1 Fluctuating raw material prices impacting the overall production cost of inorganic chemicals. |
4.3.2 Environmental concerns and regulations regarding the use and disposal of certain inorganic chemicals. |
4.3.3 Intense competition from international players in the global market affecting the market share of local inorganic chemical manufacturers in Slovakia. |
5 Slovakia Inorganic Chemicals Market Trends |
6 Slovakia Inorganic Chemicals Market, By Types |
6.1 Slovakia Inorganic Chemicals Market, By Type |
6.1.1 Overview and Analysis |
6.1.2 Slovakia Inorganic Chemicals Market Revenues & Volume, By Type, 2022 - 2032F |
6.1.3 Slovakia Inorganic Chemicals Market Revenues & Volume, By Ammonia, 2022 - 2032F |
6.1.4 Slovakia Inorganic Chemicals Market Revenues & Volume, By Chlor alkali, 2022 - 2032F |
6.1.5 Slovakia Inorganic Chemicals Market Revenues & Volume, By Ammonium nitrate, 2022 - 2032F |
6.1.6 Slovakia Inorganic Chemicals Market Revenues & Volume, By Ammonium sulfate, 2022 - 2032F |
6.1.7 Slovakia Inorganic Chemicals Market Revenues & Volume, By Inorganic acid, 2022 - 2032F |
6.1.8 Slovakia Inorganic Chemicals Market Revenues & Volume, By Sodium hydroxide, 2022 - 2032F |
6.1.9 Slovakia Inorganic Chemicals Market Revenues & Volume, By Oxygen, 2022 - 2032F |
6.1.10 Slovakia Inorganic Chemicals Market Revenues & Volume, By Oxygen, 2022 - 2032F |
7 Slovakia Inorganic Chemicals Market Import-Export Trade Statistics |
7.1 Slovakia Inorganic Chemicals Market Export to Major Countries |
7.2 Slovakia Inorganic Chemicals Market Imports from Major Countries |
8 Slovakia Inorganic Chemicals Market Key Performance Indicators |
8.1 Research and development investment in new inorganic chemicals formulations. |
8.2 Adoption rate of innovative production technologies in the inorganic chemicals industry. |
8.3 Environmental sustainability metrics such as waste reduction and recycling rates in inorganic chemicals production processes. |
9 Slovakia Inorganic Chemicals Market - Opportunity Assessment |
9.1 Slovakia Inorganic Chemicals Market Opportunity Assessment, By Type, 2022 & 2032F |
10 Slovakia Inorganic Chemicals Market - Competitive Landscape |
10.1 Slovakia Inorganic Chemicals Market Revenue Share, By Companies, 2025 |
10.2 Slovakia Inorganic Chemicals Market Competitive Benchmarking, By Operating and Technical Parameters |
11 Company Profiles |
12 Recommendations |
13 Disclaimer |
Global Go To Market Strategy - 2030
Export potential enables firms to identify high-growth global markets with greater confidence by combining advanced trade intelligence with a structured quantitative methodology. The framework analyzes emerging demand trends and country-level import patterns while integrating macroeconomic and trade datasets such as GDP and population forecasts, bilateral import–export flows, tariff structures, elasticity differentials between developed and developing economies, geographic distance, and import demand projections. Using weighted trade values from 2020–2024 as the base period to project country-to-country export potential for 2030, these inputs are operationalized through calculated drivers such as gravity model parameters, tariff impact factors, and projected GDP per-capita growth. Through an analysis of hidden potentials, demand hotspots, and market conditions that are most favorable to success, this method enables firms to focus on target countries, maximize returns, and global expansion with data, backed by accuracy.
By factoring in the projected importer demand gap that is currently unmet and could be potential opportunity, it identifies the potential for the Exporter (Country) among 190 countries, against the general trade analysis, which identifies the biggest importer or exporter.
To discover high-growth global markets and optimize your business strategy:
Click Here
Pricing
- Single User License$ 1,995
- Department License$ 2,400
- Site License$ 3,120
- Global License$ 3,795

Leadership Perspectives from Industry Events
Search
Thought Leadership and Analyst Meet


Our Clients
6WResearch In News
- India Air Conditioner Market Set for Strong Rebound in 2026 After Weather-Led Correction and GST-Driven Recovery: 6Wresearch
- ADAS in India: How Automatic Emergency Braking, Blind Spot Detection & Driver Monitoring are Transforming Road Safety
- Doha a strategic location for EV manufacturing hub: IPA Qatar
- Demand for luxury TVs surging in the GCC, says Samsung
- Empowering Growth: The Thriving Journey of Bangladesh’s Cable Industry
- Demand for luxury TVs surging in the GCC, says Samsung
Latest Reports
- Nicaragua RPG Gaming Market (2026-2032)
- New Zealand RPG Gaming Market (2026-2032)
- Netherlands RPG Gaming Market (2026-2032)
- Nauru RPG Gaming Market (2026-2032)
- Namibia RPG Gaming Market (2026-2032)
- Mozambique RPG Gaming Market (2026-2032)
- Montenegro RPG Gaming Market (2026-2032)
- Mongolia RPG Gaming Market (2026-2032)
- Monaco RPG Gaming Market (2026-2032)
- Micronesia RPG Gaming Market (2026-2032)
Industry Events and Analyst Meet

EV India Expo 2026

HIMTEX 2026

India Refining Summit 2026

India EV Show 2026

EV tech India Expo 2026
Whitepaper
- Middle East & Africa Commercial Security Market Click here to view more.
- Middle East & Africa Fire Safety Systems & Equipment Market Click here to view more.
- GCC Drone Market Click here to view more.
- Middle East Lighting Fixture Market Click here to view more.
- GCC Physical & Perimeter Security Market Click here to view more.