Slovenia Alginic acid Market (2026-2032) | Analysis, Value, Growth, Industry, Companies, Forecast, Share, Revenue, Outlook, Size, Trends & Segmentation
Market Forecast By Type (Sodium Alginate, Potassium Alginate, Calcium Alginate, Ammonium Alginate, Lithium, Magnesium, Propylene Glycol Alginate), By Industry use (Food Industry, Pharmaceutical, Cosmetics, Art and Crafts, Textile and Paper Industry, Industries and Technical, Leisure Industry, Other), By Functional Usage (Moisture Retainer, Thickening agent, A gelling agent, Adhesive, Coating, Stabilizer, Foaming and emulsifying agent) And Competitive Landscape
| Product Code: ETC4768018 | Publication Date: Nov 2023 | Updated Date: Apr 2026 | Product Type: Market Research Report | |
| Publisher: 6Wresearch | Author: Shubham Padhi | No. of Pages: 60 | No. of Figures: 30 | No. of Tables: 5 |
Slovenia Alginic Acid Market Size (2020-2030)
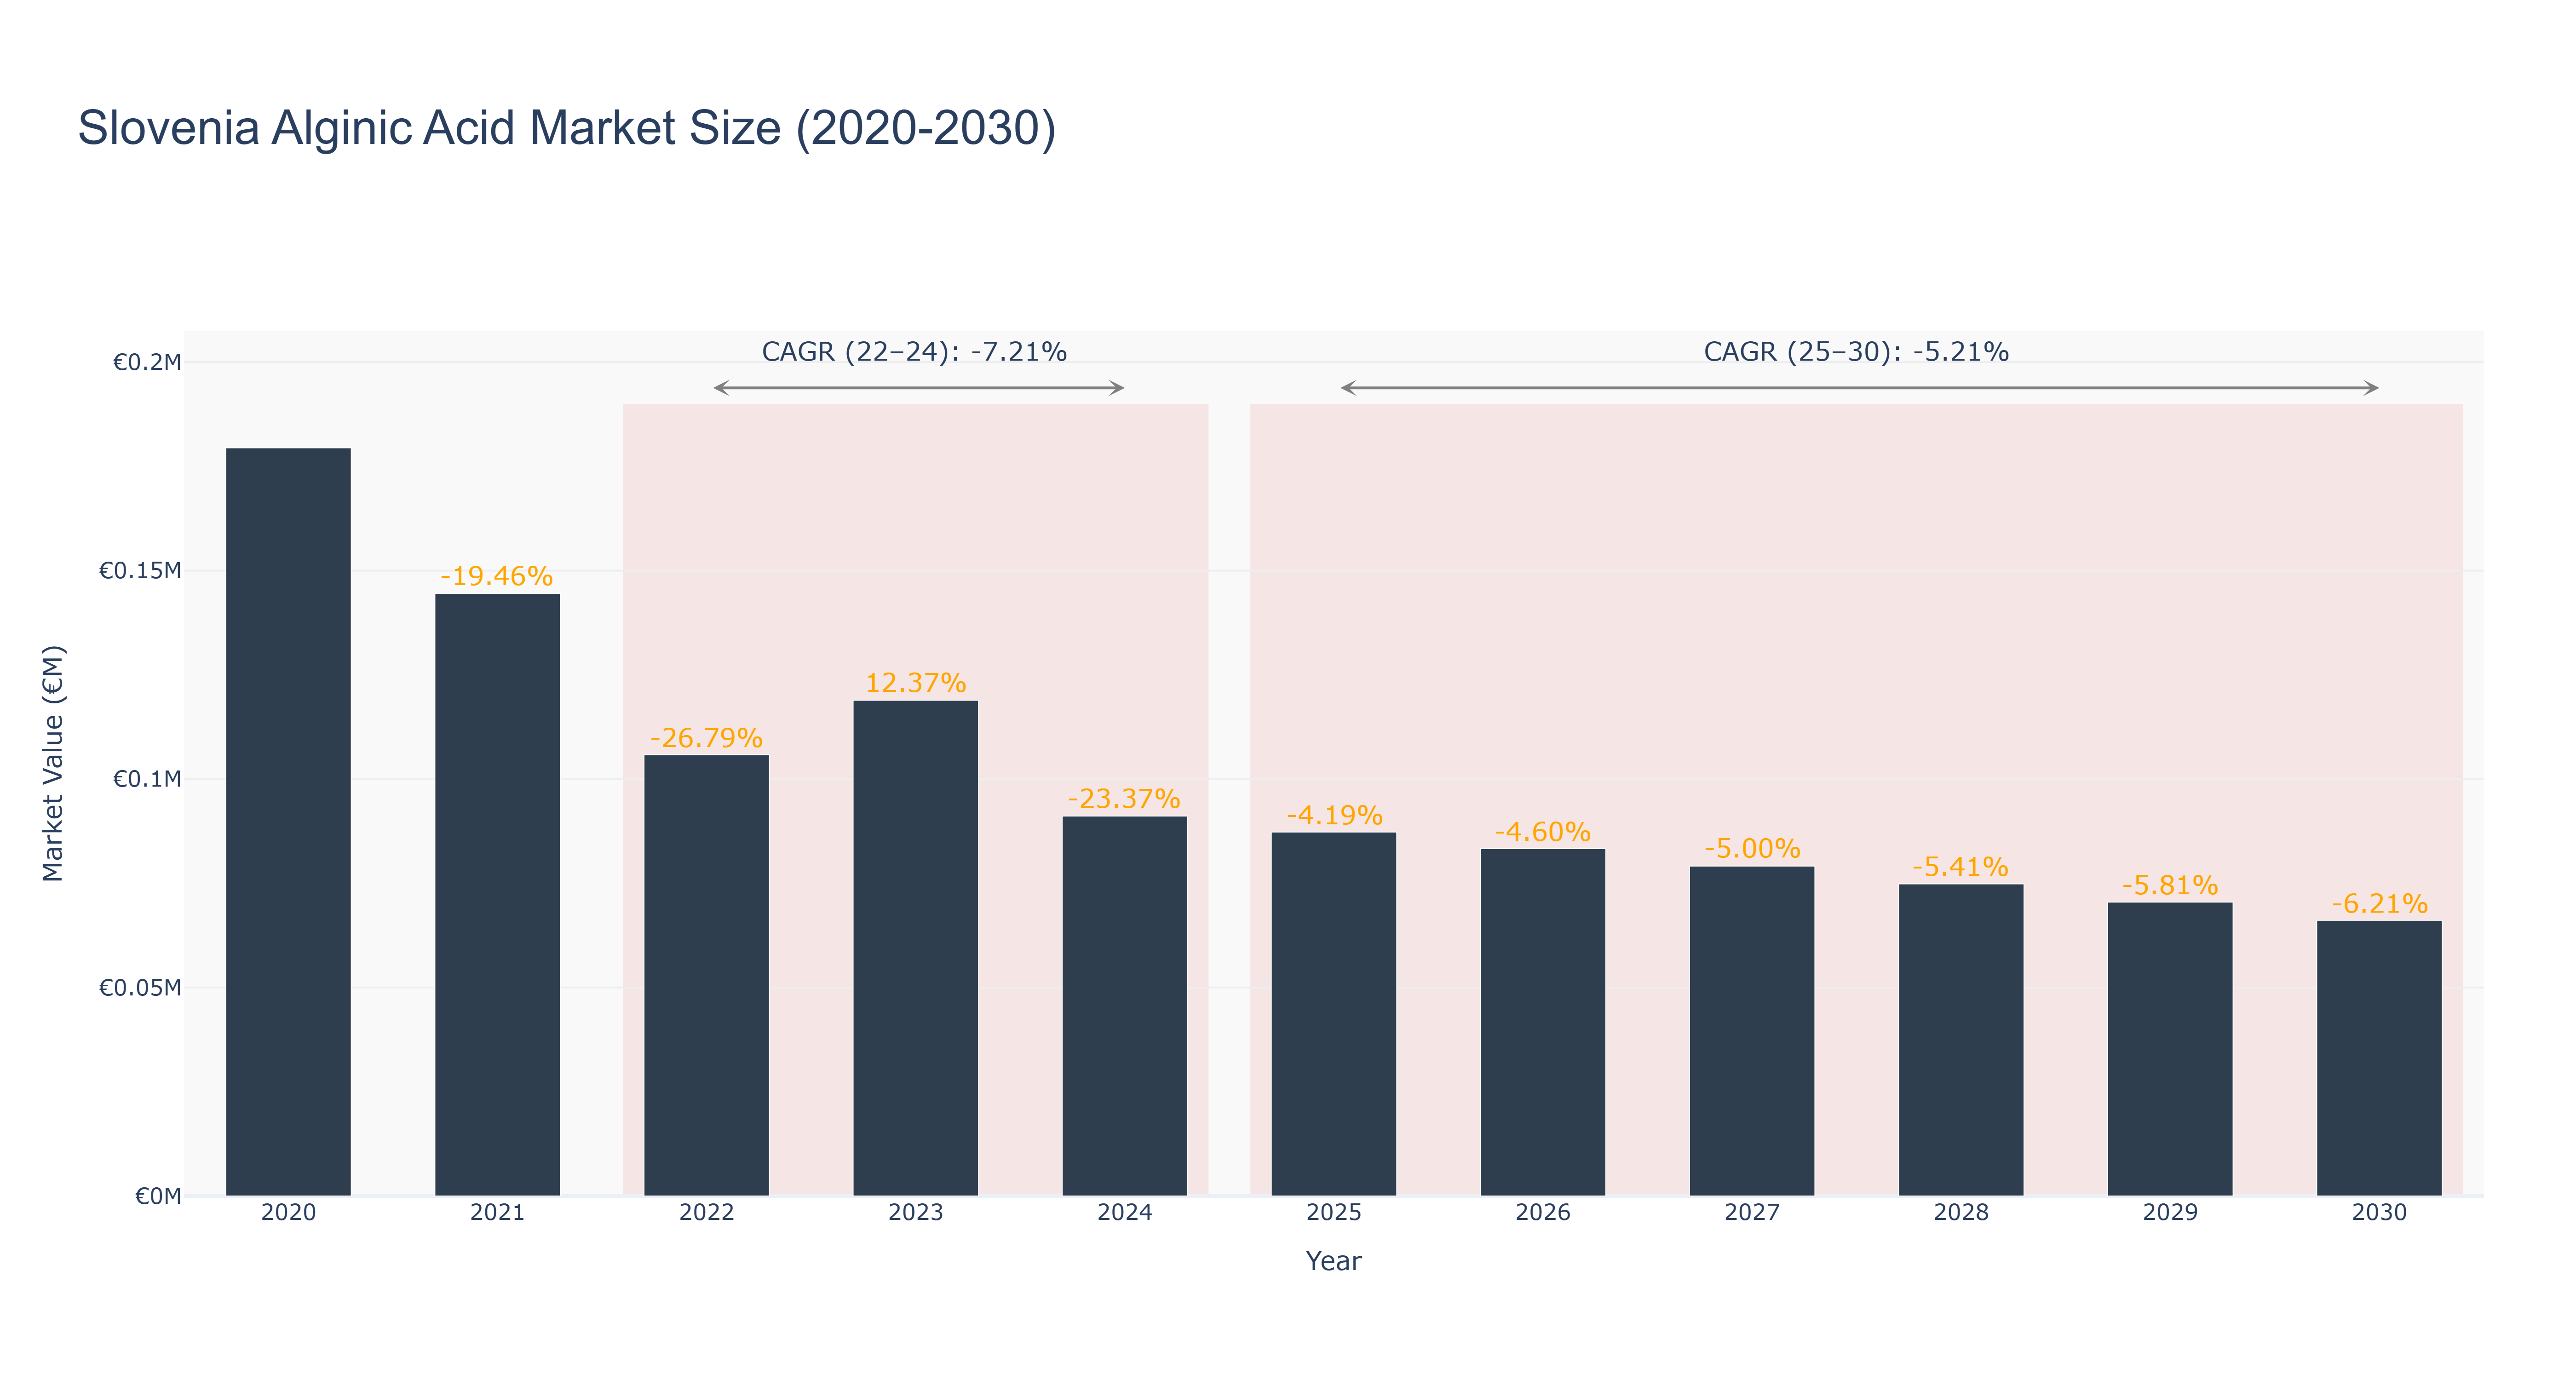
Slovenia's Alginic Acid Market witnessed a peak market size of €0.18 million in 2020, followed by a steady decline to €0.09 million in 2024. The market is forecasted to continue shrinking, reaching €0.07 million by 2030. The CAGR for the period 2022-24 is -7.21%, while for 2025-30, it stands at -5.21%. The market downturn can be attributed to factors such as changing consumer preferences, increased competition, and economic uncertainties. However, with a focus on innovation and sustainability, the market is looking to rebound in the future through new product developments and strategic partnerships. Recent initiatives in sustainable sourcing and production processes are expected to drive growth in the coming years, positioning Slovenia as a key player in the global Alginic Acid market.
Slovenia Alginic Acid Market: Production & Trade Performance (2019-2025)
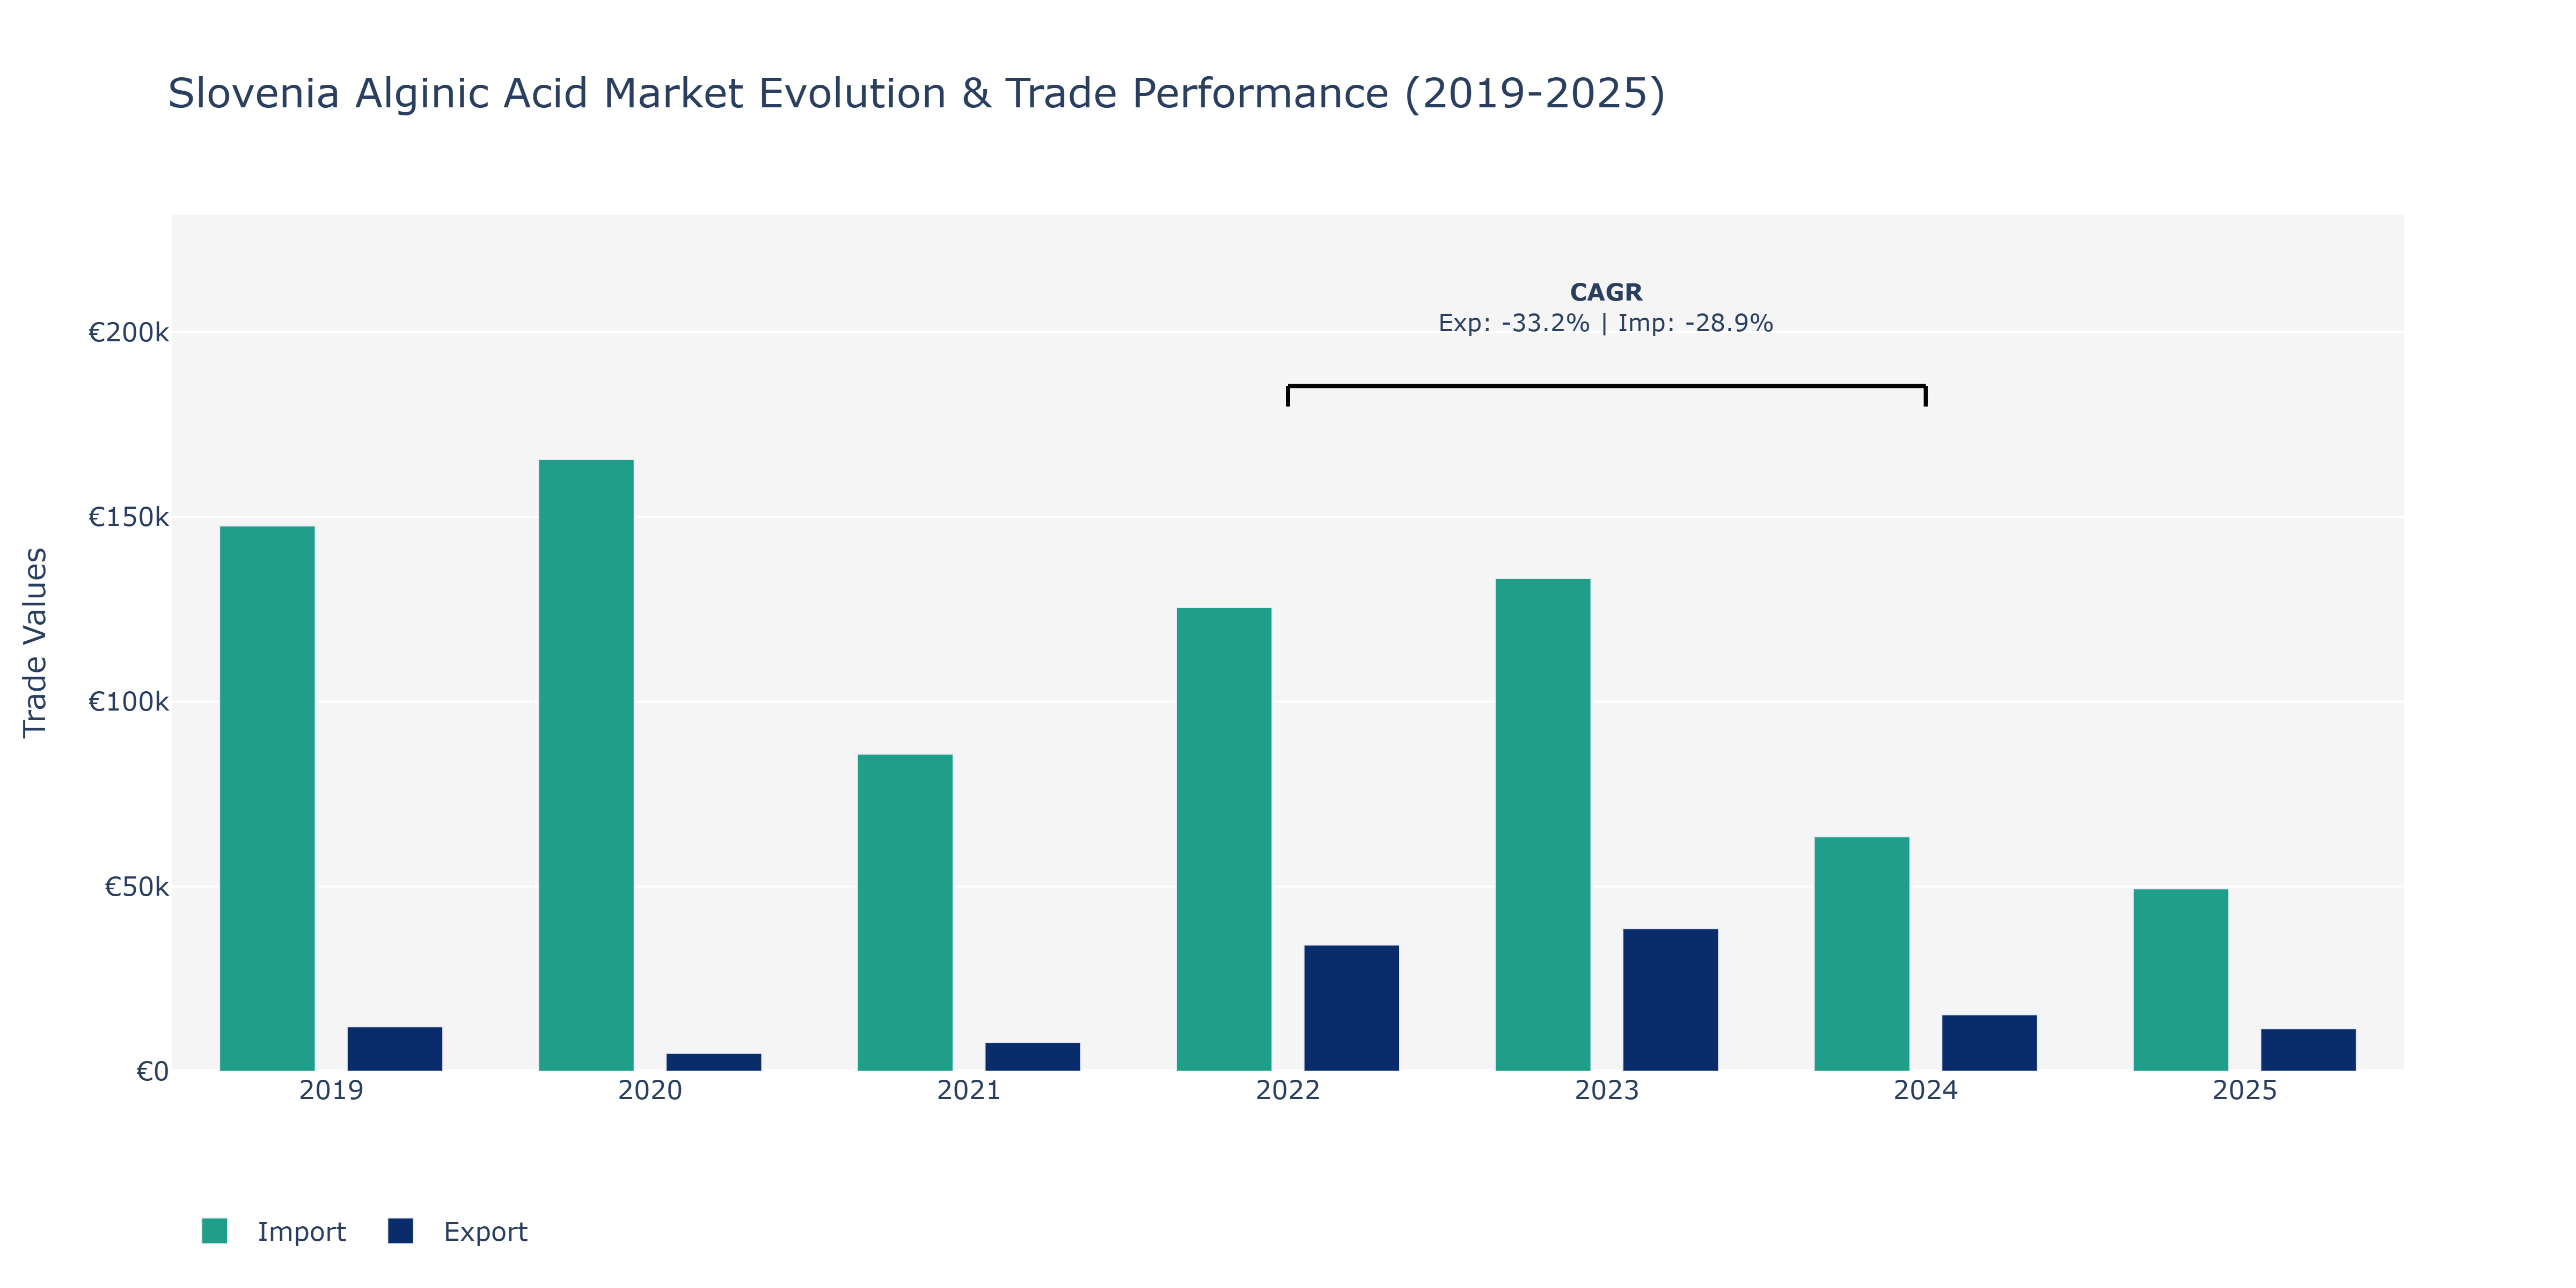
The Slovenia Alginic Acid Market witnessed notable fluctuations in both Exports and Imports from 2019 to 2025. The year 2019 marked a peak in Imports at €147.56 thousand, while Exports were at €12.02 thousand. Subsequently, both Exports and Imports experienced a substantial decline in 2020, with Exports decreasing to €4.82 thousand and Imports rising to €165.57 thousand. This trend reversed in 2021, showing a recovery in Exports to €7.75 thousand and a decrease in Imports to €85.81 thousand. The year 2022 saw a significant surge in Exports to €34.15 thousand, accompanied by a rise in Imports to €125.49 thousand. However, by 2024, Exports decreased sharply to €15.26 thousand, while Imports dropped to €63.42 thousand. The market's performance in 2025 showed a further decline in both Exports and Imports, reaching €11.47 thousand and €49.35 thousand, respectively. These fluctuations can be attributed to various factors such as global demand shifts, price volatility, regulatory changes, and evolving trade agreements impacting the Alginic Acid industry in Slovenia.
Key Highlights of the Report:
- Slovenia Alginic acid Market Outlook
- Market Size of Slovenia Alginic acid Market, 2025
- Forecast of Slovenia Alginic acid Market, 2032
- Historical Data and Forecast of Slovenia Alginic acid Revenues & Volume for the Period 2022-2032F
- Slovenia Alginic acid Market Trend Evolution
- Slovenia Alginic acid Market Drivers and Challenges
- Slovenia Alginic acid Price Trends
- Slovenia Alginic acid Porter`s Five Forces
- Slovenia Alginic acid Industry Life Cycle
- Historical Data and Forecast of Slovenia Alginic acid Market Revenues & Volume By Type for the Period 2022-2032F
- Historical Data and Forecast of Slovenia Alginic acid Market Revenues & Volume By Sodium Alginate for the Period 2022-2032F
- Historical Data and Forecast of Slovenia Alginic acid Market Revenues & Volume By Potassium Alginate for the Period 2022-2032F
- Historical Data and Forecast of Slovenia Alginic acid Market Revenues & Volume By Calcium Alginate for the Period 2022-2032F
- Historical Data and Forecast of Slovenia Alginic acid Market Revenues & Volume By Ammonium Alginate for the Period 2022-2032F
- Historical Data and Forecast of Slovenia Alginic acid Market Revenues & Volume By Lithium for the Period 2022-2032F
- Historical Data and Forecast of Slovenia Alginic acid Market Revenues & Volume By Magnesium for the Period 2022-2032F
- Historical Data and Forecast of Slovenia Alginic acid Market Revenues & Volume By Propylene Glycol Alginate for the Period 2022-2032F
- Historical Data and Forecast of Slovenia Alginic acid Market Revenues & Volume By Industry use for the Period 2022-2032F
- Historical Data and Forecast of Slovenia Alginic acid Market Revenues & Volume By Food Industry for the Period 2022-2032F
- Historical Data and Forecast of Slovenia Alginic acid Market Revenues & Volume By Pharmaceutical for the Period 2022-2032F
- Historical Data and Forecast of Slovenia Alginic acid Market Revenues & Volume By Cosmetics for the Period 2022-2032F
- Historical Data and Forecast of Slovenia Alginic acid Market Revenues & Volume By Art and Crafts for the Period 2022-2032F
- Historical Data and Forecast of Slovenia Alginic acid Market Revenues & Volume By Textile and Paper Industry for the Period 2022-2032F
- Historical Data and Forecast of Slovenia Alginic acid Market Revenues & Volume By Industries and Technical for the Period 2022-2032F
- Historical Data and Forecast of Slovenia Alginic acid Market Revenues & Volume By Leisure Industry for the Period 2022-2032F
- Historical Data and Forecast of Slovenia Alginic acid Market Revenues & Volume By Other for the Period 2022-2032F
- Historical Data and Forecast of Slovenia Alginic acid Market Revenues & Volume By Functional Usage for the Period 2022-2032F
- Historical Data and Forecast of Slovenia Alginic acid Market Revenues & Volume By Moisture Retainer for the Period 2022-2032F
- Historical Data and Forecast of Slovenia Alginic acid Market Revenues & Volume By Thickening agent for the Period 2022-2032F
- Historical Data and Forecast of Slovenia Alginic acid Market Revenues & Volume By A gelling agent for the Period 2022-2032F
- Historical Data and Forecast of Slovenia Alginic acid Market Revenues & Volume By Adhesive for the Period 2022-2032F
- Historical Data and Forecast of Slovenia Alginic acid Market Revenues & Volume By Coating for the Period 2022-2032F
- Historical Data and Forecast of Slovenia Alginic acid Market Revenues & Volume By Stabilizer for the Period 2022-2032F
- Historical Data and Forecast of Slovenia Alginic acid Market Revenues & Volume By Foaming and emulsifying agent for the Period 2022-2032F
- Slovenia Alginic acid Import Export Trade Statistics
- Market Opportunity Assessment By Type
- Market Opportunity Assessment By Industry use
- Market Opportunity Assessment By Functional Usage
- Slovenia Alginic acid Top Companies Market Share
- Slovenia Alginic acid Competitive Benchmarking By Technical and Operational Parameters
- Slovenia Alginic acid Company Profiles
- Slovenia Alginic acid Key Strategic Recommendations
Frequently Asked Questions About the Market Study (FAQs):
6Wresearch actively monitors the Slovenia Alginic acid Market and publishes its comprehensive annual report, highlighting emerging trends, growth drivers, revenue analysis, and forecast outlook. Our insights help businesses to make data-backed strategic decisions with ongoing market dynamics. Our analysts track relevent industries related to the Slovenia Alginic acid Market, allowing our clients with actionable intelligence and reliable forecasts tailored to emerging regional needs.
Yes, we provide customisation as per your requirements. To learn more, feel free to contact us on sales@6wresearch.com
1 Executive Summary |
2 Introduction |
2.1 Key Highlights of the Report |
2.2 Report Description |
2.3 Market Scope & Segmentation |
2.4 Research Methodology |
2.5 Assumptions |
3 Slovenia Alginic acid Market Overview |
3.1 Slovenia Country Macro Economic Indicators |
3.2 Slovenia Alginic acid Market Revenues & Volume, 2022 & 2032F |
3.3 Slovenia Alginic acid Market - Industry Life Cycle |
3.4 Slovenia Alginic acid Market - Porter's Five Forces |
3.5 Slovenia Alginic acid Market Revenues & Volume Share, By Type, 2022 & 2032F |
3.6 Slovenia Alginic acid Market Revenues & Volume Share, By Industry use, 2022 & 2032F |
3.7 Slovenia Alginic acid Market Revenues & Volume Share, By Functional Usage, 2022 & 2032F |
4 Slovenia Alginic acid Market Dynamics |
4.1 Impact Analysis |
4.2 Market Drivers |
4.2.1 Increasing awareness about the health benefits of alginic acid |
4.2.2 Growing demand for natural and organic ingredients in various industries |
4.2.3 Rise in research and development activities related to alginic acid applications |
4.3 Market Restraints |
4.3.1 Fluctuations in raw material prices |
4.3.2 Stringent regulations and quality standards for alginic acid production |
4.3.3 Limited availability of high-quality alginic acid sources in Slovenia |
5 Slovenia Alginic acid Market Trends |
6 Slovenia Alginic acid Market Segmentations |
6.1 Slovenia Alginic acid Market, By Type |
6.1.1 Overview and Analysis |
6.1.2 Slovenia Alginic acid Market Revenues & Volume, By Sodium Alginate, 2022-2032F |
6.1.3 Slovenia Alginic acid Market Revenues & Volume, By Potassium Alginate, 2022-2032F |
6.1.4 Slovenia Alginic acid Market Revenues & Volume, By Calcium Alginate, 2022-2032F |
6.1.5 Slovenia Alginic acid Market Revenues & Volume, By Ammonium Alginate, 2022-2032F |
6.1.6 Slovenia Alginic acid Market Revenues & Volume, By Lithium, 2022-2032F |
6.1.7 Slovenia Alginic acid Market Revenues & Volume, By Magnesium, 2022-2032F |
6.2 Slovenia Alginic acid Market, By Industry use |
6.2.1 Overview and Analysis |
6.2.2 Slovenia Alginic acid Market Revenues & Volume, By Food Industry, 2022-2032F |
6.2.3 Slovenia Alginic acid Market Revenues & Volume, By Pharmaceutical, 2022-2032F |
6.2.4 Slovenia Alginic acid Market Revenues & Volume, By Cosmetics, 2022-2032F |
6.2.5 Slovenia Alginic acid Market Revenues & Volume, By Art and Crafts, 2022-2032F |
6.2.6 Slovenia Alginic acid Market Revenues & Volume, By Textile and Paper Industry, 2022-2032F |
6.2.7 Slovenia Alginic acid Market Revenues & Volume, By Industries and Technical, 2022-2032F |
6.2.8 Slovenia Alginic acid Market Revenues & Volume, By Other, 2022-2032F |
6.2.9 Slovenia Alginic acid Market Revenues & Volume, By Other, 2022-2032F |
6.3 Slovenia Alginic acid Market, By Functional Usage |
6.3.1 Overview and Analysis |
6.3.2 Slovenia Alginic acid Market Revenues & Volume, By Moisture Retainer, 2022-2032F |
6.3.3 Slovenia Alginic acid Market Revenues & Volume, By Thickening agent, 2022-2032F |
6.3.4 Slovenia Alginic acid Market Revenues & Volume, By A gelling agent, 2022-2032F |
6.3.5 Slovenia Alginic acid Market Revenues & Volume, By Adhesive, 2022-2032F |
6.3.6 Slovenia Alginic acid Market Revenues & Volume, By Coating, 2022-2032F |
6.3.7 Slovenia Alginic acid Market Revenues & Volume, By Stabilizer, 2022-2032F |
7 Slovenia Alginic acid Market Import-Export Trade Statistics |
7.1 Slovenia Alginic acid Market Export to Major Countries |
7.2 Slovenia Alginic acid Market Imports from Major Countries |
8 Slovenia Alginic acid Market Key Performance Indicators |
8.1 Research and development investment in alginic acid applications |
8.2 Number of new product launches incorporating alginic acid |
8.3 Growth in demand for alginic acid-based products in key industries |
9 Slovenia Alginic acid Market - Opportunity Assessment |
9.1 Slovenia Alginic acid Market Opportunity Assessment, By Type, 2022 & 2032F |
9.2 Slovenia Alginic acid Market Opportunity Assessment, By Industry use, 2022 & 2032F |
9.3 Slovenia Alginic acid Market Opportunity Assessment, By Functional Usage, 2022 & 2032F |
10 Slovenia Alginic acid Market - Competitive Landscape |
10.1 Slovenia Alginic acid Market Revenue Share, By Companies, 2025 |
10.2 Slovenia Alginic acid Market Competitive Benchmarking, By Operating and Technical Parameters |
11 Company Profiles |
12 Recommendations | 13 Disclaimer |
Global Go To Market Strategy - 2030
Export potential enables firms to identify high-growth global markets with greater confidence by combining advanced trade intelligence with a structured quantitative methodology. The framework analyzes emerging demand trends and country-level import patterns while integrating macroeconomic and trade datasets such as GDP and population forecasts, bilateral import–export flows, tariff structures, elasticity differentials between developed and developing economies, geographic distance, and import demand projections. Using weighted trade values from 2020–2024 as the base period to project country-to-country export potential for 2030, these inputs are operationalized through calculated drivers such as gravity model parameters, tariff impact factors, and projected GDP per-capita growth. Through an analysis of hidden potentials, demand hotspots, and market conditions that are most favorable to success, this method enables firms to focus on target countries, maximize returns, and global expansion with data, backed by accuracy.
By factoring in the projected importer demand gap that is currently unmet and could be potential opportunity, it identifies the potential for the Exporter (Country) among 190 countries, against the general trade analysis, which identifies the biggest importer or exporter.
To discover high-growth global markets and optimize your business strategy:
Click Here
Pricing
- Single User License$ 1,995
- Department License$ 2,400
- Site License$ 3,120
- Global License$ 3,795

Leadership Perspectives from Industry Events
Search
Thought Leadership and Analyst Meet


Our Clients
6WResearch In News
- India Export Attractiveness Tracker 2026
- India Air Conditioner Market Set for Strong Rebound in 2026 After Weather-Led Correction and GST-Driven Recovery: 6Wresearch
- ADAS in India: How Automatic Emergency Braking, Blind Spot Detection & Driver Monitoring are Transforming Road Safety
- Doha a strategic location for EV manufacturing hub: IPA Qatar
- Demand for luxury TVs surging in the GCC, says Samsung
- Empowering Growth: The Thriving Journey of Bangladesh’s Cable Industry
Latest Reports
- Nicaragua RPG Gaming Market (2026-2032)
- New Zealand RPG Gaming Market (2026-2032)
- Netherlands RPG Gaming Market (2026-2032)
- Nauru RPG Gaming Market (2026-2032)
- Namibia RPG Gaming Market (2026-2032)
- Mozambique RPG Gaming Market (2026-2032)
- Montenegro RPG Gaming Market (2026-2032)
- Mongolia RPG Gaming Market (2026-2032)
- Monaco RPG Gaming Market (2026-2032)
- Micronesia RPG Gaming Market (2026-2032)
Industry Events and Analyst Meet

EV India Expo 2026

HIMTEX 2026

India Refining Summit 2026

India EV Show 2026

EV tech India Expo 2026
Whitepaper
- Middle East & Africa Commercial Security Market Click here to view more.
- Middle East & Africa Fire Safety Systems & Equipment Market Click here to view more.
- GCC Drone Market Click here to view more.
- Middle East Lighting Fixture Market Click here to view more.
- GCC Physical & Perimeter Security Market Click here to view more.