Slovenia Bagster Bag Market (2026-2032) | Trends, Companies, Outlook, Consumer Insights, Competition, Drivers, Investment Trends, Challenges, Growth, Segments, Competitive, Opportunities, Size, Revenue, Segmentation, Value, Share, Strategic Insights, Restraints, Demand, Industry, Strategy, Forecast, Supply, Pricing Analysis, Analysis
Market Forecast By Product Type (Standard Bagster Bags, Heavy-Duty Bagster Bags, Compact Bagster Bags), By Application (Residential Waste Disposal, Industrial Waste, Small-scale Cleanup), By End User (Residential Homes, Construction Companies, Landscaping Services), By Capacity (3 Cubic Yards, 5 Cubic Yards, 1-2 Cubic Yards), By Distribution Channel (Home Improvement Stores, Direct Sales, Online & Hardware Stores) And Competitive Landscape
| Product Code: ETC11331108 | Publication Date: Apr 2025 | Updated Date: Apr 2026 | Product Type: Market Research Report | |
| Publisher: 6Wresearch | No. of Pages: 65 | No. of Figures: 34 | No. of Tables: 19 | |
Slovenia Bagster Bag Market Size (2020-2030)
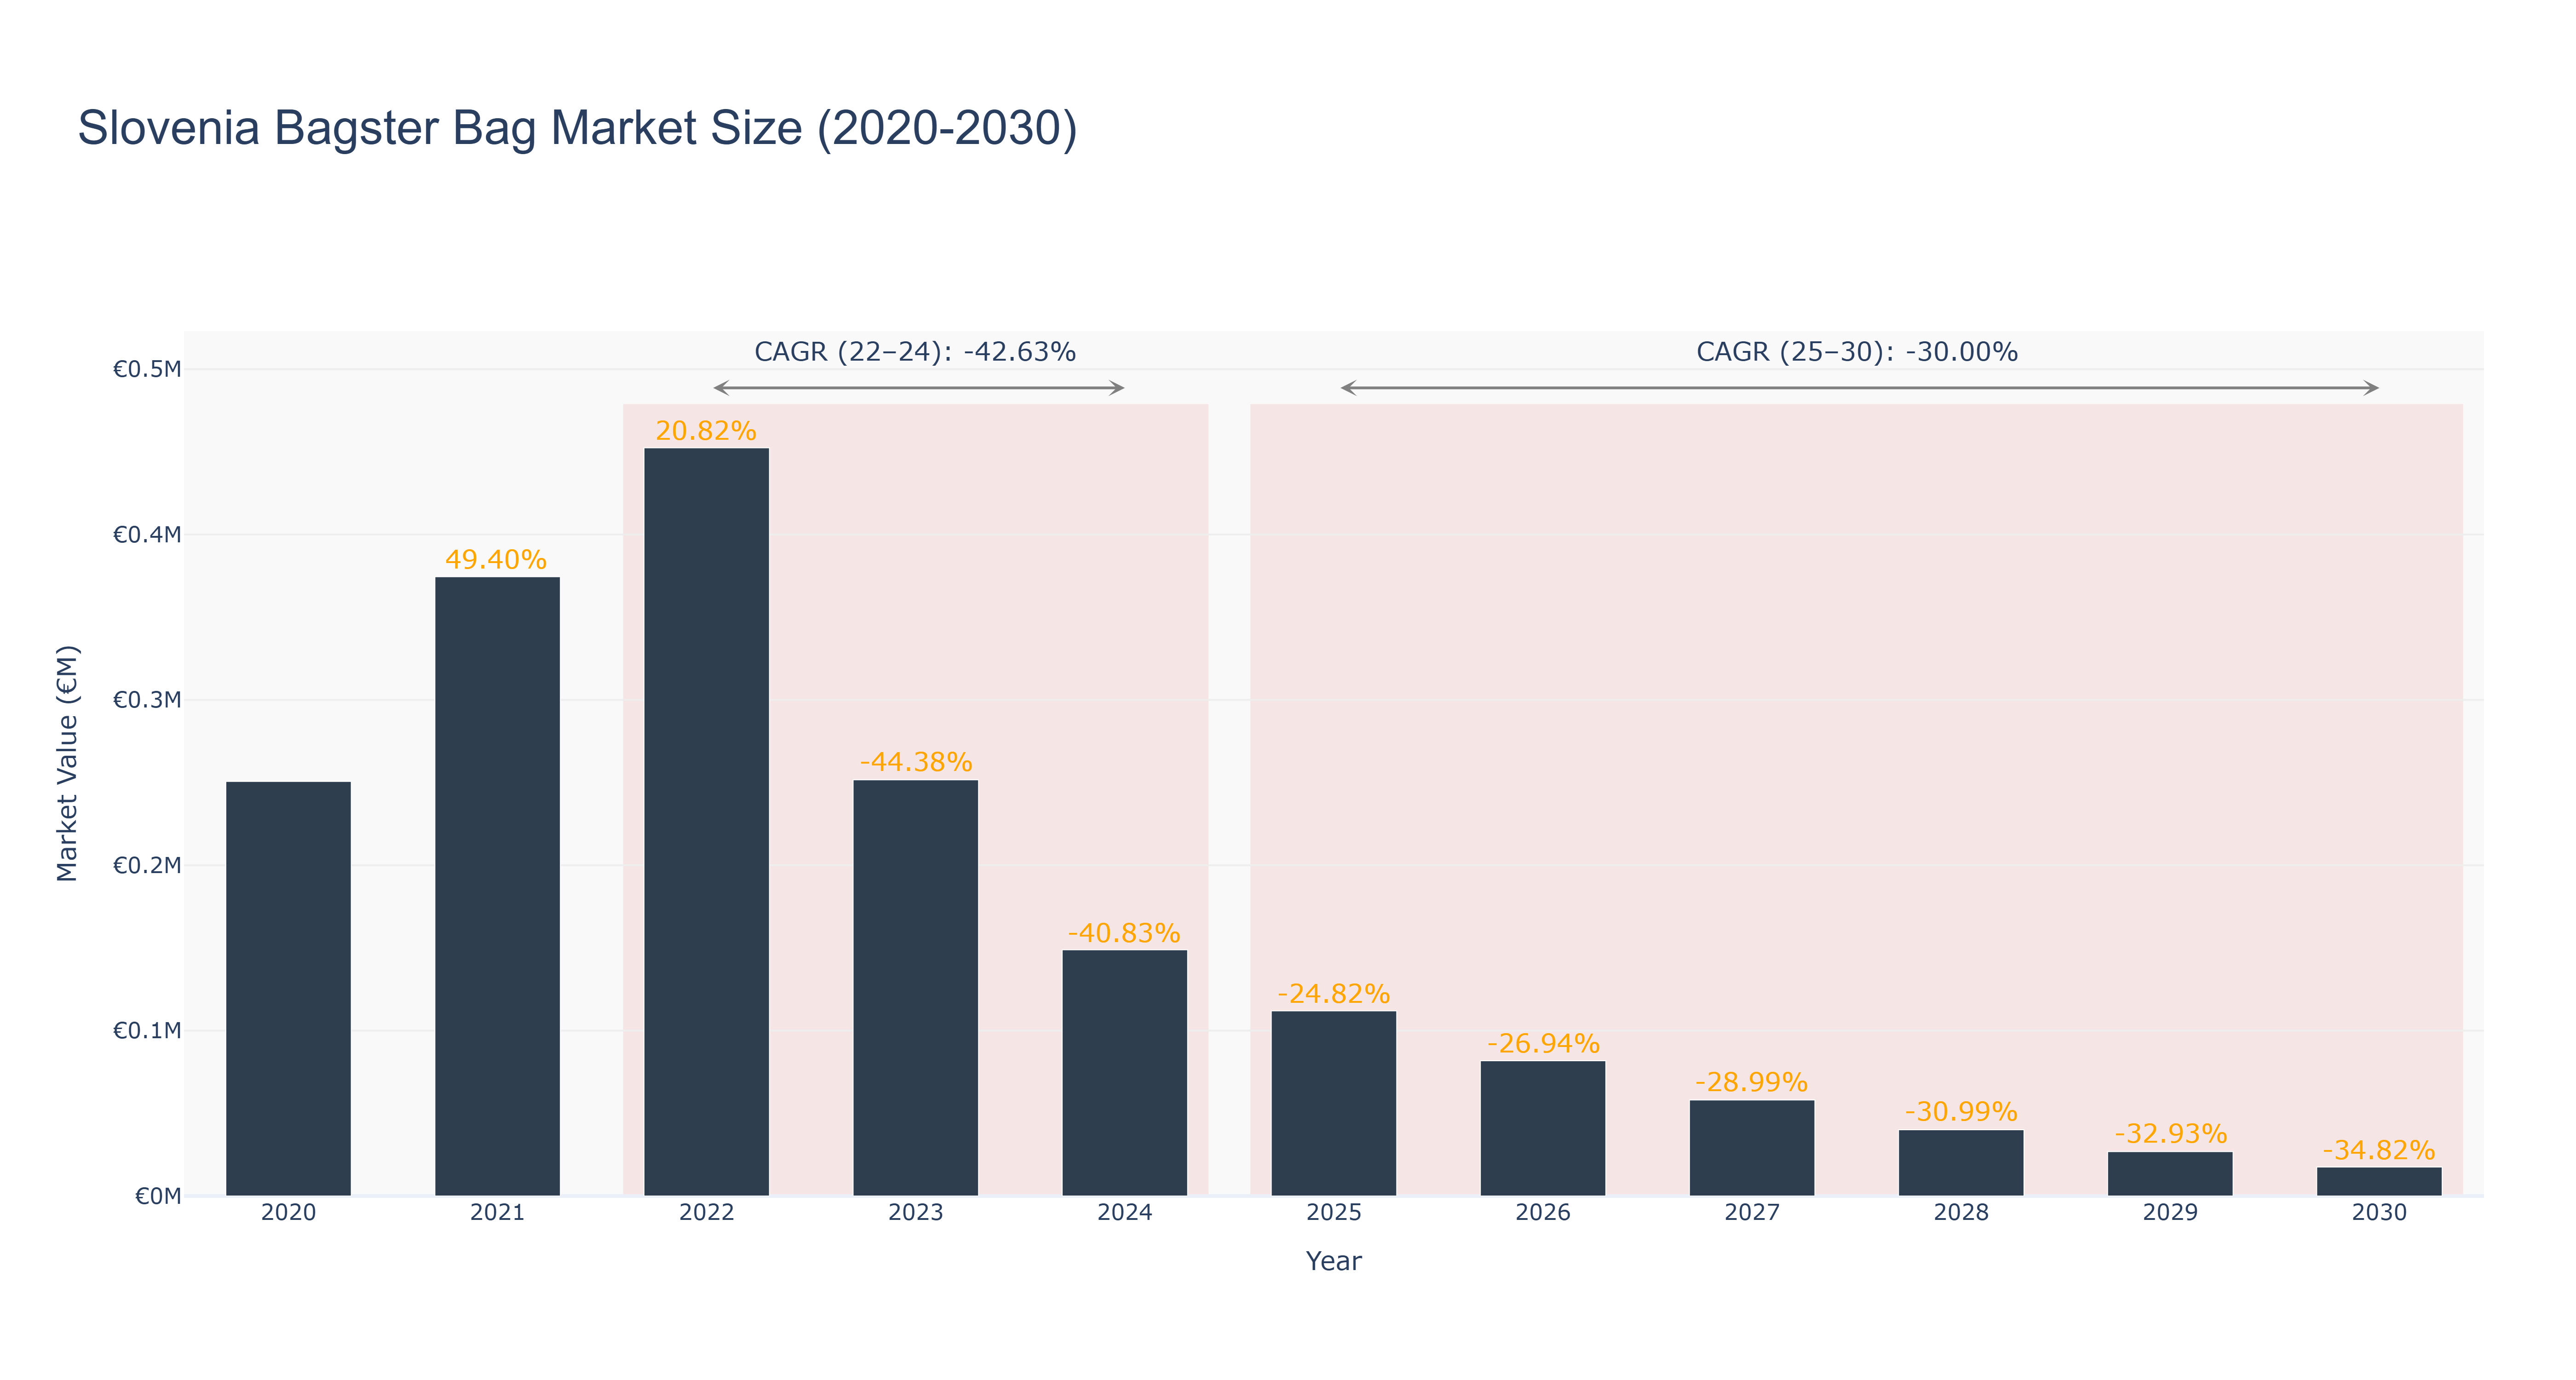
Slovenia's Bagster Bag Market experienced a peak market size of €0.45 million in 2022, followed by a significant decline to €0.11 million in 2025. The market is forecasted to further decrease to €0.02 million by 2030, with a CAGR of -30.0% from 2025 to 2030. The downward trend can be attributed to changing consumer preferences towards eco-friendly alternatives and a saturated market. Despite the challenging outlook, Slovenia is set to introduce a national recycling program for plastic waste in 2027, aiming to boost sustainability efforts and potentially revitalize the bag market. Industry drivers such as environmental regulations and increasing awareness of plastic pollution will continue to shape the market landscape in the coming years, emphasizing the need for innovative solutions and sustainable practices.
Slovenia Bagster Bag Market: Production & Trade Performance (2019-2025)
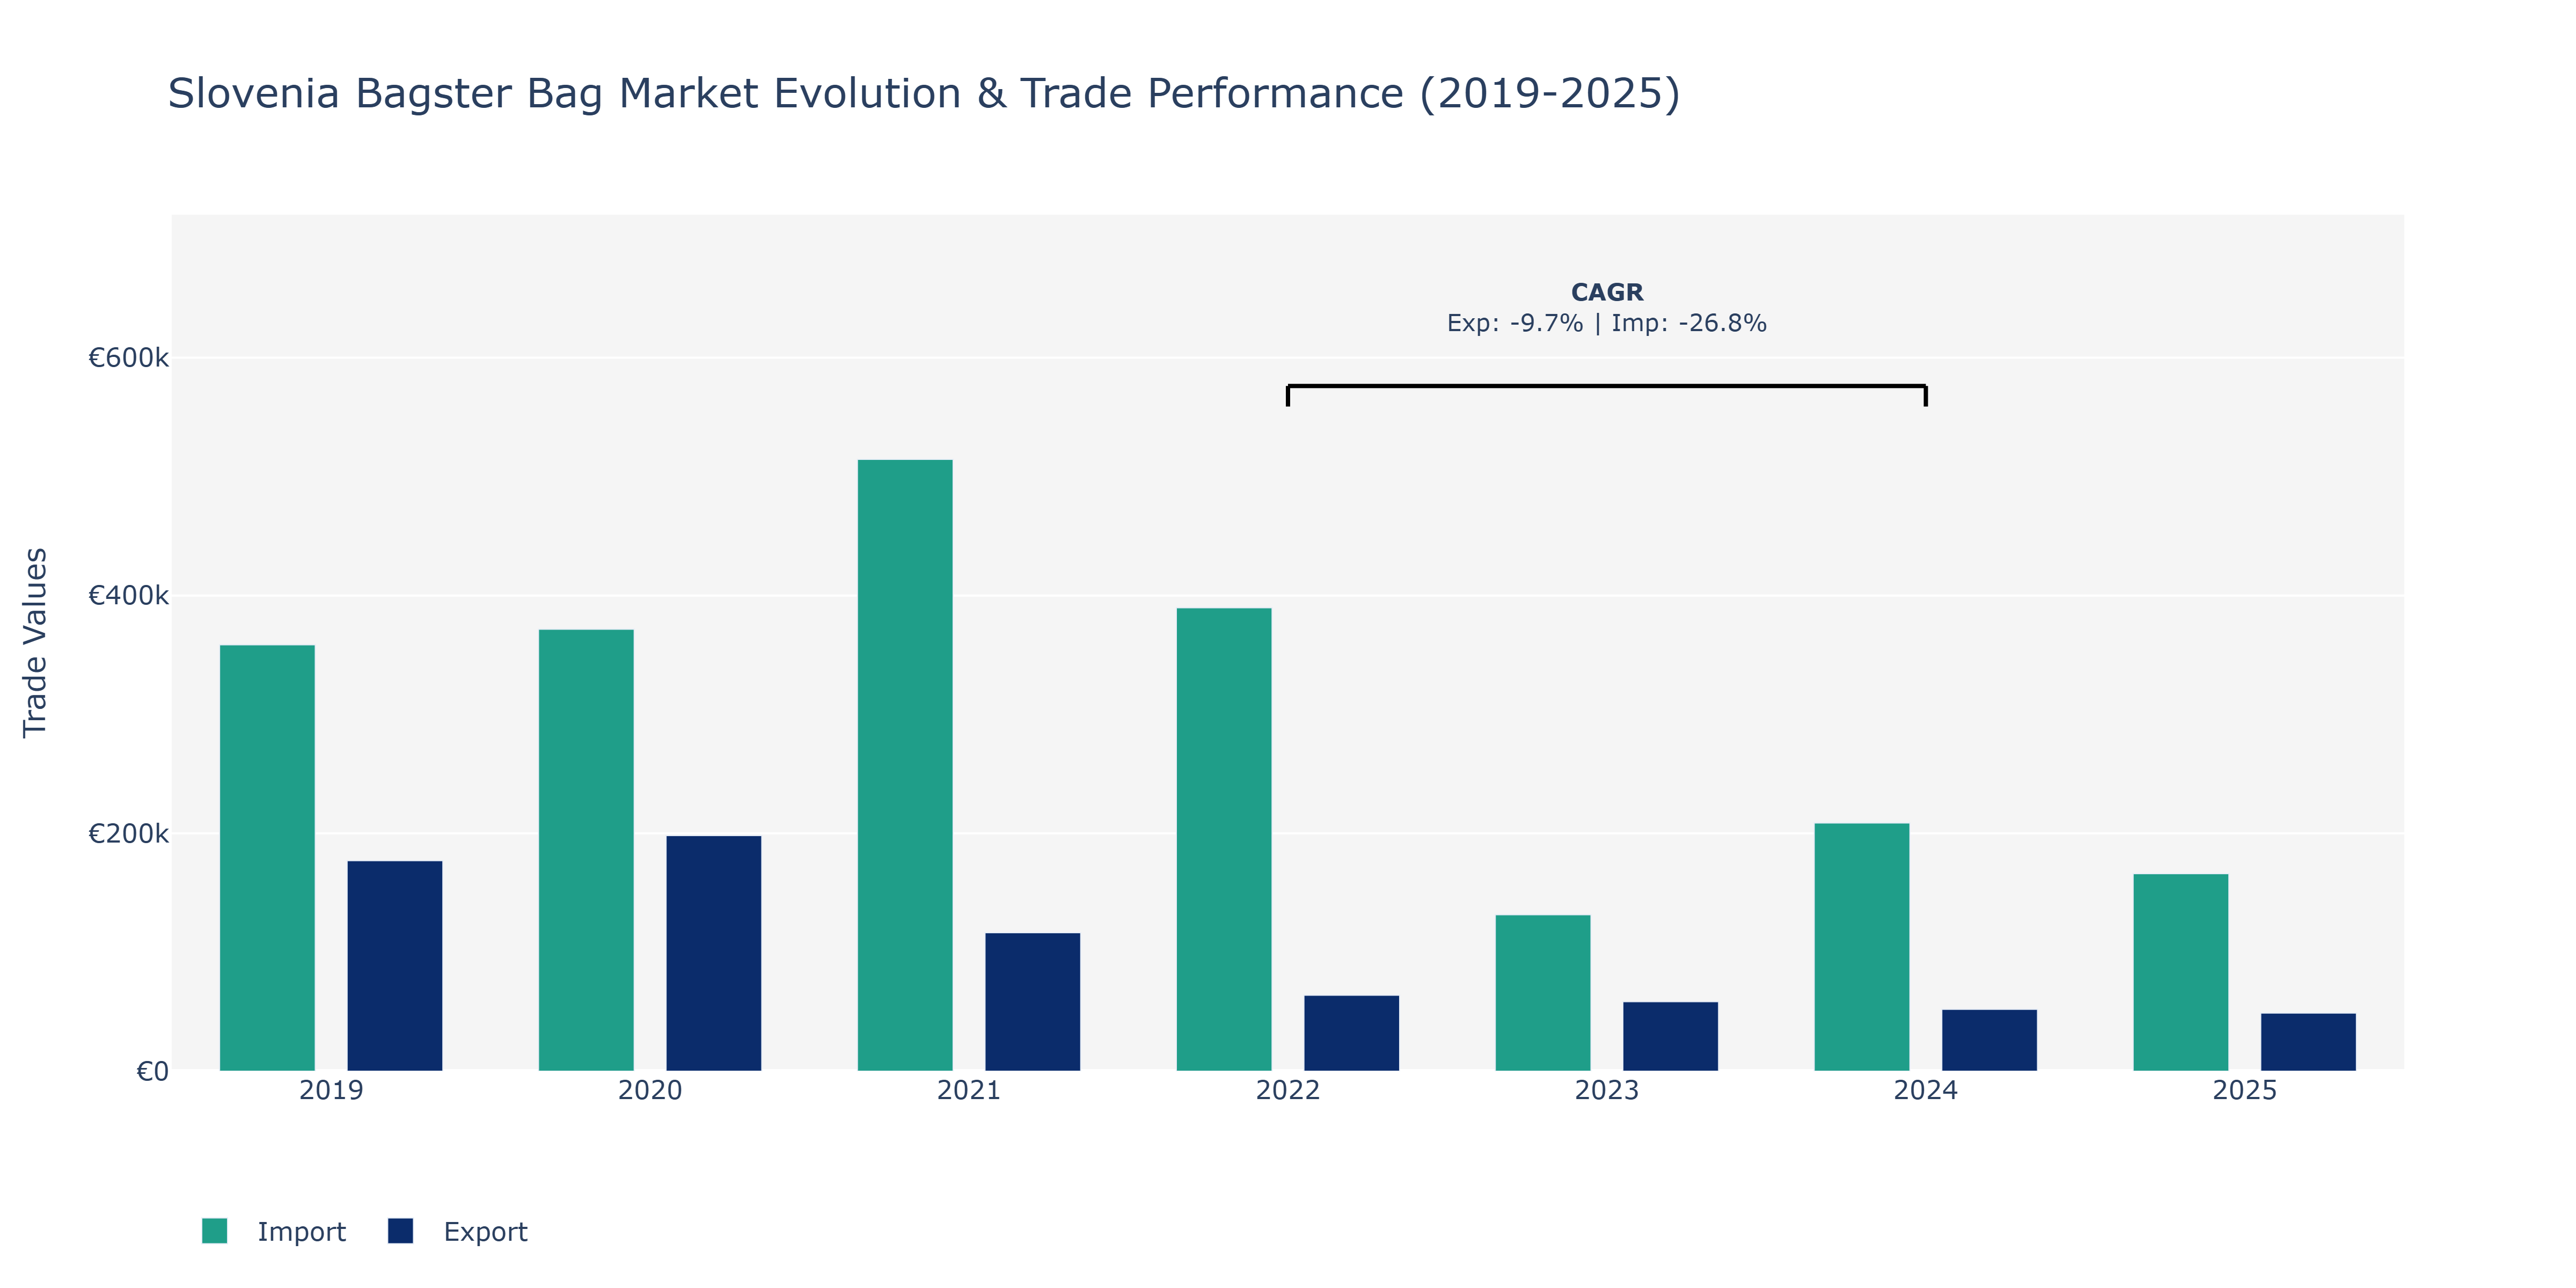
Between 2019 and 2025, the Slovenia Bagster Bag Market saw fluctuations in both Exports and Imports. Exports started at €176.98 thousand in 2019, rose to €198.06 thousand in 2020, then experienced a significant decline to €116.41 thousand in 2021, attributed to global economic challenges. The decreasing trend continued in the following years, hitting €48.82 thousand in 2025. On the other hand, Imports followed a different trajectory, increasing continuously from €358.62 thousand in 2019 to a peak of €514.49 thousand in 2021, likely driven by growing consumer demand and industry expansion. However, Imports saw a decline to €166.09 thousand in 2025, possibly due to changes in trade policies or alterations in supply chain dynamics. The notable CAGR decreases for Exports and Imports in 2022-2024 further highlight the market's challenges, possibly influenced by regulatory changes impacting trade flows in the bag market sector globally.
Key Highlights of the Report:
- Slovenia Bagster Bag Market Outlook
- Market Size of Slovenia Bagster Bag Market, 2025
- Forecast of Slovenia Bagster Bag Market, 2032
- Historical Data and Forecast of Slovenia Bagster Bag Revenues & Volume for the Period 2022-2032F
- Slovenia Bagster Bag Market Trend Evolution
- Slovenia Bagster Bag Market Drivers and Challenges
- Slovenia Bagster Bag Price Trends
- Slovenia Bagster Bag Porter's Five Forces
- Slovenia Bagster Bag Industry Life Cycle
- Historical Data and Forecast of Slovenia Bagster Bag Market Revenues & Volume By Product Type for the Period 2022-2032F
- Historical Data and Forecast of Slovenia Bagster Bag Market Revenues & Volume By Standard Bagster Bags for the Period 2022-2032F
- Historical Data and Forecast of Slovenia Bagster Bag Market Revenues & Volume By Heavy-Duty Bagster Bags for the Period 2022-2032F
- Historical Data and Forecast of Slovenia Bagster Bag Market Revenues & Volume By Compact Bagster Bags for the Period 2022-2032F
- Historical Data and Forecast of Slovenia Bagster Bag Market Revenues & Volume By Application for the Period 2022-2032F
- Historical Data and Forecast of Slovenia Bagster Bag Market Revenues & Volume By Residential Waste Disposal for the Period 2022-2032F
- Historical Data and Forecast of Slovenia Bagster Bag Market Revenues & Volume By Industrial Waste for the Period 2022-2032F
- Historical Data and Forecast of Slovenia Bagster Bag Market Revenues & Volume By Small-scale Cleanup for the Period 2022-2032F
- Historical Data and Forecast of Slovenia Bagster Bag Market Revenues & Volume By End User for the Period 2022-2032F
- Historical Data and Forecast of Slovenia Bagster Bag Market Revenues & Volume By Residential Homes for the Period 2022-2032F
- Historical Data and Forecast of Slovenia Bagster Bag Market Revenues & Volume By Construction Companies for the Period 2022-2032F
- Historical Data and Forecast of Slovenia Bagster Bag Market Revenues & Volume By Landscaping Services for the Period 2022-2032F
- Historical Data and Forecast of Slovenia Bagster Bag Market Revenues & Volume By Capacity for the Period 2022-2032F
- Historical Data and Forecast of Slovenia Bagster Bag Market Revenues & Volume By 3 Cubic Yards for the Period 2022-2032F
- Historical Data and Forecast of Slovenia Bagster Bag Market Revenues & Volume By 5 Cubic Yards for the Period 2022-2032F
- Historical Data and Forecast of Slovenia Bagster Bag Market Revenues & Volume By 1-2 Cubic Yards for the Period 2022-2032F
- Historical Data and Forecast of Slovenia Bagster Bag Market Revenues & Volume By Distribution Channel for the Period 2022-2032F
- Historical Data and Forecast of Slovenia Bagster Bag Market Revenues & Volume By Home Improvement Stores for the Period 2022-2032F
- Historical Data and Forecast of Slovenia Bagster Bag Market Revenues & Volume By Direct Sales for the Period 2022-2032F
- Historical Data and Forecast of Slovenia Bagster Bag Market Revenues & Volume By Online & Hardware Stores for the Period 2022-2032F
- Slovenia Bagster Bag Import Export Trade Statistics
- Market Opportunity Assessment By Product Type
- Market Opportunity Assessment By Application
- Market Opportunity Assessment By End User
- Market Opportunity Assessment By Capacity
- Market Opportunity Assessment By Distribution Channel
- Slovenia Bagster Bag Top Companies Market Share
- Slovenia Bagster Bag Competitive Benchmarking By Technical and Operational Parameters
- Slovenia Bagster Bag Company Profiles
- Slovenia Bagster Bag Key Strategic Recommendations
Frequently Asked Questions About the Market Study (FAQs):
6Wresearch actively monitors the Slovenia Bagster Bag Market and publishes its comprehensive annual report, highlighting emerging trends, growth drivers, revenue analysis, and forecast outlook. Our insights help businesses to make data-backed strategic decisions with ongoing market dynamics. Our analysts track relevent industries related to the Slovenia Bagster Bag Market, allowing our clients with actionable intelligence and reliable forecasts tailored to emerging regional needs.
Yes, we provide customisation as per your requirements. To learn more, feel free to contact us on sales@6wresearch.com
1 Executive Summary |
2 Introduction |
2.1 Key Highlights of the Report |
2.2 Report Description |
2.3 Market Scope & Segmentation |
2.4 Research Methodology |
2.5 Assumptions |
3 Slovenia Bagster Bag Market Overview |
3.1 Slovenia Country Macro Economic Indicators |
3.2 Slovenia Bagster Bag Market Revenues & Volume, 2022 & 2032F |
3.3 Slovenia Bagster Bag Market - Industry Life Cycle |
3.4 Slovenia Bagster Bag Market - Porter's Five Forces |
3.5 Slovenia Bagster Bag Market Revenues & Volume Share, By Product Type, 2022 & 2032F |
3.6 Slovenia Bagster Bag Market Revenues & Volume Share, By Application, 2022 & 2032F |
3.7 Slovenia Bagster Bag Market Revenues & Volume Share, By End User, 2022 & 2032F |
3.8 Slovenia Bagster Bag Market Revenues & Volume Share, By Capacity, 2022 & 2032F |
3.9 Slovenia Bagster Bag Market Revenues & Volume Share, By Distribution Channel, 2022 & 2032F |
4 Slovenia Bagster Bag Market Dynamics |
4.1 Impact Analysis |
4.2 Market Drivers |
4.2.1 Increasing environmental awareness leading to a shift towards eco-friendly and sustainable bag options. |
4.2.2 Growing tourism industry in Slovenia boosting demand for travel bags like Bagster bags. |
4.2.3 Rising disposable income levels enhancing consumer purchasing power for premium bag products. |
4.3 Market Restraints |
4.3.1 Intense competition from other bag brands in the market. |
4.3.2 Fluctuating raw material prices impacting production costs. |
4.3.3 Changes in consumer preferences and fashion trends affecting bag sales. |
5 Slovenia Bagster Bag Market Trends |
6 Slovenia Bagster Bag Market, By Types |
6.1 Slovenia Bagster Bag Market, By Product Type |
6.1.1 Overview and Analysis |
6.1.2 Slovenia Bagster Bag Market Revenues & Volume, By Product Type, 2022 - 2032F |
6.1.3 Slovenia Bagster Bag Market Revenues & Volume, By Standard Bagster Bags, 2022 - 2032F |
6.1.4 Slovenia Bagster Bag Market Revenues & Volume, By Heavy-Duty Bagster Bags, 2022 - 2032F |
6.1.5 Slovenia Bagster Bag Market Revenues & Volume, By Compact Bagster Bags, 2022 - 2032F |
6.1.6 Slovenia Bagster Bag Market Revenues & Volume, By Multi-purpose Bags, 2022 - 2032F |
6.2 Slovenia Bagster Bag Market, By Application |
6.2.1 Overview and Analysis |
6.2.2 Slovenia Bagster Bag Market Revenues & Volume, By Residential Waste Disposal, 2022 - 2032F |
6.2.3 Slovenia Bagster Bag Market Revenues & Volume, By Industrial Waste, 2022 - 2032F |
6.2.4 Slovenia Bagster Bag Market Revenues & Volume, By Small-scale Cleanup, 2022 - 2032F |
6.2.5 Slovenia Bagster Bag Market Revenues & Volume, By Bulk Waste Collection, 2022 - 2032F |
6.3 Slovenia Bagster Bag Market, By End User |
6.3.1 Overview and Analysis |
6.3.2 Slovenia Bagster Bag Market Revenues & Volume, By Residential Homes, 2022 - 2032F |
6.3.3 Slovenia Bagster Bag Market Revenues & Volume, By Construction Companies, 2022 - 2032F |
6.3.4 Slovenia Bagster Bag Market Revenues & Volume, By Landscaping Services, 2022 - 2032F |
6.3.5 Slovenia Bagster Bag Market Revenues & Volume, By Commercial Cleaning, 2022 - 2032F |
6.4 Slovenia Bagster Bag Market, By Capacity |
6.4.1 Overview and Analysis |
6.4.2 Slovenia Bagster Bag Market Revenues & Volume, By 3 Cubic Yards, 2022 - 2032F |
6.4.3 Slovenia Bagster Bag Market Revenues & Volume, By 5 Cubic Yards, 2022 - 2032F |
6.4.4 Slovenia Bagster Bag Market Revenues & Volume, By 1-2 Cubic Yards, 2022 - 2032F |
6.4.5 Slovenia Bagster Bag Market Revenues & Volume, By 4-6 Cubic Yards, 2022 - 2032F |
6.5 Slovenia Bagster Bag Market, By Distribution Channel |
6.5.1 Overview and Analysis |
6.5.2 Slovenia Bagster Bag Market Revenues & Volume, By Home Improvement Stores, 2022 - 2032F |
6.5.3 Slovenia Bagster Bag Market Revenues & Volume, By Direct Sales, 2022 - 2032F |
6.5.4 Slovenia Bagster Bag Market Revenues & Volume, By Online & Hardware Stores, 2022 - 2032F |
7 Slovenia Bagster Bag Market Import-Export Trade Statistics |
7.1 Slovenia Bagster Bag Market Export to Major Countries |
7.2 Slovenia Bagster Bag Market Imports from Major Countries |
8 Slovenia Bagster Bag Market Key Performance Indicators |
8.1 Number of new eco-friendly materials introduced in Bagster bags. |
8.2 Percentage increase in sales of Bagster bags to tourists visiting Slovenia. |
8.3 Customer satisfaction scores related to the quality and durability of Bagster bags. |
9 Slovenia Bagster Bag Market - Opportunity Assessment |
9.1 Slovenia Bagster Bag Market Opportunity Assessment, By Product Type, 2022 & 2032F |
9.2 Slovenia Bagster Bag Market Opportunity Assessment, By Application, 2022 & 2032F |
9.3 Slovenia Bagster Bag Market Opportunity Assessment, By End User, 2022 & 2032F |
9.4 Slovenia Bagster Bag Market Opportunity Assessment, By Capacity, 2022 & 2032F |
9.5 Slovenia Bagster Bag Market Opportunity Assessment, By Distribution Channel, 2022 & 2032F |
10 Slovenia Bagster Bag Market - Competitive Landscape |
10.1 Slovenia Bagster Bag Market Revenue Share, By Companies, 2025 |
10.2 Slovenia Bagster Bag Market Competitive Benchmarking, By Operating and Technical Parameters |
11 Company Profiles |
12 Recommendations |
13 Disclaimer |
Global Go To Market Strategy - 2030
Export potential enables firms to identify high-growth global markets with greater confidence by combining advanced trade intelligence with a structured quantitative methodology. The framework analyzes emerging demand trends and country-level import patterns while integrating macroeconomic and trade datasets such as GDP and population forecasts, bilateral import–export flows, tariff structures, elasticity differentials between developed and developing economies, geographic distance, and import demand projections. Using weighted trade values from 2020–2024 as the base period to project country-to-country export potential for 2030, these inputs are operationalized through calculated drivers such as gravity model parameters, tariff impact factors, and projected GDP per-capita growth. Through an analysis of hidden potentials, demand hotspots, and market conditions that are most favorable to success, this method enables firms to focus on target countries, maximize returns, and global expansion with data, backed by accuracy.
By factoring in the projected importer demand gap that is currently unmet and could be potential opportunity, it identifies the potential for the Exporter (Country) among 190 countries, against the general trade analysis, which identifies the biggest importer or exporter.
To discover high-growth global markets and optimize your business strategy:
Click Here
Pricing
- Single User License$ 1,995
- Department License$ 2,400
- Site License$ 3,120
- Global License$ 3,795

Leadership Perspectives from Industry Events
Search
Thought Leadership and Analyst Meet


Our Clients
6WResearch In News
- India Export Attractiveness Tracker 2026
- India Air Conditioner Market Set for Strong Rebound in 2026 After Weather-Led Correction and GST-Driven Recovery: 6Wresearch
- ADAS in India: How Automatic Emergency Braking, Blind Spot Detection & Driver Monitoring are Transforming Road Safety
- Doha a strategic location for EV manufacturing hub: IPA Qatar
- Demand for luxury TVs surging in the GCC, says Samsung
- Empowering Growth: The Thriving Journey of Bangladesh’s Cable Industry
Latest Reports
- Nicaragua RPG Gaming Market (2026-2032)
- New Zealand RPG Gaming Market (2026-2032)
- Netherlands RPG Gaming Market (2026-2032)
- Nauru RPG Gaming Market (2026-2032)
- Namibia RPG Gaming Market (2026-2032)
- Mozambique RPG Gaming Market (2026-2032)
- Montenegro RPG Gaming Market (2026-2032)
- Mongolia RPG Gaming Market (2026-2032)
- Monaco RPG Gaming Market (2026-2032)
- Micronesia RPG Gaming Market (2026-2032)
Industry Events and Analyst Meet

EV India Expo 2026

HIMTEX 2026

India Refining Summit 2026

India EV Show 2026

EV tech India Expo 2026
Whitepaper
- Middle East & Africa Commercial Security Market Click here to view more.
- Middle East & Africa Fire Safety Systems & Equipment Market Click here to view more.
- GCC Drone Market Click here to view more.
- Middle East Lighting Fixture Market Click here to view more.
- GCC Physical & Perimeter Security Market Click here to view more.